Transcription
Bioinformatics Toolbox 2User’s Guide
How to Contact The MathWorksWebNewsgroupwww.mathworks.com/contact TS.html Technical service@mathworks.cominfo@mathworks.comProduct enhancement suggestionsBug reportsDocumentation error reportsOrder status, license renewals, passcodesSales, pricing, and general information508-647-7000 (Phone)508-647-7001 (Fax)The MathWorks, Inc.3 Apple Hill DriveNatick, MA 01760-2098For contact information about worldwide offices, see the MathWorks Web site.Bioinformatics Toolbox User’s Guide COPYRIGHT 2003–2007 by The MathWorks, Inc.The software described in this document is furnished under a license agreement. The software may be usedor copied only under the terms of the license agreement. No part of this manual may be photocopied orreproduced in any form without prior written consent from The MathWorks, Inc.FEDERAL ACQUISITION: This provision applies to all acquisitions of the Program and Documentationby, for, or through the federal government of the United States. By accepting delivery of the Program orDocumentation, the government hereby agrees that this software or documentation qualifies as commercialcomputer software or commercial computer software documentation as such terms are used or definedin FAR 12.212, DFARS Part 227.72, and DFARS 252.227-7014. Accordingly, the terms and conditions ofthis Agreement and only those rights specified in this Agreement, shall pertain to and govern the use,modification, reproduction, release, performance, display, and disclosure of the Program and Documentationby the federal government (or other entity acquiring for or through the federal government) and shallsupersede any conflicting contractual terms or conditions. If this License fails to meet the government’sneeds or is inconsistent in any respect with federal procurement law, the government agrees to return theProgram and Documentation, unused, to The MathWorks, Inc.TrademarksMATLAB, Simulink, Stateflow, Handle Graphics, Real-Time Workshop, and xPC TargetBoxare registered trademarks, and SimBiology, SimEvents, and SimHydraulics are trademarks ofThe MathWorks, Inc.Other product or brand names are trademarks or registered trademarks of their respectiveholders.PatentsThe MathWorks products are protected by one or more U.S. patents. Please seewww.mathworks.com/patents for more information.
Revision HistorySeptember 2003June 2004November 2004March 2005May 2005September 2005November 2005March 2006May 2006September 2006March 2007Online onlyOnline onlyOnline onlyOnline onlyOnline onlyOnline onlyOnline onlyOnline onlyOnline onlyOnline onlyOnline onlyNew for Version 1.0 (Release 13SP1 )Revised for Version 1.1 (Release 14)Revised for Version 2.0 (Release 14SP1 )Revised for Version 2.0.1 (Release 14SP2)Revised for Version 2.1 (Release 14SP2 )Revised for Version 2.1.1 (Release 14SP3)Revised for Version 2.2 (Release 14SP3 )Revised for Version 2.2.1 (Release 2006a)Revised for Version 2.3 (Release 2006a )Revised for Version 2.4 (Release 2006b)Revised for Version 2.5 (Release 2007a)
ContentsGetting Started1What Is Bioinformatics Toolbox? . . . . . . . . . . . . . . . . . . . .Expected User . . . . . . . . . . . . . . . . . . . . . . . . . . . . . . . . . . . .1-21-3Installation . . . . . . . . . . . . . . . . . . . . . . . . . . . . . . . . . . . . . . .Required Software . . . . . . . . . . . . . . . . . . . . . . . . . . . . . . . . .Additional Software . . . . . . . . . . . . . . . . . . . . . . . . . . . . . . .1-51-51-5Features and Functions . . . . . . . . . . . . . . . . . . . . . . . . . . . .Data Formats and Databases . . . . . . . . . . . . . . . . . . . . . . . .Sequence Alignments . . . . . . . . . . . . . . . . . . . . . . . . . . . . . .Sequence Utilities and Statistics . . . . . . . . . . . . . . . . . . . . .Protein Property Analysis . . . . . . . . . . . . . . . . . . . . . . . . . .Phylogenetic Analysis . . . . . . . . . . . . . . . . . . . . . . . . . . . . . .Microarray Data Analysis . . . . . . . . . . . . . . . . . . . . . . . . . . .Mass Spectrometry Data Analysis . . . . . . . . . . . . . . . . . . . .Graph Theory Functions . . . . . . . . . . . . . . . . . . . . . . . . . . . .Graph Visualization . . . . . . . . . . . . . . . . . . . . . . . . . . . . . . .Statistical Learning and Visualization . . . . . . . . . . . . . . . .Prototyping and Development Environment . . . . . . . . . . . .Data Visualization . . . . . . . . . . . . . . . . . . . . . . . . . . . . . . . .Algorithm Sharing and Application Deployment . . . . . . . 1-19Sequence Analysis2Example: Sequence Statistics . . . . . . . . . . . . . . . . . . . . . . .Determining Nucleotide Content . . . . . . . . . . . . . . . . . . . . .Getting Sequence Information into MATLAB . . . . . . . . . . .Determining Nucleotide Composition . . . . . . . . . . . . . . . . .Determining Codon Composition . . . . . . . . . . . . . . . . . . . . .Open Reading Frames . . . . . . . . . . . . . . . . . . . . . . . . . . . . . .2-22-22-42-52-92-12v
Amino Acid Conversion and Composition . . . . . . . . . . . . . .2-15Example: Sequence Alignment . . . . . . . . . . . . . . . . . . . . . .Finding a Model Organism to Study . . . . . . . . . . . . . . . . . .Getting Sequence Information from a Public Database . . .Searching a Public Database for Related Genes . . . . . . . . .Locating Protein Coding Sequences . . . . . . . . . . . . . . . . . . .Comparing Amino Acid Sequences . . . . . . . . . . . . . . . . . . . .2-182-182-202-232-252-28Sequence Tool . . . . . . . . . . . . . . . . . . . . . . . . . . . . . . . . . . . . .Importing a Sequence . . . . . . . . . . . . . . . . . . . . . . . . . . . . . .Viewing Nucleotide Sequence Information . . . . . . . . . . . . .Searching for Words . . . . . . . . . . . . . . . . . . . . . . . . . . . . . . .Exploring Open Reading Frames . . . . . . . . . . . . . . . . . . . . .Viewing Amino Acid Sequence Statistics . . . . . . . . . . . . . . .2-372-372-392-412-422-45Multiple Sequence Alignment Viewer . . . . . . . . . . . . . . . .Loading Sequence Data and Viewing the PhylogeneticTree . . . . . . . . . . . . . . . . . . . . . . . . . . . . . . . . . . . . . . . . . .Selecting a Subset of Data from the Phylogenetic Tree . . .Aligning Multiple Sequences . . . . . . . . . . . . . . . . . . . . . . . .Adjusting Multiple Alignments Manually . . . . . . . . . . . . . .2-482-482-492-502-51Microarray Analysis3viContentsExample: Visualizing Microarray Data . . . . . . . . . . . . . .Overview of the Mouse Example . . . . . . . . . . . . . . . . . . . . .Exploring the Microarray Data Set . . . . . . . . . . . . . . . . . . .Spatial Images of Microarray Data . . . . . . . . . . . . . . . . . . .Statistics of the Microarrays . . . . . . . . . . . . . . . . . . . . . . . .Scatter Plots of Microarray Data . . . . . . . . . . . . . . . . . . . . .3-23-23-33-53-153-16Example: Analyzing Gene Expression Profiles . . . . . . .Overview of the Yeast Example . . . . . . . . . . . . . . . . . . . . . .Exploring the Data Set . . . . . . . . . . . . . . . . . . . . . . . . . . . . .Filtering Genes . . . . . . . . . . . . . . . . . . . . . . . . . . . . . . . . . . .Clustering Genes . . . . . . . . . . . . . . . . . . . . . . . . . . . . . . . . . .Principal Component Analysis . . . . . . . . . . . . . . . . . . . . . . .3-253-253-253-293-323-36
Phylogenetic Analysis4Example: Building a Phylogenetic Tree . . . . . . . . . . . . . .Overview for the Primate Example . . . . . . . . . . . . . . . . . . .Searching NCBI for Phylogenetic Data . . . . . . . . . . . . . . . .Creating a Phylogenetic Tree for Five Species . . . . . . . . . .Creating a Phylogenetic Tree for Twelve Species . . . . . . . .Exploring the Phylogenetic Tree . . . . . . . . . . . . . . . . . . . . .4-24-24-44-64-84-10Phylogenetic Tree Tool Reference . . . . . . . . . . . . . . . . . . .Opening the Phylogenetic Tree Tool . . . . . . . . . . . . . . . . . .File Menu . . . . . . . . . . . . . . . . . . . . . . . . . . . . . . . . . . . . . . . .Tools Menu . . . . . . . . . . . . . . . . . . . . . . . . . . . . . . . . . . . . . . .Windows Menu . . . . . . . . . . . . . . . . . . . . . . . . . . . . . . . . . . .Help Menu . . . . . . . . . . . . . . . . . . . . . . . . . . . . . . . . . . . . . . .4-144-144-164-254-344-34ExamplesASequence Analysis . . . . . . . . . . . . . . . . . . . . . . . . . . . . . . . . .A-2Microarray Analysis . . . . . . . . . . . . . . . . . . . . . . . . . . . . . . .A-2Phylogenetic Analysis . . . . . . . . . . . . . . . . . . . . . . . . . . . . . .A-2Indexvii
viiiContents
1Getting StartedThis chapter is an overview of the functions and features in BioinformaticsToolbox. An introduction to these features will help you to develop aconceptual model for working with the toolbox and your biological data.What Is BioinformaticsToolbox? (p. 1-2)Description of this toolbox and the intendeduserInstallation (p. 1-5)Required software and additional softwarefor developing advanced algorithmsFeatures and Functions(p. 1-7)Functions grouped into categories thatsupport bioinformatic tasks
1Getting StartedWhat Is Bioinformatics Toolbox?Bioinformatics Toolbox extends MATLAB to provide an integrated softwareenvironment for genome and proteome analysis. Scientists and engineerscan answer questions, solve problems, prototype new algorithms, and buildapplications for drug discovery and design, genetic engineering, and biologicalresearch.You can use the basic bioinformatic functions provided with this toolboxto create more complex algorithms and applications. These robust andwell-tested functions are the functions that you would otherwise have tocreate yourself. Data formats and databases — Connect to Web-accessible databaseswith genomic and proteomic data. Read and convert between multipledata formats. Sequence analysis — Determine the statistical characteristics of asequence, align two sequences, and multiply align several sequences.Model patterns in biological sequences using Hidden Markov Model (HMM)profiles. Phylogenetic analysis — Create and manipulate phylogenetic tree data. Microarray data analysis — Read, normalize, and visualize microarraydata. Mass spectrometry data analysis — Analyze and enhance raw massspectrometry data. Statistical learning — Classify and identify features in data sets withstatistical learning tools. Programming interface — Use other bioinformatic software (Bioperland BioJava) within the MATLAB environment.The field of bioinformatics is rapidly growing and will become increasinglyimportant as biology becomes a more analytical science. BioinformaticsToolbox provides an open environment that you can customize for developmentand deployment of the analytical tools you will need.Prototype and develop algorithms — Prototype new ideas in an open andextendable environment. Develop algorithms using efficient string processing1-2
What Is Bioinformatics Toolbox?and statistical functions, view the source code for existing functions, anduse the code as a template for customizing, improving, or creating your ownfunctions. See “Prototyping and Development Environment” on page 1-18.Visualize data — Visualize sequences and alignments, gene expressiondata, phylogenetic trees, mass spectrometry data, protein structure,and relationships between data with interconnected graphs. See “DataVisualization” on page 1-18.Share and deploy applications — Use an interactive GUI builder todevelop a custom graphical front end for your data analysis programs. Createstand-alone applications that run separately from MATLAB. See “AlgorithmSharing and Application Deployment” on page 1-19.1-3
1Getting StartedExpected UserBioinformatics Toolbox is for computational biologists and research scientistswho need to develop new algorithms or implement published ones, visualizeresults, and create stand-alone applications. Industry/Professional — Increasingly, drug discovery methods are beingsupported by engineering practice. This toolbox supports tool builderswho want to create applications for the biotechnology and pharmaceuticalindustries. Education/Professor/Student — This toolbox is well suited for learningand teaching genome and proteome analysis techniques. Educatorsand students can concentrate on bioinformatic algorithms instead ofprogramming basic functions such as reading and writing to files.While the toolbox includes many bioinformatic functions, it is not intendedto be a complete set of tools for scientists to analyze their biological data.However, MATLAB is the ideal environment for you to rapidly design andprototype the tools you need.1-4
InstallationInstallationYou don’t need to do anything special when installing Bioinformatics Toolbox.Install the toolbox from a DVD or Web release using The MathWorks installer. “Required Software” on page 1-5 — List of MathWorks products you need topurchase with Bioinformatics Toolbox “Additional Software” on page 1-5 — List of toolboxes from The MathWorksfor advanced algorithm developmentRequired SoftwareBioinformatics Toolbox requires the following products from The MathWorksto be installed on your computer:MATLABProvides a command-line interface and integratedsoftware environment for Bioinformatics Toolbox.Version 2.5 of Bioinformatics Toolbox requiresMATLAB Version 7.4 on the Release 2007a DVD.Statistics ToolboxProvides basic statistics and probability functionsthat the functions in Bioinformatics Toolbox use.Version 2.5 of Bioinformatics Toolbox requiresStatistics Toolbox Version 6.0 on the Release 2007aDVD.Additional SoftwareMATLAB and Bioinformatics Toolbox provide an open and extensible softwareenvironment. In this environment you can interactively explore ideas,prototype new algorithms, and develop complete solutions to problems inbioinformatics. The MATLAB language facilitates computation, visualization,prototyping, and deployment.Using Bioinformatics Toolbox in combination with other MATLAB toolboxesand products will allow you to solve multidisciplinary problems.1-5
11-6Getting StartedDistributedComputing ToolboxExecute bioinformatic algorithms onto a clusterof computers. For an example of batch processingthrough distributed computing, see the BatchProcessing of Spectra Using Distributed Computingdemo.Signal ProcessingToolboxProcess signal data from bioanalyticalinstrumentation. Examples include acquisitionof fluorescence data for DNA sequence analyzers,fluorescence data for microarray scanners, andmass spectrometric data from protein analyses.Image ProcessingToolboxCreate complex and custom image processingalgorithms for data from microarray scanners.OptimizationToolboxUse nonlinear optimization for predicting thesecondary structure of proteins and the structure ofother biological macromolecules.Neural NetworkToolboxUse neural networks to solve problems wherealgorithms are not available. For example, you cantrain neural networks for pattern recognition usinglarge sets of sequence data.Database ToolboxCreate your own in-house databases for sequencedata with custom annotations.MATLAB CompilerCreate standalone applications from MATLAB GUIapplications, and create dynamic link libraries fromMATLAB functions for use with any programmingenvironment.MATLAB Builderfor COMCreate COM objects to use with any COM-basedprogramming environment.MATLAB Builderfor ExcelCreate Excel add-in functions from MATLABfunctions to use with Excel spreadsheets.Excel LinkConnect Microsoft Excel with the MATLABworkspace to exchange data and to use thecomputational and visualization functions inMATLAB.
Features and FunctionsFeatures and FunctionsBioinformatics Toolbox includes many functions to help you with genome andproteome analysis. Most functions are implemented in M-code (the MATLABprogramming language) with the source available for you to view. This openenvironment lets you explore and customize the existing toolbox algorithmsor develop your own.Data Formats and Databases (p. 1-8)Access online databases, copy datainto the MATLAB workspace, andread and write to files with standardbioinformatic formats.Sequence Alignments (p. 1-9)Compare nucleotide or aminoacid sequences using pair-wiseand multiple sequence alignmentfunctions.Sequence Utilities and Statistics(p. 1-10)Manipulate sequences anddetermine physical, chemical,and biological characteristics.Protein Property Analysis (p. 1-11)Determine protein characteristicsand simulate enzyme cleavagereactions.Phylogenetic Analysis (p. 1-12)Explore phylogenetic data withfunctions and a GUI to drawphylograms (trees)Microarray Data Analysis (p. 1-12)Read, filter, normalize, and visualizemicroarray data.Mass Spectrometry Data Analysis(p. 1-13)Preprocess raw mass spectrometrydata and use statistical learningfunctions to identify patterns.Graph Theory Functions (p. 1-16)Apply basic graph theory algorithmsto sparse matrices.Graph Visualization (p. 1-17)View relationships between datavisually with interactive maps,hierarchy plots, and pathways.1-7
1Getting StartedStatistical Learning andVisualization (p. 1-17)Classify and identify features indata sets, set up cross-validationexperiments, and compare differentclassification methods.Prototyping and DevelopmentEnvironment (p. 1-18)Create new algorithms, try newideas, and analyze alternatives.Data Visualization (p. 1-18)Visually compare pair-wise sequencealignments, multiply alignedsequences, gene expression datafrom microarrays, and plot nucleicacid and protein characteristics.Algorithm Sharing and ApplicationDeployment (p. 1-19)Create GUIs and stand-aloneapplications.Data Formats and DatabasesBioinformatics Toolbox supports access to many of the databases on theWeb and other online data sources. It also reads many common genome fileformats, so that you do not have to write and maintain your own file readers.Web-based databases — You can directly access public databases on theWeb and copy sequence and gene expression information into MATLAB.The sequence databases currently supported are GenBank (getgenbank),GenPept (getgenpept), European Molecular Biology Laboratory EMBL(getembl), and Protein Data Bank PDB (getpdb). You can also access datafrom the NCBI Gene Expression Omnibus (GEO) web site by using a singlefunction (getgeodata).Get multiply aligned sequences (gethmmalignment), hidden Markov modelprofiles (gethmmprof), and phylogenetic tree data (gethmmtree) from thePFAM database.Gene Ontology database — Load the database from the Web into a geneontology object (geneont). Select sections of the ontology with methods for thegeneont object (getancestors, getdescendants, getmatrix, getrelatives),and manipulate data with utility functions (goannotread, num2goid).1-8
Features and FunctionsRead data from instruments — Read data generated from genesequencing instruments (scfread, joinseq, traceplot), mass spectrometers(jcampread), and Agilent microarray scanners (agferead).Reading data formats — The toolbox provides a number of functions forreading data from common bioinformatic file formats. Sequence data: GenBank (genbankread), GenPept (genpeptread), EMBL(emblread), PDB (pdbread), and FASTA (fastaread) Multiply aligned sequences: ClustalW and GCG formats (multialignread) Gene expression data from microarrays: Gene Expression Omnibus (GEO)data (geosoftread), GenePix data in GPR and GAL files (gprread,galread), SPOT data (sptread), Affymetrix GeneChip data (affyread),and ImaGene results files (imageneread).Note: The function affyread only works on PC supported platforms. Hidden Markov model profiles: PFAM-HMM file (pfamhmmread)Writing data formats — The functions for getting data from the Webinclude the option to save the data to a file. However, there is a function towrite data to a file using the FASTA format (fastawrite).BLAST searches — Request Web-based BLAST searches (blastncbi), getthe results from a search (getblast) and read results from a previously savedBLAST formatted report file (blastread).MATLAB has built-in support for other industry-standard file formatsincluding Microsoft Excel and comma-separated value (CSV) files. Additionalfunctions perform ASCII and low-level binary I/O, allowing you to developcustom functions for working with any data format.Sequence AlignmentsYou can select from a list of analysis methods to perform pair-wise or multiplesequence alignment.Pair-wise sequence alignment — Efficient MATLAB implementationsof standard algorithms such as the Needleman-Wunsch (nwalign) andSmith-Waterman (swalign) algorithms for pair-wise sequence alignment.1-9
1Getting StartedThe toolbox also includes standard scoring matrices such as the PAM andBLOSUM families of matrices (blosum, dayhoff, gonnet, nuc44, pam).Visualize sequence similarities with seqdotplot and sequence alignmentresults with showalignment.Multiple sequence alignment — Functions for multiple sequencealignment (multialign, profalign) and functions that support multiplesequences (multialignread, fastaread, showalignment). There is also agraphical interface (multialignviewer) for viewing the results of a multiplesequence alignment and manually making adjustment.Multiple sequence profiles — MATLAB implementations formultiple alignment and profile hidden Markov model algorithms(gethmmprof, gethmmalignment, gethmmtree, pfamhmmread, hmmprofalign,hmmprofestimate, hmmprofgenerate, hmmprofmerge, hmmprofstruct,showhmmprof).Biological codes — Look up the letters or numeric equivalents forcommonly used biological codes (aminolookup, baselookup, geneticcode,revgeneticcode).Sequence Utilities and StatisticsYou can manipulate and analyze your sequence to gain a deeper understandingof your data. Use a graphical user interface (GUI) with many of the sequencefunctions in Bioinformatics Toolbox (seqtool).Sequence conversion and manipulation — The toolbox provides routinesfor common operations, such as converting DNA or RNA sequences to aminoacid sequences, that are basic to working with nucleic acid and proteinsequences (aa2int, aa2nt, dna2rna, rna2dna, int2aa, int2nt, nt2aa, nt2int,seqcomplement, seqrcomplement, seqreverse).You can manipulate your sequence by performing an in-silico digestion withrestriction endonucleases (restrict) and proteases (cleave).Sequence statistics — Determine various statistics about a sequence(aacount, basecount, codoncount, dimercount, nmercount, ntdensity,codonbias, cpgisland, oligoprop), search for specific patterns within asequence (seqshowwords, seqwordcount), or search for open reading frames1-10
Features and Functions(seqshoworfs). In addition, you can create random sequences for test cases(randseq).Sequence utilities — Determine a consensus sequence from a set of multiplyaligned amino acid, nucleotide sequences (seqconsensus, or a sequenceprofile (seqprofile). Format a sequence for display (seqdisp) or graphicallyshow a sequence alignment with frequency data (seqlogo).Additional functions in MATLAB efficiently handle string operations withregular expressions (regexp, seq2regexp) to look for specific patterns in asequence and search through a library for string matches (seqmatch).Look for possible cleavage sites in a DNA/RNA sequence by searching forpalindromes (palindromes).Protein Property AnalysisYou can use a collection of protein analysis methods to extract informationfrom your data. The toolbox provides functions to calculate various propertiesof a protein sequence, such as the atomic composition (atomiccomp), molecularweight (molweight), and isoelectric point (isoelectric). You can cleavea protein with an enzyme (cleave, rebasecuts) and create distance andRamachandran plots for PDB data (pdbdistplot, ramachandran). Thetoolbox contains a graphical user interface for protein analysis (proteinplot)and plotting 3-D protein and other molecular structures with informationfrom molecule model files, such as PDB files (molviewer).Amino acid sequence utilities — Calculate amino acid statistics for asequence (aacount) and get information about character codes (aminolookup).1-11
1Getting StartedPhylogenetic AnalysisFunctions for phylogenetic tree building and analysis.Phylogenetic tree data — Read and write Newick-formatted tree files(phytreeread, phytreewrite) into the MATLAB workspace as phylogenetictree objects (phytree).Create a phylogenetic tree — Calculate the pair-wise distance betweenbiological sequences (seqpdist), estimate the substitution rates (dnds,dndsml), build a phylogenetic tree from pair-wise distances (seqlinkage,seqneighjoin, reroot), and view the tree in an interactive GUI that allowsyou to view, edit, and explore the data (phytreetool or view). This GUI alsoallows you to prune branches, reorder, rename, and explore distances.Phylogenetic tree object methods — You can access the functionalityof the phytreetool GUI using methods for a phylogenetic tree object(phytree). Get property values (get) and node names (getbyname). Calculatethe patristic distances between pairs of leaf nodes (pdist, weights)and draw a phylogenetic tree object in a MATLAB figure window as aphylogram, cladogram, or radial treeplot (plot). Manipulate tree data byselecting branches and leaves using a specified criterion (select, subtree)and removing nodes (prune). Compare trees (getcanonical) and useNewick-formatted strings (getnewickstr).Microarray Data AnalysisMATLAB is widely used for microarray data analysis. However, the standardnormalization and visualization tools that scientists use can be difficult toimplement. Bioinformatics Toolbox includes these standard functions.Microarray data — Read Affymetrix GeneChip files (affyread) and plotdata (probesetplot), ImaGene results files (imageneread), SPOT files(sptread) and Agilent microarray scanner files (agferead). Read GenePixGPR files (gprread) and GAL files (galread). Get Gene Expression Omnibus(GEO) data from the web (getgeodata) and read GEO data from files(geosoftread).A utility function (magetfield) extracts data from one of the microarrayreader functions (gprread, agferead, sptread, imageneread).1-12
Features and FunctionsMicroarray normalization and filtering — The toolbox provides anumber of methods for normalizing microarray data, such as lowessnormalization (malowess) and mean normalization (manorm), or acrossmultiple arrays (quantilenorm). You can use filtering functions to cleanraw data before analysis (geneentropyfilter, genelowvalfilter,generangefilter, genevarfilter), and calculate the range and variance ofvalues (exprprofrange, exprprofvar).Microarray visualization — The toolbox contains routines for visualizingmicroarray data. These routines include spatial plots of microarray data(maimage, redgreencmap), box plots (maboxplot), loglog plots (maloglog),and intensity-ratio plots (mairplot). You can also view clustered expressionprofiles (clustergram, redgreencmap). You can create 2-D scatter plots ofprincipal components from the microarray data (mapcaplot).Microarray utility functions — Use the following functions to work withAffymetrix and GeneChip data sets. Get library information for a probe(probelibraryinfo), gene information from a probe set (probesetlookup),and probe set values from CEL and CDF information (probesetvalues).Show probe set information from NetAffx (probesetlink) and plot probeset values (probesetplot).The toolbox accesses statistical routines to perform cluster analysis andto visualize the results, and you can view your data through statisticalvisualizations such as dendrograms, classification, and regression trees.Mass Spectrometry Data AnalysisThe mass spectrometry functions preprocess and classify raw data fromSELDI-TOF and MALDI-TOF spectrometers.Reading raw data into MATLAB — Load raw mass/charge and ionintensity data from comma-separated-value (CSV) files, or read a JCAMP-DXformatted file with mass spectrometry data (jcampread) into MATLAB.You can also have data in TXT files and use the importdata function.Preprocessing raw data — Resample high-resolution data to a lowerresolution (msresample) where the extra data points are not needed. Correctthe baseline (msbackadj). Align a spectrum to a set of reference masses1-13
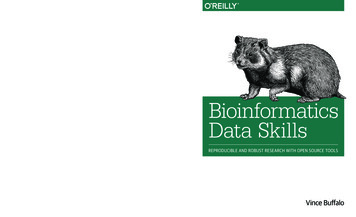
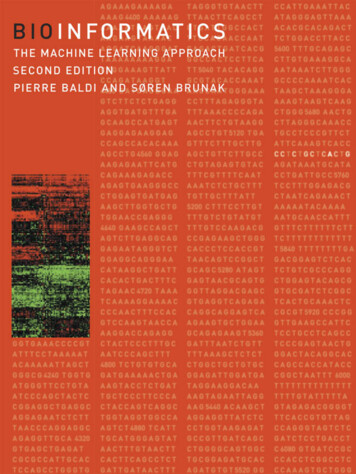
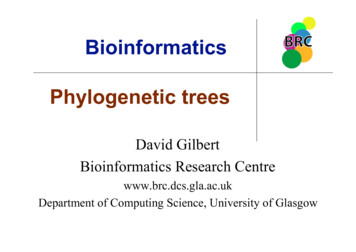
1Getting Started(msalign) and visually verify the alignment (msheatmap). Normalize thearea between spectra for comparing (msnorm), and filter out noise (mslowessand mssgolay).Spectrum analysis — Load spectra into a GUI (msviewer) for selecting masspeaks and further analysis.The following graphic illustrates the roles of the various mass spectrometryfunctions in Bioinformatics Toolbox:1-14
Features and FunctionsmzXML FilemzxmlreadmzXML Structuremzxml2peaksPeak Lists(Centroided esampleReconstructedDataSemicontinuous SignalmsviewerMassSpectraViewermsresample1-15
1Getting StartedGraph Theory FunctionsGraph theory functions in Bioinformatics Toolbox apply basic graph theoryalgorithms to sparse matrices. A sparse matrix represents a graph, anynonzero entries in the matrix represent the edges of the graph, and the valuesof these entries represent the associated weight (cost, distance, length, orcapacity) of the edge. Graph algorithms that use the weight information willcancel the edge if a NaN or an Inf is found. Graph algorithms that do not usethe weight information will consider the edge if a NaN or an Inf is found,because these algorithms look only at the connectivity described by the sparsematrix and not at the values stored in the sparse matrix.Sparse matrices can represent four types of graphs: Directed Graph — Sparse matrix, either double real or logical. Row(column) index indicates the source (target) of the edge. Self-loops (valuesin the diagonal) are allowed, although most of the algorithms ignore thesevalues. Undirected Graph — Lower triangle of a sparse matrix, either
Database Toolbox Create your own in-house databases for sequence data with custom annotations. MATLAB Compiler Create standalone applications from MATLAB GUI applications, and create dynamic link libraries from MATLAB functions