Transcription
Comparison of In-Situ Pressure and DOW Doppler Winds in a Tornadoand RHI Vertical Slices through 4 Tornadoes during 1996-2004Joshua WurmanCenter for Severe Weather Researchjwurman@cswr.org1. Introduction to Part AConditions inside tornadoes are difficult toobserve directly due to the transience, relativerarity, size, and violence of the phenomena.Accurate climatologies of the core flowdiameter of tornadoes, and actual core-flowswaths (as distinguished from damage swaths),are lacking. However, a rough estimate is thatapproximately 600 tornadoes occur in themidwestern United States each year (about 1/2of the total in the United States), over an areaof approximately 1.5 x 10⁶ km2. Veryapproximately, the swath over which the coreflow of an average tornado passes can becalculated by assuming a 100 m diameter and a10 km length, resulting in a swath extendingover 1 km2. Therefore, approximately 600km2 out of 1.5 x 10⁶ km2 of the midwest isimpacted by core flow winds every year. Theresultant mean recurrence interval for coreflow passage over any particular location is2500 years. The passage of significant, say 70ms-1 or greater, core flow winds is even rarer,with recurrence intervals of 10,000 years orlonger depending on thresholds andassumptions.Not surprisingly, in-situ observations oftornadoes are rare, and accomplishedexclusively, or nearly so, through the use oftargeted instrumentation. Winn et al. (1999)described the first in-situ measurements insidea large tornado near Allison, Texas that wasrated F4. The F3 damage swath was 1.3 kmacross. Doppler On Wheels (DOW) data at arange of 9 km showed that the core flow wasapproximately 800 m with peak winds of aboutTim SamarasApplied Research Associatestsamaras@ecentral.com85 ms-1 Winn et al (1999) estimated that theirobservations might have been within 660 m ofthe tornado center, but a detailed comparisonwith DOW data, which might permit accuratenavigation of the in situ observations withrespect to the core flow, has not, as of yet, beenundertaken.Recently, new technology and techniques havebeen developed that permit more frequent,though still somewhat rare, in-situ pressureobservations within the core flow regions oftornadoes (Samaras and Lee, 2004, thisvolume). Pressure deficits of 40 hPa and 100hPa were measured in tornadoes in 2003 andadditional observations were obtained in 2004.In one of these cases, DOW high resolutionDoppler velocity measurements were availablecontemporaneously with the passage of thecore flow over the instrument, permitting adetailed analysis. Preliminary analyses arepresented below.2. Tornado overviewOn 15 May 2003, a tornadic supercellthunderstorm crossed the northern Texaspanhandle and produced several tornadoes.Some of these were observed by the DOWradars and one by the in situ instrument.a. Navigation of DOW dataThe DOWs were in motion during much of thelifetime of the tornadoes, but since thetopography was very flat, powerlines and otherfeatures provided a rich clutter targetenvironment. It was possible to determine theDOW location within 50-100 m during nearly
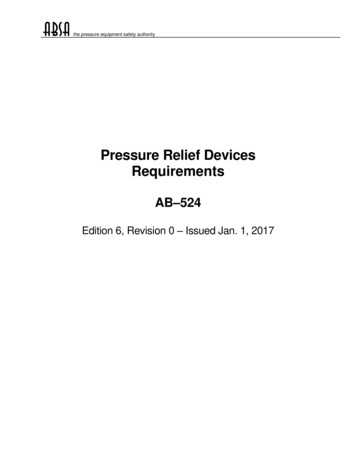
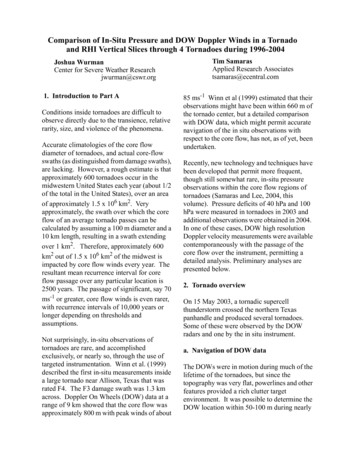
Street Atlas USA 2004 PlusOklahomaTornado 3TexasKerrickIn-SituObservationMalletTornado 2Stratford10 kmTornado 1DOW3LocationsDuring LowestSweep ThroughTornadoes 2003 DeLorme. Street Atlas USA 2004 Plus.www.delorme.comScale 1 : 187,500TN0MN (8.2 E)01122334455mikm1" 4.76 km11-0Figure 1: Tracks of three tornadoes observed by DOW near andduring DatatheZoomtimeof the in-situ observation. Tornado 2 crossed the surface probe at the indicatedlocation while the tornado was under continuous observation by the travelling DOW.Red arrows represent DOW locations during lowest elevation sweeps occurring atalternating intervals of 48 s and 63 s. Dashed lines connect selected contemporaneousobservations of tornado 1 and tornado 2. Tornado 3 was a weak but large tornadothat contained numerous sub-tornado-scale vortices.
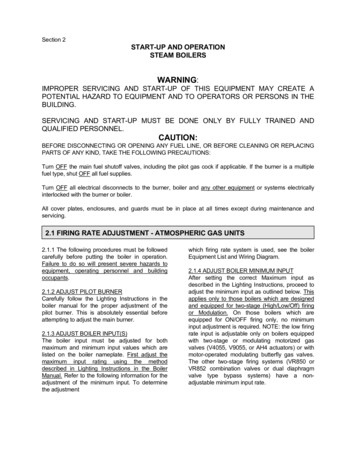
every low level scan. Video of the DOW fleetprovided further confirmation of DOWlocations, and the precise time of roadcrossings. Using the Doppler velocity ofclutter targets and video evidence of roadcrossings, the location of the DOW could bedetermined for all low level scans. Theorientation of the DOW was measured usingthe clutter grid to within 1 .b. Tornado tracksAt lease three separate tornadoes wereobserved by the DOW surrounding the time ofthe in situ observations. The DOW conductednear-surface sweeps at alternating intervals of48 s and 63 s, permitting a detailed retrieval ofthe history of the track, intensity, core flowdiameter, and other parameters of thetornado.The DOW-derived tracks of thesetornadoes are illustrated in Figure 1. Theselonger track tornadoes rotated cyclonically,though there were shorter lived tornado-Tornado Intensity vs Time160Center of core flowregion crossessurface instrumentation23:00:58.1 UTCDOW Delta-V (ms-1)140012312090 ms-1groundrelativevelocity@120 m 008370084000Time (seconds)UTC22:4022:5023:0023:10Figure 2: Time history of tornado intensity, as manifested by the difference in Dopplervelocities measured across the core flow region of each tornado. The time of the in situobservation in Tornado #2 is demarked.23:20
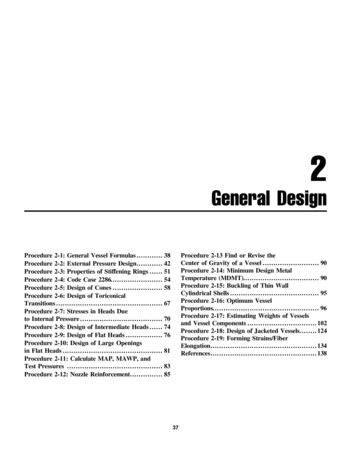
strength circulations that rotatedanticyclonically. The time history of theintensity of these tornadoes, as indicated bythe difference in Doppler velocities across thecore flow region, is illustrated in Figure 2. (Ashort lived tornado, #0, occurred before theplotted period.) Tornado #1 reached moderateintensity then dissipated as Tornado #2intensified. The location of Tornado #1suggested that it was not associated classicallywith the mesocyclone and that the #1-#2transition was not a classic cyclic genesis.Tornado #2 reached a peak intensity of nearly160 ms-1 delta-V with peak ground relativevelocities on the south (right) side of the coreflow near 90 ms-1 at approximately 22:49UTC, at 120 m AGL, then weakenedconsiderably as it tracked northeastward acrossthe surface instrumentation. The center of thecore flow region of the tornado crossed theinstrumentation at 23:00:58.1 /- 1.0 secondsUTC. The tornado proceeded northeastward,then dissipated as the large but weakTornado #3 formed. After Tornado #3 becameless distinct, a strong rear flank downdraft,with Doppler velocities up to 63 ms-1 at 50 m87587086530 sec450 mcore flow passagePressure (hPa)860855850845Vortex b840835Vortex a830100120140UTC225957Meters from center: e (s)Figure 3: Time history of pressure measured at in situ probe during the passage of the tornado. Thecore flow region, as measured by the DOW radar, crossed the probe during the indicated period.Individual short-duration downward spikes in pressure were likely associated with weaksub-tornado-scale vortices which were evident in video, but not resolved by the DOW. Timesrecorded by the in situ probe deviated slightly from DOW times. Probe times are used in the discussionof the analysis for simplicity. Multiple vortices a and b are labelled.
agl, developed, and at least one additionaltornado, not tracked precisely by the DOWs,was observed.minimum pressure was approximately 842 hPaat approximately T 200 s (23:01:15 UTC).This is very near to, but not precisely, theprobe crossing time indicated by the DOWdata (23:00:58 UTC).3. In-situ observationsA deployable in-situ probe was deployed nextto a roadway northwest of Stratford, Texas,ahead of Tornado #2 (see Fig. 1). The tornado,manifested visibly as a large bowl-shapedlowering with considerable surrounding rainand embedded small condensation funnels,crossed the roadway and the probe atapproximately 23:01 UTC.4. Comparisons between in-situ and DOWobservations.a. Basic Core FlowThe existence of DOW Doppler velocity dataover the surface probe at the time of thetornado’s passage provided the uniqueopportunity to compare these diversemeasurements. In order to compare twodimensional radar measurements withstationary zero-dimensional surface data, aspace-time correction was conducted, slidingthe quasi-steady-state tornado velocity fielddefined by the DOW over the surface probe.DOW observations permitted the precisemeasurement of both tornado translationalvelocity (Figure 4) and core flow diameter.(Figure 5) as the tornado passed over thesurface probe. Space-time conversions wereProbe instrumentation is described in detailelsewhere (see Samaras and Lee, 2004, thisvolume). Pressure measurements at intervalsof 0.1 s were obtained and are plotted inFigure 3. All times are seconds after 22:57:57,the nominal start time of probe recording.Pressure drops from approximately 872 hPa atT 100 s to an extreme minimum of 832 hPa atT 204 s, then recovers to 872 hPa by T 265 s.Excluding two downward spikes in thepressure, lasting for less than 10 s each, theTornado Translational Speed26.0Translational Speed 082500828008310083400Time (s)Figure 4: Time history of translational speed of Tornado #2.as determined using DOW-determined tornado centers.
225901230008230115230222230329480 m core flow diameterFigure 5: Low level DOW radar sweep over Tornado #2 near the time of the in-situ observation.Right: Doppler velocity showing inbound (blue) and outbound (red) couplet. Core flow diameterof 400 m is outlined in pink. Pink arcs at 1 km and 2 km range and arrows illustrate the resultsof a space-time conversion and the time of the crossing of different regions of the storm over thein situ probe. Tick marks 200 m.plotted on the time history of pressure(Figure 3), and on the low level radar sweep(Figure 5). The core flow region crossed theprobe in approximately 30 s as illustrated inFigure 3.Using the pressure history from the in-situobservations and the translational velocity ofthe tornado obtained from DOW observations,cyclostrophic tangential windspeeds werecalculated (Figure 6). This calculationassumed that the pressure measured at thesurface could be related to the tangential flowof the tornado above the near-surface cornerflow. The precise geometry of the core flowpassage over the probe affected thecyclostrophic wind calculation. Since theDOW was in motion and at moderate range tothe probe, it was difficult to be definitiveconcerning this geometry. DOW observationssuggested that the center of the core flowregion passed south of the probe. However,observers nearer to the probe, including one ofobliqueRelative possiblepaths ofprobe throughcore flowdirectFigure 6: Schematic of a direct and glancingpassage of the core flow region over the probe
us (Samaras) believed that the center of thetornado crossed the probe. These twoscenarios are illustrated below in Figure 6.Cyclostrophic wind profiles calculated usingthe two above scenarios are illustrated inFigure 7. The results are remarkably good andin close agreement with DOW Dopplervelocity observations. Peak winds ofapproximately 40 ms-1 are near DOWestimated tangential flow estimates of 53 ms-1(based on delta-V / 2). Peak cyclostrophicwinds occur at just over 200 m distance fromthe center, very consistent with the 450 m coreflow diameter measured by the DOW.Cyclostrophic Wind6050Windspeed 0032001002003300Distance from Center (m)-300-200-1000Figure 7: Calculated cyclostrophic tangential winds in Tornado #2 based on in situ pressureobservations and DOW translational speed and core flow navigation data. The oblique curverepresents a core flow center passing 100 m south of the probe. Since the DOW measured thethe core flow diameter at 450 m, the probe would have still experienced a substantial periodunder the core flow region. An eight second box car average and spike elimination has beenconducted on the pressure data to smooth the velocity calculation and eliminate pressure gradientreversals.
b. Sub-vortices and other featuresIn addition to the one minute scale drop andrise in pressure discussed above, there wereother prominent features that could becorrelated to structures in and near the tornado.Well before the tornado core flow passage, at acalculated range of 600 m to the tornadocenter, a pressure minimum approximately 8hPa lower than the longer period trendlineoccurred. The low level DOW radar sweepthat most closely correlates with the time ofthis event occurred at 23:00:08-23:00:12 UTCand is shown in Figure 8. The low reflectivityeye of the tornado had a complex structurewith an inward protuberance of highreflectivity 600 m ahead of the path of thetornado and over the in situ probe at this time.The velocity structure in and near theprotuberance was not well resolved. Stronginbound Doppler velocities adjacent tooutbounds suggested unresolved structures.During and immediately after the core flowpassage, two short duration downward spikesof pressure occurred. The duration of eachspike was less than 10 s, suggesting a spatialscale of about 100 m, and the pressure dropswere 13 and 15 hPa. One hundred meterscales were not well resolved by the DOW at arange of over 11 km despite short range gatesand oversampling (See Wurman andAlexander 2004, this volume). The actualDOW beamwidth at this range was nearly200 m.Figure 8. Similar to Figure 5, but from previous low level DOW scan at 23:00:08 UTC.Tick marks are 200 m. Doppler velocity (left) and radar reflectivity (right). Core flow regiondelineated with white circle diameter 600 m. Reflectivity protuberance and velocity perturbationsevident 600 m (40 s) ahead of tornado center as illustrated with pink arrow.
However, visual observationstaken near the probe andvisual and DOW observationsfrom close range to Tornado#3, which had a similarappearance, revealed thatboth tornadoes had amultiple-vortex structure.p850Pressure 310031103120Distance (m) (arbitrary offset)Figure 9: Pressure history in multiple vortex AvCyclostrophic Tangential Wind (ms-1)Using similar methodologiescyclostrophic winds in themultiple vortices could becalculated. The translationalspeed of the vortices withrespect to the parent tornadowere not known. Wurman(2002) presented evidencethat some multiple vorticesmoved at roughly 0.5 - 1.0 ofthe tangential velocity of thetornado, suggesting a speedof approximately 20-40 ms-1in this case. Since it wasbelieved that the probe wasimpacted by the northernside of the core flow, thetranslational speed of thetornado and the relativetranslational speeds of thevortices would subtract,resulting in speeds ofapproximately 15 m/s fromeast to west. This wasconsistent with videoevidence of smallcondensation funnelsmoving from east to west tothe north of the probe.Using the translational valueof 15 ms-1 results in thespatial pressure distributionshown in Figure 8 andcyclostrophic tangentialwind profile shown inFigure 9 for vortex a andMultiple Vortex A4035302520v151050300030203040306030803100Distance (m) (arbitrary offset)Figure 10: Cyclostrophic winds in multiple vortex a31203140
The possible twodimensional structure ofthe multiple vortices wassuggested by observationsin Tornado #3 taken 13minutes after the in situobservations. Figures 1213 showed the complexstructure of Tornado #3which contained severalsub-vortices with scales ofapproximately 100 m (100m diameter circlesdelineate some of thevortices in Figure 13.) anddelta-v’s of approximately40-70 ms-1, implyingtangential velocities of 2035 ms-1, reasonablyconsistent with thecalculated cyclostrophicwinds shown in Figures 9and 11.Multiple Vortex Bp860Pressure 331033203330Distance (m) (arbitrary offset)Figure 11: Pressure history in multiple vortex BvCyclostrophic Tangential Wind (ms-1)Figures 10 and 11 forvortex b. Strong gradientsin pressure wereassociated with onlymoderate cyclostrophicwinds due to the smallradius of curvature in thevortices. Peak tangentialwinds in vortex a werenear 30 ms-1 with valuesof 40-50 ms-1 in vortex b.The latter values werecomparable to thetangential velocities of theparent tornado.Smoothing had beenapplied to the pressurefield to remove shortperiod reversals in sign ofthe pressure 290330033103320Distance (m) (arbitrary offset)Figure 12: Cyclostrophic winds in multiple vortex B3330
Figure 11 (top) and Figure 12 (bottom). DOW Doppler velocity and reflectivity in Tornado #3.Several sub-tornado-scale vortices are delineated with 100 m diameter white circles. Tick marks are 200 m.
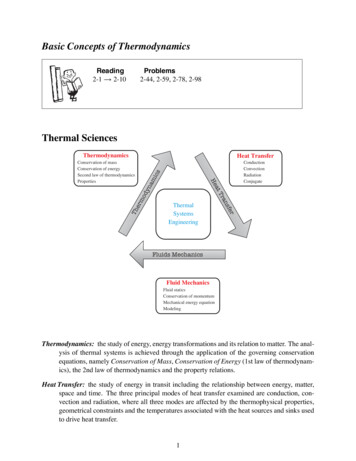
PPIB. Vertical Slice (RHI) Data in Tornadoese1. Rolla, Kansas, 30 May 1996The first vertical RHI-type radar sweepsresolving the core flow of a tornado werecollected by the DOW1 radar system in 1996(Fig 12) on 30 May near Rolla, Kansas.While velocity data collected by the DOW1near the end of its life were noisy, thevertical structure of the velocity andreflectivity field of the tornado wereresolved.Since the slope of a tornado is not generallyin the plane of the RHI scans, and is oftennot constant in direction or magnitude, RHIslices typically cross through the core flowand eye from one side to the other (Fig. 13),resulting in scans with an unusualappearance. Furthermore, beams that passdirectly through the center of the core flowregion intersect the highest wind speedportion of the core flow where that flow isnearly perpendicular to the beam, resultingin near-zero Doppler velocity.dcedcbbRHI West edge of eyeboutbound Vedge of eye near groundRHI West side of eyecoutbound VEven in the noisy 1996 data, maximum wind dspeed near the surface, as well as the pseudoeye surrounding the true eye of the tornadowere evident. The true eye of the tornadoand inner rings of lofted dust were onlybarely resolved to radar sensitivity problems.RHI Near Center of eyeNear zero VFigure 13: Schematicrepresentation of one RHI slicethrough tornado core floweFigure 14: (right) Several RHI slicesthrough the Rolla, Kansas tornadoof 30 May 1996. Lines lines on PPIslice show location of RHI slices,of which 4 are shown.RHI East side of eyeinbound Vb
aebfCorefbCorecCoreCoreFig. 15: Several selected RHI slices through theviolent Spencer, South Dakota tornado of 1998.(a) PPI with approx RHI locations. (b) RHIcrosses eye at 1.5 km AGL. (f) RHI interceptscenter of core flow near ground, allowingcalculation of divergence. Note small velocitiesin core region indicative of translational motionof tornado. (see Alexander and Wurman 2004)2. Spencer, South Dakota 30 May 1998dSubsequently, with improved radartechnology, RHI slices were collected in theSpencer, South Dakota (1998) tornado, byDOW3, revealing the detailed verticalstructure of the core flow and surroundingregion (Alexander and Wurman 2004)(Fig 14),and combined with horizontal scans permittingthe vertical structure of peak winds to beresolved down to 30-50 m AGL (Wurman andAlexander 2004). Low level convergence of0.06 s-1 in this tornado was first measuredusing this type of data.
CoreCoreCoreCoreFig 16: PPI and RHI slices through Attica, Kansas tornadoon 12 May 2004. RHI slice intercepts eye in bottompanelsFig. 18: PPI and RHI slices through dissipatingtornado in rope stage in Belleville, Kansas on24 May 2004. RHI slice intercepts core flowregion twice3. Attica, Kansas 12 May 2004The DOWs were able to collect verticalstructure data using RHI slices in twotornadoes during 2004, retrieving excellentquality velocity and reflectivity data. On 12May 2004, a tornado passed near Attica,Kansas and a DOW collected several verticalcross-sections through the core flow / eye andsurrounding region as shown in Fig 16.4. Belleville, Kansas 24 May 2004A DOW collected vertical cross-section RHIdata in a dying tornado, in the “rope” stage, inBelleville, Kansas on 24 May 2004. Thetornado was highly contorted and this resultedin single RHI sweeps intersecting the coreflow region twice, as illustrated schematicallyin Fig 17, resulting in the very unusualDoppler velocity image shown in Fig 18.Fig. 17. Schematic representation of RHI slicethat crosses core flow region of a roping tornadotwice, once near the ground and again aloft.This results in the unusual Doppler image shownin Fig. 18.
described the first in-sit u measurements inside a large tornado near Allison, Texas that was rated F4. The F3 damage swath was 1.3 km across. Doppler On Wheels (DOW) data at a range of 9 km showed that the c