Transcription
R E S E A R C H R E P O RT148bitreInfrastructureRoad Construction Cost and InfrastructureProcurement Benchmarking: 2017 update
Bureau of Infrastructure, Transport and Regional EconomicsRoad Construction Cost and InfrastructureProcurement Benchmarking: 2017 updateDepartment of Infrastructure, Regional Development and CitiesCanberra, Australia
Commonwealth of Australia 2018ISSN: 1440-9569ISBN: 978-1-925531-96-1March 2018/INFRA3454Cover photograph courtesy of istockphoto.Ownership of intellectual property rights in this publicationUnless otherwise noted, copyright (and any other intellectual property rights, if any) in this publication is owned by theCommonwealth of Australia (referred to below as the Commonwealth).DisclaimerThe material contained in this publication is made available on the understanding that the Commonwealth is not providingprofessional advice, and that users exercise their own skill and care with respect to its use, and seek independent advice ifnecessary.The Commonwealth makes no representations or warranties as to the contents or accuracy of the information containedin this publication. To the extent permitted by law, the Commonwealth disclaims liability to any person or organisation inrespect of anything done, or omitted to be done, in reliance upon information contained in this publication.Creative Commons licenceWith the exception of (a) the Coat of Arms; and (b) the Department of Infrastructure’s photos and graphics, copyright inthis publication is licensed under a Creative Commons Attribution 3.0 Australia Licence.Creative Commons Attribution 3.0 Australia Licence is a standard form licence agreement that allows you to copy,communicate and adapt this publication provided that you attribute the work to the Commonwealth and abide by theother licence terms. A summary of the licence terms is available from .en. The full licence terms are available from lcode.Use of the Coat of ArmsThe Department of the Prime Minister and Cabinet sets the terms under which the Coat of Arms is used. Please referto the Department’s Commonwealth Coat of Arms and Government branding web page http://www.dpmc.gov.au/guidelines/index.cfm#brand and, in particular, the Guidelines on the use of the Commonwealth Coat of Arms publication.An appropriate citation for this report is:Bureau of Infrastructure, Transport and Regional Economics (BITRE), 2018, Road construction cost and infrastructureprocurement benchmarking: 2017 update, BITRE, Canberra ACT.Contact usThis publication is available in PDF format. All other rights are reserved, including in relation to any Departmental logos ortrade marks which may exist. For enquiries regarding the licence and any use of this publication, please contact:Bureau of Infrastructure, Transport and Regional Economics (BITRE)Department of Infrastructure and Regional Development and CititesGPO Box 501, Canberra ACT 2601, l) 61 2 6274 7210(international) 61 2 6274 6855bitre@infrastructure.gov.auwww.bitre.gov.au
At a glance In November 2015, the Transport and Infrastructure Council (TIC) approved publicationof the first national pilot study report benchmarking infrastructure procurement processesand construction costs. Council also agreed that follow-up benchmarking be undertaken in2017 (this report). For the 2017 update, seven jurisdictions provided data for 32 road construction projectsand 23 procurement processes either completed or in-delivery since mid-2015. The sevenjurisdictions that provided project data for the 2017 update were: New South Wales,Victoria,Queensland, South Australia,Western Australia, Northern Territory and the Australian CapitalTerritory. The results that follow are indicative of performance but some caution is needed given thesmall sample size and large variability of in costs around the averages. Key findings of the road project cost benchmarking component:average road project costs were around 5.1 million per lane kilometre in 2017.road class remains the most significant factor explaining average project costs—averagecosts of urban and rural freeways/highways were around 5.4 million per lane kilometre,while average costs of rural arterials were around 3.8 million per lane kilometre.average project costs also exhibited some variation across jurisdictions—two jurisdictionsexhibited above-average costs and two jurisdictions exhibited below-average constructioncosts across all road classes.most 2017 benchmarks are marginally lower than the 2015 equivalents. However, testingindicates that the 2017 benchmarks are not statistically different to the 2015 benchmarks. The small sample size makes benchmarks at the jurisdictional level uncertain. To increasethe sample size, BITRE have re-estimated benchmarks using the combined 2017 and 2015samples and presented the results in an appendix. Key findings of the procurement benchmarking component:time taken to complete procurement processes in the 2017 fell marginally relativeto 2015—the average total time to complete procurement in the 2017 sample was89 weeks, which is down on that of the 2015 sample (91 weeks).time taken within each procurement phase was similar across the 2017 and 2015samples—the median time taken to complete each procurement phase in the 2017sample projects, was broadly similar that of 2015 sample, with only a few areas ofdifference.where available, most procurement processes met agency target timeframes—jurisdictionsmet or bettered planned procurement timelines. However, planned procurementtimeframes were provided for only a small number of projects. BITRE recommends that the procurement and road construction cost benchmarking berepeated again in 2019. Increasing the detail jurisdictions provide on road construction costsmay allow governments to understand better the causes of variability. v
ContentsAt a glance.vIntroduction. 1Part R:Road construction cost benchmarks.3Road construction project data set.4Road construction cost performance.5Conclusions and recommendations. 21Appendix:R.A Austroads’ road classification.23R.B Benchmarks for the combined 2015 and 2017 data sets. 25Part I:Infrastructure procurement performance.33Procurement benchmarks. 33Procurement project data. 35Procurement performance. 37Conclusions and recommendations. 42References.43 vii
TablesTable R.1Road construction projects by road class and jurisdiction. 4Table R.2Road construction projects by procurement method. 4Table R.3Statistical summary of road construction projects costs and size. 5Table R.4Average per unit project cost by road class. 5Table R.5Average construction cost benchmarks, by component and road class. 7Table R.6Average project costs by jurisdiction and road class. 9Table R.7Standardised average project costs by jurisdiction and road class.10Table R.8Construction costs by road class and jurisdiction.13Table R.9Bridge costs by road class and jurisdiction.14Table R.10Pavement costs by road class and jurisdiction.15Table R.11Bulk earthworks costs by road class and jurisdiction.15Table R.12Average supplementary costs as a share of construction costsby road class and jurisdiction.16Table R.13Average utility costs as a share of construction costsby road class and jurisdiction.17Table R.14Project cost benchmarks, by road class for 2015 and 2017.18Table R.15Construction cost benchmarks, by component and road class for2015 and 2017.20Table R.A1Austroads’ functional road classification.23Table R.B1Number of projects in the combined 2017 and 2015 sample,by road class and jurisdiction.25Table R.B2Average per unit project costs, combined 2017 and 2015 sample,by road class and jurisdiction.26Table R.B3Average per unit project costs, combined 2017 and 2015 sample,by road class and jurisdiction.26 viii
Table R.B4Cost shares for class 1 roads, combined 2017 and 2015sample, by jurisdiction.27Table R.B5Cost shares for class 2 roads, combined 2017 and 2015sample, by jurisdiction.27Table R.B6Cost shares for class 3 roads, combined 2017 and 2015sample, by jurisdiction.28Table R.B7Cost shares for class 6 roads from the combined 2017and 2015 sample by jurisdiction.28Table R.B8Cost shares for Class 7 roads, combined 2017 and 2015sample, by jurisdiction.29Table R.B9Average per unit construction costs, combined 2017and 2015 sample, by road class and jurisdiction.29Table R.B10 Average per unit bridge costs, combined 2017 and 2015sample, by road class and jurisdiction.30Table R.B11Average per unit pavement costs, combined 2017 and2015 sample, by road class and jurisdiction.30Table R.B12Average per unit bulk earthworks costs, combined 2017and 2015 sample, by road class and jurisdiction.31Table I.1Timeliness benchmarks for procurement processes.34Table I.2Procurement projects by infrastructure class.35Table I.3Procurement projects by method of procurement.35Table I.4Statistical metrics of procurement benchmarks.37Table I.5Median procurement performance — 2015 and 2017.40Table I.6Median procurement performance by jurisdiction.41 ix
FiguresFigure R.1Statistical measures of per lane kilometre project cost by road class. 6Figure R.2Average cost shares by road class. 7Figure R.3Statistical measures of per lane kilometre construction costs by road class. 8Figure R.4Average cost shares by jurisdictiona for class 1 projects.11Figure R.5Average cost shares by jurisdictiona for class 2 projects.11Figure R.6Average cost shares by jurisdictiona for class 3 projects.12Figure R.7Average cost shares by jurisdictiona for class 6 projects.12Figure R.8Average cost shares by jurisdictiona for class 7 projects.13Figure R.9Statistical measures of project costs per lane kilometre, 2015 and 2017.19Figure I.1Statistical measures for procurement project costs.36Figure I.2Response rate for actual and planned timeliness benchmarks.36Figure I.3Percentage of procurement projects achieving planned benchmarks.38Figure I.4Procurement timeliness by contract types.38Figure I.5Procurement timeliness by infrastructure class.39 x
IntroductionIn 2015, Australian, state and territory governments cooperated to produce the first national pilotbenchmarking of infrastructure procurement processes and road construction costs (Transportand Infrastructure Council 2015). In addition to presenting benchmarks, the pilot study outlinedplans for continued and improved future monitoring. This report presents updated benchmarkresults derived from project cost and procurement performance data for projects completedsince January 2015.The Bureau of Infrastructure,Transport and Regional Economics (BITRE), undertook the analysisunder the direction of the Infrastructure Working Group Benchmarking sub-group (IWG subgroup). Jurisdictions provided data related to a selection of their infrastructure procurement androad construction projects. This report also benefits from state and territory agency advice onthe specifics of their projects.Consistent with the Productivity Commission’s recommendation and the 2015 pilot study,the benchmarks are strategic in nature (Productivity Commission 2014). Since the pilot studywas completed, BITRE and the IWG subgroup have reviewed the suitability of the cost andprocurement benchmarks.That review recommended removal of some superfluous benchmarkinformation and collection of more information regarding the causes of cost differences andprocurement delays.Given the distinct nature of infrastructure procurement and road construction cost benchmarks,this report has two parts. Part R presents the road construction cost benchmark results and PartI presents benchmark measures for infrastructure procurement processes. Each part describesthe selected benchmarks, the data provided by jurisdictions and results of the benchmarkingprocess. The 2017 sample benchmarks are compared with the 2015 sample benchmarks andvariability between projects is also explained. Part R also includes two appendices that providemore explanatory material. Appendix R.A presents the Austroads’ road class definitions andAppendix R.B presents benchmarks for the combined 2015 and 2017 data sets. 1
PART RRoad construction cost performanceRoad construction cost benchmarksThe road construction cost benchmarks presented in this report largely replicate those in the2015 pilot study (Transport and Infrastructure Council 2015).They also accord with similar UKGovernment indicators (for example, UK Government 2014).The whole-of-project benchmark is the cost per lane kilometre by road class. Additionally, thereport separately presents costs for project management, design and investigation, propertyacquisition and construction cost components. Client-supplied design costs were excluded fromconstruction costs. Contractor-supplied design costs were excluded from construction costsand included in design and investigation costs.Within the sample returns, road construction costs are disaggregated further into the followingcomponents: environmental works client-supplied materials and constructionservices traffic management and temporary works public utilities adjustments pavements traffic signage, signals and controls finishing works retaining walls bulk earthworks drainage supplementary items tunnels bridgesThis report benchmarks pavement, bridge and bulk earthworks costs together with public utilitiesadjustments and supplementary items as a share of construction costs.Some jurisdictions provided additional information on local climatic conditions and project terrainfor some projects as recommended in Transport and Infrastructure Council (2015).The study sample covers motorways, freeways and ar terial roads. There were no localroads included in the project sample. The relevant Austroads’ roads classes are rural roadclasses 1 to 3 and urban road classes 6 and 7. Appendix R.A provides Austroads’ definitions ofthese road classes. 3
BITRE Road Construction Cost and Infrastructure Procurement Benchmarking: 2017 updateRoad construction project data setFor the 2017 benchmarking update, seven jurisdictions provided data for a combined 32 projects.BITRE omitted two additional projects from the sample because one project return was incompleteand the other project was out of scope for this analysis.The majority of road projects were locatedin rural areas (classes 1 to 3). Around two-thirds of the projects involved major rural arterial roads(class 1) or urban freeways or motorways (class 6), see Table R.1.Table R.1Road construction projects by road class and jurisdictionRoad classJurisdictionab1234567AustraliaClass 1231410011Class 201010035Class 301300004Class 6101412110Class 700001102All classes355933432a.BITRE has randomly assigned responding jurisdictions a number between 1 and 7.b.Austroads’ road classes (see Appendix A for details).Source: BITRE based on data provided by jurisdictions.The 2017 project sample featured five different procurement methods. Sixteen project wereunder taken using construct-only contracts (see Table R.2), and a fur ther 12 projects wereundertaken under design and construct (D&C) contracts. Other procurement methods usedacross the sample projects included managing contractor contracts (1 project), early contractorinvolvement (1) and alliances (2). There were no Public–Private Partnership (PPP) projectsincluded in the 2017 cost benchmarking project sample.Table R.2Road construction projects by procurement methodContract typeNumber of projectsConstruct only16Design and construct12Managing contractor1Early contractor involvement1Alliance2PPP0Source: BITRE based on data provided by jurisdictions.Both project size (in terms of lane kilometres) and total project costs vary significantly acrossthe sample. (See Table R.3 for the average project size and cost together with other statisticalmeasures.) Half of the sample projects cost less than 53m and three-quarters cost less than 142m. A small number of very large projects, including one costing 928m, raise the meanproject cost to almost three-times the median. Similarly, for project size, the majority of projectsin the sample are relatively short. Three-quarters of projects are less than 47 lane kilometreswhereas the largest is 263 lane kilometres. 4
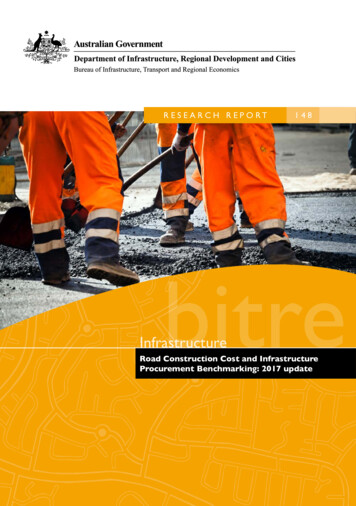
Part R Road construction cost performanceTable R.3Statistical summary of road construction projects costs and sizeStatistical measureProject costLane kilometres mkmMean15744Standard Deviation23657MinimumFirst quartileMedian9222105524Third quartile15847Maximum928263Source: BITRE based on data provided by jurisdictions.Road construction cost performanceNational outcomesPer lane kilometre average costsTable R.4 demonstrates that higher-grade roads have higher average per lane kilometre coststhan lower grade roads. At 5.4m per lane kilometre, the average cost of class 1 rural roads ismore than four times the average cost of class 3 rural roads. Similarly, the average cost of class6 urban roads is 0.5m per lane kilometre higher than the average costs of class 7 urban roads.Table R.4Average per unit project cost by road classCostClass 1Class 2Average total cost5.4(4.0)3.8(2.1)Standardised average cost a5.0(4.0)3.3(1.8)Class 3Class 6Class 71.0(1.2)6.8(8.2)6.3(4.3)0.9(1.1)6.2(7.4)6.0(4.1)( per lane kilometre)a.Average total cost less property acquisition and supplementary costs.Note:Standard deviations are presented in parentheses.Source: BITRE based on data provided by jurisdictions.While road class is an important determinant of road construction costs, the variability in costswithin each road class, seen in the standard deviations in Table R.4 and in Figure R.1, indicatesthat it is not the only factor.Median road costs are generally lower than average project costs meaning that a small numberof high cost projects are driving up the sample average. 5
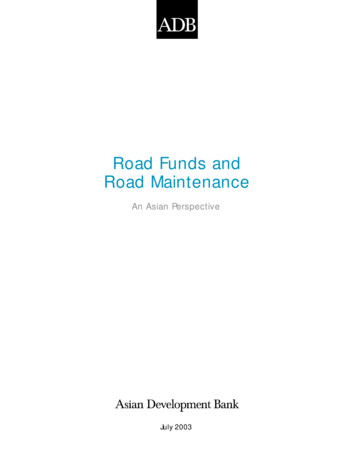
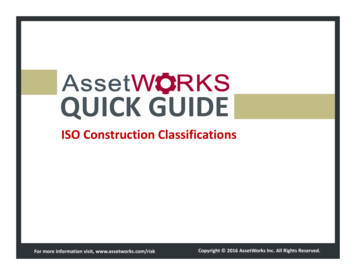
BITRE Road Construction Cost and Infrastructure Procurement Benchmarking: 2017 updateFigure R.1 Statistical measures of per lane kilometre project cost by road classAverage project cost ( million/lane kilometre)3020100Class 1Class 2Class 3Class 6Class 7Road classNote:The line represents the median of the data, the edges of the box the 1st and 3rd quartiles, the whiskers are furthestmost data point within 1.5 times the length of the box, the dots are outliers.Source: BITRE based on data provided by jurisdictions.Property acquisition costs may vary significantly between and within jurisdictions because ofvariability in land values. Excluding these costs, allows for the comparison of those costs that areless likely to vary across jurisdictions. Many projects do not incur any property acquisition costs.In the 2017 sample, 12 projects have no property acquisition costs. Four projects have propertyacquisition costs that comprise more than 10 per cent of costs and for one project they comprisemore than 20 per cent of total costs. Average property acquisition and supplementary item costsrange between 0.1m and 0.6m and between 5 and 15 per cent of total costs.Project cost breakdownThe project cost breakdown, shown in Figure R.2, separates construction costs from othercosts: project management, property acquisition and design and investigation.These data enablesjurisdictions to identify an average proportion of costs attributable to overheads. At a nationallevel, construction costs for class 3 rural roads comprise a significantly higher share of total coststhan all other road classes.This result may be a function of low land prices in rural Australia andless complex design requirements for these roads, relative to higher-standard roads. 6
Part R Road construction cost performanceFigure R.2 Average cost shares by road class100908070Per cent6050403020100Class 1Class 2Class 3Class 6Class 7Road classConstructionDesign and investigationProject managementProperty acquisitionSource: BITRE based on data provided by jurisdictions.Construction costs breakdownDifferences between road classes in construction costs and per unit pavement and bulkearthworks component costs follow a similar pattern to total project costs. As Table R.5 shows,class 1 road projects have the highest average component construction costs across all therural road classes and class 6 projects have higher costs than class 7 projects among urbanroad projects.Table R.5Average construction cost benchmarks, by component and road classCost BenchmarkUnitsClass 1Class 2Class 3Class 6Class 7 m/lane km4.6(3.6)3.1(1.7)0.9(1.1)5.3(6.4)5.1(3.9)Pavement /sq. m114(74)69(64)32(9)233(42)126(.)Bridge /sq. m6 444(3 588)6 106(4 975)4 177(.)5 531(1 972)naBulk earthworks /cu. m129(21)44(34)15(30)72(47)29(21)Utilitiesper ementary itemsper structionnaNot available – no projects in this category.Not applicable – only one project in this category.Note:Standard deviations appear in parentheses.Source: BITRE based on data provided by jurisdictions. 7
BITRE Road Construction Cost and Infrastructure Procurement Benchmarking: 2017 updateThe cost of bridge construction declines between road classes 1 and 3, potentially reflectingless complex construction. Within road class costs vary substantially. For example, the sampleincludes only two class 2 projects with bridges: one had unit bridge costs of 9634 per squaremetre and the other 2588 per square metre.The average costs of moving utilities differ from other components in that they represent a far highershare of urban road construction than of rural road construction, between 6.7 and 11.2 per centcompared with less than 2 per cent. The result arises from the need for additional services inurban environments.In contrast to utilities, the average costs of supplementary items comprise a far higher share ofconstruction costs for rural roads than urban roads: between 9 and 12.5 per cent across thethree rural road classes and less than 5 per cent for the two urban road classes. No obviousreason exists for this difference and the sample returns do not identify the nature of thesesupplementary costs.The variability within each of the components of construction costs is reflected in the variabilityof per lane kilometre construction costs, see Figure R.3.Figure R.3 Statistical measures of per lane kilometre construction costs by road classAverage project cost ( million/lane kilometre)2520151050Class 1Class 2Class 3Road classSource: BITRE based on data provided by jurisdictions. 8 Class 6Class 7
Part R Road construction cost performanceBenchmarks by jurisdictionSeven jurisdictions provided data for the 2017 update: New South Wales,Victoria, Queensland,South Australia, Western Australia, Northern Territory and the Australian Capital Territory. Eachjurisdiction was allocated a number between 1 and 7 (in no particular order) for reporting resultsin the remainder of this paper, to maintain confidentiality.Average per unit costsBeginning with the total costs shown in Table R.6, the data shows noticeable differences betweensome jurisdictions. In particular, average project costs in jurisdictions 1 and 4 are below theAustralian average across all road classes, whereas, jurisdictions 2 and 7 exhibit project costsabove the Australian average across all road classes.Table R.6Average project costs by jurisdiction and road classRoad classJurisdictiona1234567Australia( m per lane kilometre)Class Class 2na4.4(.)na0.3(.)nana4.8(1.0)3.8(2.1)Class 3na2.8(.)0.4(0.1)nananana1.0(1.2)Class .2)Class 7nananana9.3(.)3.3(.)na6.3(4.3)naNot applicable – no projects in this category.Not available – only one project in this category.a.BITRE has randomly assigned responding jurisdictions a number between 1 and 7.Note:Standard deviations appear in parentneses.Source: BITRE based on data provided by jurisdictions.Omitting property acquisition costs and supplementary items changes the relative performanceof jurisdictions only marginally (see Table R.7). The major exception being the one class 6 roadlocated in jurisdiction 7. Its property acquisition costs are sufficiently high that total costs arewell above the Australian average, but after excluding property acquisition costs, its cost arearound the Australian average.Interpreting the results by jurisdiction requires some caution because sample sizes are small.Jurisdictions may benefit from comparing the results presented here with other road constructionprojects they have recently undertaken. 9
BITRE Road Construction Cost and Infrastructure Procurement Benchmarking: 2017 updateTable R.7Standardised average project costs by jurisdiction and road classRoad classJurisdictionb123Class 11.8(0.7)9.4(2.7)9.8(.)Class 2na4.3(.)Class 3naClass 6Class anana8.9(.)3.1(.)na6.0(4.1) m per lane kilometrenaNot available - no projects in this category.Not applicable – only one project in this category.a.Average project costs excluding property acquisition and supplementary items.b.BITRE has randomly assigned responding jurisdictions a number between 1 and 7.Note:Standard deviations appear in parentheses.So
Road construction cost performance Road construction cost benchmarks The road construction cost benchmarks presented in this report largely replicate those in the 2015 pilot study (Transport and Infrastructure Council 201 5). They also accord with similar UK