Transcription
15.3PRESSURE MEASUREMENTS AT THE GROUND IN AN F-4 TORNADOJulian J. Lee* and Timothy M. SamarasApplied Research Associates Inc., Littleton, ColoradoCarl R. YoungDesert Research Institute / University of Nevada, Reno, Nevada1.INTRODUCTIONDirect measurements of flow properties insidetornadoes have been accomplished in the pastthrough remote Doppler radar instruments,fortuitous passages of tornadoes over stationarymeteorological stations, and relatively raredeployments of specialized in-situ instrumentation.In addition to the transient and unpredictablenature of tornado occurrences, measurementsusing in-situ instruments are complicated by thechallenge of placing instruments in the tornadopath, not to mention survival and proper operationof the instruments in the harsh tornadicenvironment.Many attempts to deploy in-situ instrumentshave been made with varying degrees of success(Samaras 2004). A few deployments are notablefor the measurements made in close proximity tothe tornado core. The instrumented probe calledTOTO was deployed near an F-2 tornado,recording a maximum pressure drop of 5 mb(Bluestein and Golden 1993). A more compactprobe was deployed 1.6 km from a tornado nearMooreland, OK, recording a peak pressure drop of4 mb (Bluestein and Golden 1993).Severalinstrumented probes were deployed near an F-4tornado west of Allison, TX, on June 8th, 1995, withthe tornado axis passing within 660 m of one ofthe probes producing a peak pressure drop of55 mb (Winn et. al. 1999). An aerodynamicallyshaped instrumented probe called the HITPR(Hardened In-situ Tornado Pressure Recorder)was deployed near an F-3 tornado close to Pratt,KS on May 7th, 2002 recording a pressure drop of24 mb (Samaras and Lee 2003). The HITPRfeatures a very low-profile shape resulting in highstability in tornadic winds.*Corresponding author address: Julian J. Lee, AppliedResearch Associates Inc., 10720 Bradford Rd. Suite110, Littleton, CO 80127; e-mail: jlee@ara.comThe HITPR was subsequently deployed insidethe core of an F-0 tornado near Stratford, TX onMay 15th, 2003, recording a peak pressure drop ofabout 40 mb. This tornado was being scannedremotely by Doppler radar instruments as thetornado passed over the probe, and a comparisonof the remote and in-situ results is reported byWurman and Samaras (2004).In-situmeasurements are unquestionably extremelydifficult to obtain, however they provide valuableinsight into the morphology and flow dynamicswithin tornadoes.In this paper, the results of a HITPRdeployment in a tornado that passed throughManchester, SD, on June 24th, 2003 are reported.The synoptic and mesoscale conditions favorableto the tornado outbreak are described. The vortexflow features are then discussed throughcomparisons with analytical and laboratorysimulated models.2.INSTRUMENTATIONThe HITPR probe used for the Manchestertornado measurements consists of a conical steelshell about 51 cm in diameter and 15 cm highcontaining instrumentation to measure pressure,temperature, humidity, and wind speed (Figure 1).The device also contains a data logger to recordup to 2 hours of data onto a flash card. It iscompletely autonomous and weighs about 23 kg,facilitating rapid deployment in remote locations.The flow and atmospheric properties of the air onthe surface of the device are recorded at a rate of10 samples/second (10 Hz) through radiallylocated holes that communicate to the diagnosticgauges inside the shell. Details on the design andoperation of the HITPR are given in Samaras andLee 2003.
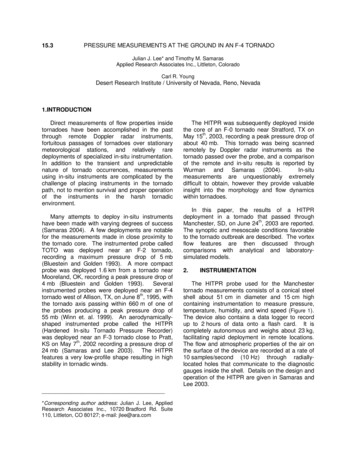
Figure 1. Picture of HITPR. Holes connecting to thediagnostic gauges inside the device are visible.In order to survive the harsh environmentinside a tornado, the HITPR shape was designedto have minimal aerodynamic forces in high winds.Thanks to its low profile, lift forces are small, andthe probe can operate in winds up to 80 m/s.3.ENVIRONMENTAL CONDITIONSOn the morning of June 24, 2003, the synopticpattern was conducive for a severe weatherepisode with supercells and tornadoes probableacross the Northern Plains. High dewpoints and adeep moisture field, strong upper and mid levelwinds ahead of a progressive trough, convergencealong a retreating warm front and outflowboundaries, and deep layer shear associated withbacked surface flow and a veered wind profileoperated in concert to provide the necessaryingredients for a significant tornadic outbreak.Favorable storm motion in the proximity of thefrontal boundary and a cell merger helped producethe most violent tornado of the outbreak inManchester, SD.Figure 2. RUC upper air analysis shows the 1200 UTC24 June 2003 500 mb heights (dm) and isotachs (in-1knots; 1 m s equals .5144 knots). The dashed linesindicate the locations of short wave troughs and thesawtooth line denotes the shortwave ridge. [From UCAR2003]An analysis of the 1200 UTC (0700 centralstandard time) upper level charts on 24 June2003, the 250 mb chart (not shown) indicated astrong trough centered over the Great Basin with ajet streak of 50 m s-1 winds rounding its base.Thistroughwasproggedtoprogressnortheastward during the day while ejecting upperand mid level jets into the Central and NorthernPlains. Downstream of the progressive trough, a500 mb short wave trough was migratingnortheastward across central Minnesota and wasassociated with an ongoing elevated convectivecomplex of storms across portions of the easternDakotas into the Great Lakes (Fig. 2). Numerousoutflow boundaries were being produced and anextensive canopy of cirrus covered the region.The other midtropospheric short wave trough wasmoving northeastward across the Central Rockiesand was expected to nose into the Northern Plainsby late afternoon resulting in diffluent flow aloft,advection of steep lapse rates, and surfacepressure falls ahead of the trough.At 850 mb (not shown), a reasonably stronglow level jet (LLJ) (southerly to southwesterly at10-18 m s-1) was advecting Gulf of Mexicomoisture into the Northern Plains providing mixingratios of 12-16 g kg-1 through eastern Nebraska.In response to pressure falls ahead of theapproaching mid/upper level trough, the LLJ wasexpected to increase during the evening withsoutherly wind speeds of 20-25 m s-1 forecastacross eastern NE, southeast SD, northwest IA,and southwest MN.
Figure 3. Surface analysis from 1200 UTC 24 June 2003 shows isobars (thin gray lines, contoured at 4 mb intervals)and location of frontal boundaries in Northern Plains. The frontal symbols are conventional with the dashed linedenoting the stationary outflow boundary. The station plots display temperature and dewpoint readings in Celsius,sea level pressure (mb), 3-h pressure tendency, and winds in knots ( 1 m s-1 equals .5144 knots). [Analysis createdusing Weathergraphics Digital Atmosphere 2004]At the surface at 1200 UTC (Fig. 3), aquasistationary frontal boundary extended fromcentral MN southwestward through extremesoutheast SD and southwest NE to a low pressurecenter in eastern CO, resulting in a southeasterlywind flow of 2-5 m s-1 across most of eastern NE.Due to reinforcement from the ongoing convectionand a weak cross frontal wind field, the front wouldbe expected to drift slowly southeastward beforeretreating as a warm front with increasing surfacewinds advecting a warm, moist air massthroughout the day. Although, eastern SD was inthe cold sector, relatively moist conditions werealready in place with Sioux Falls (FSD), Mitchell(MHE), and Watertown (ATY) all reportingdewpoints of 18 C. Pooled to the south of astationary outflow boundary stretching fromeastern NE into central IA, the most unstable airmass with surface dewpoints of 21-24 C waslocated in southeast NE.
Figure 4. Visible satellite image from 1215 UTC 24 June 2003 exhibits an extensive cirrus canopy over the easternDakotas and MN from the convective complex associated with the shortwave moving through the region. Locationsof the quasistationary front and stationary outflow boundary are denoted. [From UCAR 2003]Visible satellite imagery at 1215 UTC (Fig. 3)depicted mostly clear skies south of the synopticfront with stratus and stable wave-like “billow”clouds along and just to the north of the boundary.A cluster of storms and anvil debris covered theeastern third of SD into MN. In the wake of thedeparting short wave trough, a band of clear skiesstretched northward along the Missouri River inSD demarcating warmer temperatures from 18-21 C to the east, from cooler 11-17 C temperaturesin the western portion of the state. With sufficientdiurnal heating, the stratus cloud coverimmediately to the north of the front was expectedto dissipate and allow for further retreat of thewarm front and outflow boundaries with persistentadvection of the warm, moist air mass from thesouth.With the southerly and southwesterly moistsurface flow increasing to 8 to 10 m s-1, thestationary front had begun retreating as a warmfront by 1800 UTC (not shown). The warm frontwas situated from near Yankton (YKN), SDwestward along the border of SD and NE to theMissouri River and southwestward to the lowpressure center now over southwest NE. A coldfront extended south of the low and low pressurewas continuing to develop northeastward along
this baroclinic boundary.Figure 5. Skew-T/log-P sounding and hodograph from 1700 UTC 24 June 2003 shows the temperature (redline)/dewpoint (green line) and wind profile from the Aberdeen (ABR) site. Temperature and dewpoint are recorded inCelsius and winds in knots. [From UCAR 2003]An evaluation of the 1700-1800 UTCsoundings from Aberdeen (ABR) and Omaha(OAX) revealed the character of the air massesnorth and south of the boundary. The 1700 UTCsounding from ABR (Fig. 5) showed a relativelydeep moist layer from the surface to 850 mb with asurface dewpoint of 17 C and a mean levelmixing ratio of 11.8 g kg-1 at that time. Layers ofsubsidence warming evident from 450 to 850 mbcontributed to a relatively strong cap and a surfacebased CAPE (SBCAPE) value of only 166 J Kg-1was realized. Without significant boundary layermoistening, only elevated convection wasexpected.The hodograph exhibited clockwisecurvature in the lowest 1-km, a storm relativeenvironmental helicity (SREH) of 191 m2 s-2, andsouthwesterly flow of 24.2 m s-1 at 500 mb.Midlevel winds of this magnitude were importantfor storm-scale rotation as suggested by Klempand Rotunno (1983) and Davies-Jones andBrooks (1993). Rasmussen and Blanchard (1998)and Ramussen (2003) found that storm relativehelicity in the 0-1-km boundary layer was animportant parameter for distinguishing between
tornadic and nontornadic supercells.In comparison, the 1800 UTC sounding fromOAX (not shown) displayed a more uniform deepmoisture layer extending from the surface to 850mb with a surface dewpoint of 24 C and meanlevel mixing ratio of 18.0 g kg-1. With these verymoist conditions, instability parameters showedvery strong instability with a SBCAPE value of3277 J Kg-1, lifted index (LI) of -7.7, andconvective inhibition (CIN) of only -8.6 J Kg-1 .The wind shear profile showed moderate veeringof the winds in the lowest 1-km of the atmosphereand the midlevel flow of 19.6 m s-1 was sufficientfor supercells. With the advection of the warm,moist air mass pooling to the south of the synopticboundary and destabilization ahead of theupper/mid level trough entering the NorthernPlains, instability in this magnitude was expectedto spread northward through southeast SD byevening. Coupled with the high instability, aneasterly component to the surface winds along thewarm front and outflow boundaries and anincrease in the LLJ, the low level shear would besupportive of tornadoes.Figure 6. Visible satellite image from 1815 UTC 24 June 2003 shows an enhanced area of cumulus development atthe intersection of the warm front and outflow boundary in SD. An extensive field of cumulus and stratocumulus islocated south of the front. [From UCAR 2003].
3.1MesoanalysisAt 1815 UTC (Fig. 6), satellite imagery showedcumulus and stratocumulus developing in thewarm sector. At the point of intersection of anWSW-ENE aligned outflow boundary now evidentnear the Missouri River in SD and the warm frontalong the NE/SD border, bright enhanced cumuluswas developing.In between these twoboundaries, mixing in the boundary layer andevapotranspiration effects resulted in dewpointsclimbing to 19 C in FSD and MHE.The most significant 3-hour pressure changeswere located to the east of the Missouri River insoutheast SD with Huron (HON) and Pierre (PIR)reporting -1.8 mb and MHE and Brookings (BKX)reporting -2.4 mb. These pressure falls wereconsistent with the passage of the retreatingoutflow boundary northwestward and themovement of the upper and mid level jets into thewestern periphery of the region.Figure 7. Visible satellite image from 2115 UTC 24 June 2003 shows the convection, with developing anvil north ofPickstown, forming along the warm front/retreating outflow boundary. [From UCAR 2003]Satellite imagery at 2115 UTC (Fig. 7) showeda well-developed cumulus field south of theaforementioned outflow boundary which wasevolving into the warm front. Along the moistureaxis, towering cumuli were forming in eastern NEand near Pickstown, SD. The convection near
Pickstown quickly intensified into a supercell. Thissupercell moved north-northeast into the Mt.Vernon area producing two tornadoes between2212-2235 UTC in association with the cyclicdescent of the echo tops. Shortly thereafter, thesupercell quickly lost strength. Fujita (1973),Lemon and Burgess (1976), and Burgess et al.(1977)documentedtornadogenesisatapproximately the same time as the collapse ofovershooting tops. The descending echo topswere related to weakening updrafts.At 2245 UTC (not shown), while the Mt. Vernonsupercell was dissipating, a new convective towerdeveloped to the northwest of MHE along thewarm front. As the storm tracked northeastwardalong the boundary, it experienced anenhancement of convergence and the streamwisecomponent of horizontal vorticity. Rasmussen etal (1998) found that outflow boundaries were richin horizontal vorticity and were important for F2 tornadoes. Markowski et al. (1998) found thatduring VORTEX almost 70% of significanttornadoes were associated with low-levelboundaries. Satellite imagery showed the stormwas isolated with clear skies to the westpreventing detrimental anvil seeding, which wasimportant for supercell maintenance as suggestedby Rasmussen and Straka (1998). In addition,mostly clear skies to the south and southeastallowed for additional insulation and the unabatedingestion of the moist air mass.By 2302 UTC, the storm rapidly matured to asupercell in the favorable unstable and highlysheared environment. The storm developed astrong, relatively precipitation-free rear flankdowndraft (RFD) as evidenced by observation ofthe clear slot (Fig. 8). The visual signature of themesocyclone being occluded by the RFD wasshortly followed by a F3 tornado to the west ofWoonsocket between 2316-2336 UTC (Fig. 9).Lemon and Doswell (1979), Rasmussen et al(1982), and Jensen et al (1983) observed clearslots prior to and during tornadogenesis. RFDinteractions with the parent supercell wereimportant for tornadogenesis in previous researchas suggested by Ludlam (1963), Fujita (1975),Burgess et al (1977), Barnes (1978), Lemon andDoswell (1979), Brandes (1981), and DaviesJones (1982a,b).Figure 9. At 2332 UTC 24 June 2003, the Woonsockettornado is losing its vertical alignment and begins todissipate. [Video capture by Carl R. Young]Figure 8. At 2322 UTC 24 June 2003, as the HITPRresearch team is heading east on Hwy. 34 towardsWoonsocket, the RFD occluding the mesocyclone isevidenced by visible observations of the clear slot.Although tornado's condensation funnel does not extendto surface, debris on the ground is observed. [Videocapture by Carl R. Young].As the parent supercell of the Woonsockettornado (hereafter referred to as the Woonsocketsupercell)moved northeastward into BeadleCounty, it began to merge at 2347 UTC with asmaller organizing supercell moving northwardfrom Sanborn County.Ray et al. (1976)documented vigorous intensification and eventualtornado production after a cell merger. During thecell merger process, the larger Woonsocketsupercell absorbed the smaller cell and a newupdraft formed in this location.Hence, theWoonsocket supercell's original mesocyclonecollapsed only to reform slightly further to the east.According to Westcott (1984), a cell mergerresulted in updraft intensification by reducing dryair entrainment, increasing surface convergence,and enhancing of instability by modification of the
storm-scale thermodynamic environment. As thenew mesocyclone matured and intensified, therewere a few brief and intermittent tornadotouchdowns occurring around 2359 UTC andanother at 0014 UTC 25 June 2003.Figure 10. Surface analysis at 0000 UTC 25 June 2003 denotes frontal positions, isobars (contoured every 2 mb),and station data as Fig. 3. Select counties (Sanborn, Beadle, and Kingsbury) are labeled in the upper left-handcorner of county outlines. Select cities (Woonsocket and Manchester) are labeled in green. Active outflow boundaryproduced by convective activity in southeast SD is indicated by the dashed line. [Analysis created usingWeathergraphics Digital Atmosphere 2004]By 0000 UTC 25 June 2003, a quasistationaryfrontal boundary was in close proximity to HONand Manchester (Fig. 10).Low pressure ofapproximately 1002 mb had developed along thisbaroclinic zone and was contributing to backedsurface wind flow across southeast SD therebyenhancing low level storm relative helicity.Meanwhile, extensive convection in southeast SDproduced and continued to reinforce an outflowboundary propagating northwestward, but was notexpected to reach the HON and Manchester areafor several hours.With MHE reporting atemperature/dewpoint reading of 32/24 C, theWoonsocket supercell was continuing to ingest awarm, moist inflow into its updraft.
Figure 11. RUC upper air analysis 4-panel display from 0000 UTC 25 June 2003 shows the 250, 500, 700, and 850mb heights (dm) and isotachs (wind speeds in knots and color-coded based upon scale at bottom of each diagram).[From UCAR 2003]In addition, the wind profile was exhibiting goodspeed and directional shear favorable fortornadoes near HON and Manchester. Evaluatinggridded 20-km Rapid Update Cycle (RUC20)numerical output analysis (Fig. 11), the 250 mb jetwas positioned west of the Missouri Riverproviding of 40-45 m s-1 southwesterly winds overthe HON area. In phase with the upper level flow,the 500 mb southwesterly flow of 23-25 m s-1 wasalso co-located over the same region. Continueddirectional shear was exhibited at 700 mb withsoutherly winds of 20-22 m s-1. As a result of astrengthening LLJ, the south-southeasterly 850mb winds were 12-13 m s-1. In the vicinity of thequasistationary front, winds were backed withsoutheasterly to easterly winds at 5-8 m s-1. Thisdeep layer shear contributed to 0-1-km stormrelative helicity (SRH) values of 210-230 m2 s-2and 0-3-km SRH of 360-390 m2 s-2 along thequasistationary frontal boundary near HON andManchester at 0000 UTC. The mean 0-3-km SRHfor tornado producing supercells was 180 m2 s-2with a 90th percentile of 411 m2 s-2 according toRasmussen and Blanchard (1998).The Woonsocket supercell's new mesocyclonecontinued to intensify, especially at low levels, withlarge wall cloud circulation evident at its base at0020 UTC. A few minutes later, a brief F0 tornadotoucheddownjustnorthofEsmond(approximately 15 km SWW of Manchester) andthen reformed shortly thereafter with broadercirculation at the surface. By 0029 UTC, thesupercell displayed a bounded weak echo region(BWER) signature on Doppler radar (not shown)and the tornado had begun to expand rapidly toover one half-km wide at its base moving northnorthwestward. At approximately 0043 UTC, thelarge wedge tornado made a more northwardmigration into the town of Manchester causing F4damage (as concluded by Sioux Falls NationalWeather Service surveys following the event) andthen contracted into an elephant trunk shape (Fig.12). In the Manchester tornado's final dissipationstage, it morphed into a translucent rope structureat 0053 UTC (Fig. 13).
Figure 12. At 0050 UTC 25 June 2003, after moving northward out of Manchester, the tornado exhibits an elephanttrunk structure. [Video capture by Carl R. Young]
Figure 13. At 0053 UTC 25 June 2003, the Manchester tornado exhibits a rope-like shape before the condensationfunnel disappears. Debris circulation on the ground is observed for several minutes later. [Video capture by Carl R.Young]Without any soundings in very close proximityto Manchester at that time (ABR wasapproximately 140 km away and north of the warmfront at 0000 UTC) estimates were made of themesoscale environment in place at the time ofManchester tornado. Although the 0000 UTCABR sounding did satisfy the "proximity" soundingdefinition proposed by Brooks et al. (1999) in thatthe tornado occurred less than 160 km away andwithin one hour of the sounding, the disparity inmoisture and temperature variables and winds atthe surface between the two different localesresulted in the 0000 UTC ABR sounding not . Thompson et al. (2003) found thatproximity soundings from the 40-km RUC-2forecast and analysis system were reasonablyaccurate in comparison to observed soundings insupercellenvironmentsandvariousthermodynamic and wind shear parametersderived from these RUC-2 proximity soundingswere useful in discriminating between significantlytornadic (F2 ), weakly tornadic (F0 to F1), andnontornadic supercells. Although the 40-km RUC2 was replaced by the 20-km RUC20, preliminaryoperational research by the Storm PredictionCenter forecasters showed the research findingswere still applicable. By using the RUC20 gridded1-h forecasts (not shown) prepared at 0000 UTC25 June, a variety of numerically modeledthermodynamic and wind shear parameters in theManchester area were compared with thespectrum of values for significantly tornadicsupercells from the Thompson et al. (2003)research. Mean level LCL (MLLCL) and 0-1 kmSRH were found to be the most cantly tornadic and nontornadic supercells.The Estimates for and mean level LCL (MLLCL)was 800 m and 0-1-km SRH was 240 m2 s-2 inManchester between 0000 and 0100 UTC. Thesevalues were in the upper percentiles of favorableconditions for significant tornadoes (upper 20-25% for both 0-1-km SRH and MLLCL).Theestimate for mean 0-3-km SRH was 380 m2 s-2which was close to the 90th percentile of 396 m2 s2.Meanwhile, an estimate of 3600 J Kg-1
MLCAPE was also close to the 90th percentile of3683 J Kg-1. LCL's less than 800 m AGL werefound to be excellent discriminator betweentornado-producing supercells and nontornadicsupercells (generally above 1200 m) according toRasmussen and Blanchard (1998).Thus,conditions as estimated by the RUC20 werefavorable for F2 tornadoes and as many of theseparameters were in the upper percentiles, themesoscale environment was supportive of theviolent Manchester tornado4.DEPLOYMENT OF INSTRUMENTSThree HITPR probes were deployed nearManchester by a chase vehicle containing all theprobes. The vehicle was driven by T. Samarasand two accompanying vehicles completed thedeployment team. To place the probes in theprojected tornado path, the tornado movementwas monitored continuously as a rapid itinerarychoices were made to position the chase vehicle asafe distance in front of the tornado. The resultingtrajectory is shown in Figure 14. Manchester wasapproached from the west on Highway 14. 425thAvenue was then taken in the north direction asthe tornado approached from the south. A firstprobe (probe 3) was deployed about 3.21 km northof Manchester, on 206th Street, just east of 425thAvenue. A second (probe 5) and third probe(probe 6) were deployed as chase team movednorthward along 425th Avenue. The deploymentteam then observed the progression of the tornadofrom north viewing point.
Figure 14. Map showing key locations during deployment of HITPR probes (Delorme 2003).
The deployment team first witnessed thepassage of the tornado through the town ofManchester. The tornado then proceeded to passdirectly over probe 3 (Figure 15).Figure 15. Tornado at 00:45:42 UTC, 70 seconds beforepassing over probe 3.The tornado continued slightly northeast, awayfrom 425th Avenue, but then returned west to passThe tornado thenover probe 5 (Figure 16).continued northwest passing more than 100 mwest of probe 6, and dissipated. The entire pathof the tornado is shown in Figure 17.Figure 16. Tornado at 00:50:17 UTC, 15 seconds afterpassing over probe 5.Figure 17. Path of the Manchester tornado looking north of town. The debris path is indicated with a purple line.(Courtesy of NWS, Sioux Falls, S.D.)
RESULTSThe present analysis will only discuss themeasurements obtained from probe 3.Themeasurements from probe 5 and probe 6 are leftfor a future discussion. Probe 3 was activated at00:45:32 UTC, and recorded data for 33 minutesand 8 seconds.5.1Temperature and HumidityThe temperature was observed to steadilydecrease, as the tornado passed over the probebetween 70-110 seconds from probe activation(Figure 18). Because the probe was stored insidethe chase vehicle prior to being deployed, theinitial temperature reflected the vehicle cabintemperature. After deployment, the temperaturegauge gradually reached equilibrium with outsideair temperature as the wind caused air to passthrough probe ports. The equilibration time of thetemperature gauge is not known. This timedepends mainly on the wind speed as well as thedifference in temperature between the air outsideand inside the chase vehicle. Higher wind speedsare expected to shorten the equilibration time,leading to a faster response time for the gaugeand more accurate temperature readings.shown in Figure 19.The tornado passageoccurred approximately 70-110 seconds fromprobe activation. The humidity gauge may besubject to the same equilibration time uncertaintiesas the temperature gauge.120100Humidity (% )5.8060402000100200300400500Time (sec)Figure 19. Humidity history from probe measurementsstarting at 00:45:32 UTC.In the present analysis, the temperature andhumidity measurements were used to calculatethe initial air density and water vapor content.5.2Pressure History32.532Temperature mprobeTime (sec)Figure 18.Temperature historymeasurements starting at 00:45:32 UTC.The humidity history measured by the probe isThe pressure history recorded by the probe isshown in Figure 21. The general macroscopicbehavior of the pressure decreased as the tornadoapproached. The passage of the tornado coreover the probe was characterized by a decrease inpressure starting at about 30 seconds, droppingmore sharply at about 75 seconds, and reaching aminimum value of 850 mb at 84 seconds. Thiswas a 100 mb drop from the initial pressure of950 mb. The pressure then rapidly increasedback up to the initial pressure in a similar fashion,forming a roughly symmetrical “V”-shapedpressure drop.Because the tornado had atranslational motion, the flow field is describedfrom a frame of reference moving with the tornado.The region in front of the tornado is referred to asupstream, and the region behind the tornado isreferred to as downstream.
upstream960downstreamPressure (mbar)940920900Finally, calculations of the condensation funneldiameter were also found to support the passageof the tornado axis over the probe. The funneldiameter was estimated by assuming an adiabaticcooling process as the moist air outside thetornado was drawn into the core: P T T0 0 P 8801 γγ(1)8608401060110Time (sec)160Figure 21. Pressure history from probe measurementsstarting at 00:45:32 UTC.The translational speed was estimated usingthe time of travel between probe 3 and probe 5,and the distance between the probes. The timeinterval was determined using a continuous videorecording of the entire deployment. Since thetornado did not travel in a straight line, thedistance between the probes was estimated frommaps of the area and aerial photographs of thetornado path. The translational speed was thusfound to be 9.3 m/s between probe 3 and probe 5.5.3Probe Position Relative to Tornado AxisGiven the strong radial pressure gradient in thecore region of the tornado, it is important todetermine the position of the probe relative thetornado axis. A first estimate was made byinspecting the video recordings of the passage ofthe tornado over the probe. The position of theprobe was identified on the video images usingreference markers such as the road. In the videorecording, the tornado appeared exactly centeredover the probe position.Further evidence of the central location of theprobe relative to the tornado path was found inpost-deployment measurements of the distanceperpendicular to the tornado translation from theprobe to the edge of the debris path. The probewas found to be equidistant from both edges of thedebris path within an uncertainty of 6 m.where T0 and P0 are the air temperature andpressure outside the tornado and γ is the ratio ofspecific heats. As the pressure decreases withdecreasing radial distance from the tornado axis,so too does the vapor pressure of water as givenby the Antoine equation: B log 10 Pσ A T C (2)where Pσ is the vapor pressure in bar, T is thetemperature in Kelvin, and A, B, C are constantsequal to 5.40221, 1838.675, and –31.737respectively for the range of temperature from273-303 K. The dynamic humidity is given as theratio of the partial pressure of water in the air tothe vapor pressure.As the pressure andtemperature decreased towards the tornado axis,the dynamic humidity increased. The dynamichumidity is shown as a function of the distancetraveled by the tornado (Figure 22). This distancew
The HITPR was subsequently deployed inside the core of an F-0 tornado near Stratford, TX on May 15th, 2003, recording a peak pressure drop of about 40 mb. This tornado was being scanned remotely by Doppler radar instruments as the tornado passed over the probe, and a co