Transcription
Salt Lake and Utah CountySubcounty Estimates,2010-2019Natalie Young, B.S., Research AnalystEmily Harris, M.S., Demographic AnalystPamela S. Perlich, Ph.D., Director of Demographic ResearchApril 2020
Table of ContentsAnalysis in Brief . . . . . . . . . . . . . . . . . . . . . . . . . . . . . . . . . . . . . . . 1Background. . . . . . . . . . . . . . . . . . . . . . . . . . . . . . . . . . . . . . . . . . . 2Results. . . . . . . . . . . . . . . . . . . . . . . . . . . . . . . . . . . . . . . . . . . . . . . . 2Total Population: Counties . . . . . . . . . . . . . . . . . . . . . . . . . . . . . . 2Total Population: Cities. . . . . . . . . . . . . . . . . . . . . . . . . . . . . . . . . . 2Total Population: Tracts . . . . . . . . . . . . . . . . . . . . . . . . . . . . . . . . . 4Housing Units by Tenure. . . . . . . . . . . . . . . . . . . . . . . . . . . . . . . . 5Data, Methodology, and Comparative Estimates. . . . . . . . . 5Building Permit Data and Geocoding. . . . . . . . . . . . . . . . . . . . 5Methodology and Assumptions. . . . . . . . . . . . . . . . . . . . . . . . . 6Additional Information: Controlling to UPCCounty-Level Estimates. . . . . . . . . . . . . . . . . . . . . . . . . . . . . . . 7Comparison to Alternative Estimates. . . . . . . . . . . . . . . . . . . . 8Conclusion. . . . . . . . . . . . . . . . . . . . . . . . . . . . . . . . . . . . . . . . . . . . 9FiguresFigure 1: Top 10 Population Growth with Percent Change,2018-2019 Salt Lake County and Utah County Cities . . . 3Figure 2: Top 10 Population Growth with PercentChange, 2018-2019, Salt Lake County and UtahCounty Census . . . . . . . . . . . . . . . . . . . . . . . . . . . . . . . . . . . . . . . 4Figure 3: Salt Lake and Utah County City Estimates,Total Population 2019. . . . . . . . . . . . . . . . . . . . . . . . . . . . . . . . 12Figure 4: Salt Lake and Utah County City Estimates,Total Population Change 2018-2019. . . . . . . . . . . . . . . . . . 13Figure 5: Salt Lake and Utah County City Estimates,Rate of Population Change 2018-2019. . . . . . . . . . . . . . . . 14Figure 6: Salt Lake County Tract Estimates,Total Population 2019. . . . . . . . . . . . . . . . . . . . . . . . . . . . . . . . 16Figure 7: Salt Lake County Tract Estimates,Total Population Change 2018-2019. . . . . . . . . . . . . . . . . . 17Figure 8: Salt Lake County Tract Estimates,Rate of Population Change 2018-2019. . . . . . . . . . . . . . . . 18Figure 9: Utah County Tract Estimates,Total Population 2019. . . . . . . . . . . . . . . . . . . . . . . . . . . . . . . . 19Figure 10: Utah County Tract Estimates,Total Population Change 2018-2019. . . . . . . . . . . . . . . . . . 20Figure 11: Utah County Tract Estimates, Rate ofPopulation Change 2018-2019. . . . . . . . . . . . . . . . . . . . . . . 21Figure 12: Salt Lake County Census Tract andPlace Reference Map. . . . . . . . . . . . . . . . . . . . . . . . . . . . . . . . .Figure 13: Utah County Census Tract andPlace Reference Map 1. . . . . . . . . . . . . . . . . . . . . . . . . . . . . . .Figure 14: Utah County Census Tract and PlaceReference Map 2: Provo/Orem Detail andCounty Overview. . . . . . . . . . . . . . . . . . . . . . . . . . . . . . . . . . . .Figure 15: Annual Salt Lake County Total Population:Comparison of Census and UPC Estimates. . . . . . . . . . . .Figure 16: Salt Lake County Total Population Changes:Comparison of Census and UPC Estimates. . . . . . . . . . . .Figure 17: Annual Utah County Total Population:Comparison of Census and UPC Estimates. . . . . . . . . . . .Figure 18: Utah County Total Population Changes:Comparison of Census and UPC Estimates. . . . . . . . . . . .22232425252525TablesTable 1: Top 10 Population Growth, 2018-2019Salt Lake County and Utah County Cities . . . . . . . . . . . . . . 3Table 2: Top 10 Population Growth, 2018-2019,Salt Lake County and Utah County Census Tracts . . . . . . 4Table 3: Salt Lake County Estimates for SelectedVariables. . . . . . . . . . . . . . . . . . . . . . . . . . . . . . . . . . . . . . . . . . . . 10Table 4: Salt Lake County Estimates for SelectedVariables, Annual Changes. . . . . . . . . . . . . . . . . . . . . . . . . . . 10Table 5: Utah County Estimates for Selected Variables. . . 11Table 6: Utah County Estimates for Selected Variables,Annual Changes. . . . . . . . . . . . . . . . . . . . . . . . . . . . . . . . . . . . . 11Table 7: Total Population and Change in Salt LakeCounty Cities, 2018-2019 . . . . . . . . . . . . . . . . . . . . . . . . . . . . 15Table 8: Total Population and Change in UtahCounty Cities, 2018-2019 . . . . . . . . . . . . . . . . . . . . . . . . . . . . 15Table 9: Total Population and Change in SaltLake County Census Tracts, 2018-2019 . . . . . . . . . . . . . . . 26Table 10: Total Population and Change in Utah CountyCensus Tracts, 2018-2019 . . . . . . . . . . . . . . . . . . . . . . . . . . . . 28With thanks to Savannah Mailloux, GIS Intern, and Eric Albers, Graduate Assistant, for their data development contributions.
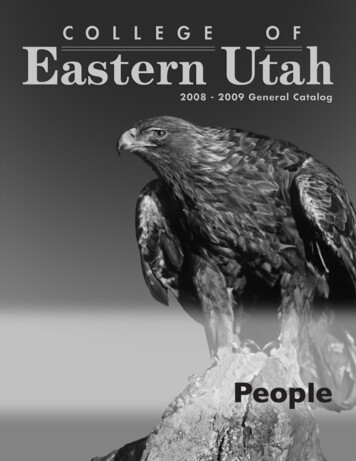
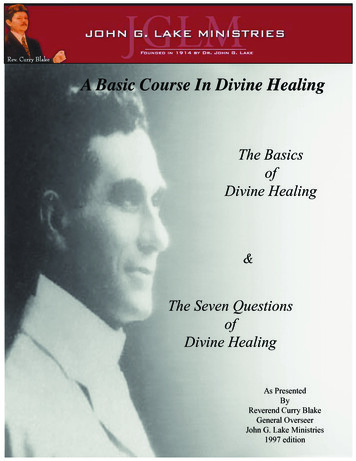
Salt Lake and Utah CountySubcounty Estimates, 2010-2019Analysis in BriefKey FindingsPopulation Growth, 2018-2019 Counties – Utah County grew more than Salt Lake County.Utah County added 17,827 people (2.8%). Salt LakeCounty added 10,879 people (1.0%). Cities - Herriman, Lehi, South Jordan, Eagle Mountain, andSaratoga Springs have the highest population growth(2018-2019). These five cities contributed 63% ofcombined growth in Salt Lake and Utah Counties for theyear. The 10 cities with the most growth vary widely inoverall size, from a population of about 11,000 in Vineyardto nearly 200,000 in Salt Lake City.Utah’s ongoing growth perpetuates the need for currenthousing and population estimates for cities and neighborhoods.This analysis provides these estimates for Salt Lake and UtahCounties, which are home to over half of Utah’s population andhave contributed 54% of the growth that has made Utah thefastest-growing state this decade. Salt Lake County grew 1.0%from 2018 to 2019, Utah County grew 2.8%, and both countiesexperienced their largest growth in housing units of any yearthis decade. Though Utah County is about half the populationof Salt Lake County, it gained more new residents from 2018 to2019, as the growth dynamic continues to shift south. Populationgrowth is most concentrated in southwestern Salt Lake Countyand northern and northwestern Utah County, but Salt LakeCity, Spanish Fork, Vineyard, and other areas are growingas well. Census tracts confirm this concentrated populationgrowth, with the 10 highest-growth tracts accounting for 60%of combined growth in the two counties. There were 73 tractsthat grew 2% or more from 2018 to 2019, while only two tractslost 2% or more in population.Housing Unit Growth, 2018-2019 Counties - 2018-2019 is the largest and fastest or tiedwith-fastest year of total housing unit growth in both SaltLake and Utah Counties (this decade). Renter-occupiedconstruction in Salt Lake County is the highest of any yearthis decade. It makes up just over half of new householdsin the county, compared to 17% in Utah County. Cities - Lehi and Herriman had the most new owneroccupied households. Salt Lake City had the most newrenter-occupied households by far, with high-density infilldevelopment bringing several large new apartmentcomplexes.Top 10 Population Growth, 2018-2019Salt Lake County and Utah County CitiesRankCityJuly 1,2018Pop.July 912.9%2Lehi68,31972,5624,2436.2%3South Jordan75,51578,6443,1294.1%4Eagle Mountain36,42339,3012,8787.9%5Saratoga Springs32,23734,6282,3917.4%6American Fork31,55633,4791,9236.1%7Salt Lake City198,133199,6781,5450.8%8Spanish 538.7%10Vineyard9,89111,0411,15011.6%Note: Ranked by largest 2018-2019 population growth.Source: Kem C. Gardner Policy Institute, David Eccles School of Business, University of UtahI N F O R M E D D E C I S I O N S TM1gardner.utah.eduIApril 2020
BackgroundThe Utah Population Committee (UPC), chaired by the Kem C.Gardner Policy Institute, prepares subcounty population estimates to support informed decision making in Utah. This reportpresents annual subcounty population, household, and housingunit estimates for cities and census tracts in Salt Lake County andUtah County from 2010 to 2019. Estimates refer to July 1 of eachyear. We produce these results using the housing unit method,one of the most widely used estimation methods for detailedgeographic levels.1 This report shares key findings, data, and amethodology. Visualizations and downloadable datasets forthese estimates are also available at gardner.utah.edu.Our previous subcounty estimates for Salt Lake County andUtah County were for the years 2010 to 2018.2 This current 2010to 2019 release revises previous 2010 to 2018 estimates and includes estimates for 2019. The estimates are consistent with theUPC county-level 2019 estimates released last December.3 Thisreport emphasizes 2019 results and changes from 2018 to 2019at the county, city, and tract levels.ResultsTotal Population: CountiesUtah County grew more than Salt Lake County from 2018 to2019. Utah County grew by 17,827 people, almost 7,000 morethan Salt Lake County’s increase of 10,879 people. Thisrepresents a 2.8% increase in Utah County and a 1.0% increasein Salt Lake County. For Salt Lake County, 2018 to 2019represents lower growth than the previous three years (2016 to2017 had the highest growth this decade). For Utah County,2018 to 2019 growth is the second-highest of the decade,following 2014 to 2015 growth and just higher than 2015 to2016 growth (see Tables 4 and 6). Though Utah Countyexperienced more and faster growth, the total population ofSalt Lake County remains almost twice that of Utah County: SaltLake County’s 2019 population is estimated at 1,152,960 andUtah County at 651,409.Although 2018 to 2019 isn’t the highest year for populationgrowth, it is the largest and most rapid growth year for housingunits this decade for both counties. Salt Lake County addedmore housing units than Utah County from 2018 to 2019 (about9,500 vs. about 6,600). Two key factors help explain why SaltLake County has lower estimated population growth for theyear than Utah County, despite having more new housing unitsbuilt. First, Utah County has larger household sizes for bothowner and renter households than Salt Lake County, so a newhome in Utah County is generally expected to house moreresidents. Second, renter-occupied construction comprises amuch greater share of Salt Lake County’s new construction thanin Utah County: 51% vs. 17% of new households (2018 to 2019).Renter units host fewer people; in both counties, the averagerenter household is smaller than the average owner household(See Tables 3 and 5). Together, smaller household sizes andgreater shares of rental construction in Salt Lake County meanthe county ultimately gained fewer people than Utah County.April 2020Igardner.utah.eduThese estimates also consider populations in group quarters.Group quarters include college dormitories, nursing homes,correctional facilities, and other group living facilities that varyfrom a typical household living arrangement. Though theoverall number of residents in group quarters in each county issimilar, Utah County has a higher share of its population residingin group quarters than Salt Lake County (2.3% vs. 1.3%). Most ofthe group quarters population in Utah County, home toBrigham Young University and Utah Valley University, resides incollege or university housing. In Salt Lake County, many studentsof the University of Utah and Westminster College live in offcampus housing that is not considered group quarters.4 Anothernotable group quarters population in Utah County is the ProvoMissionary Training Center (MTC), which has almost 2,000residents (2019). The largest portion of the group quarterspopulation in Salt Lake County resides in correctional facilities,mainly the Utah State Prison in Draper, which has over 3,000residents (2019).As with new construction, the tenure of the overall housingstock also varies by county. Utah County has a greater owneroccupied share of housing than Salt Lake County. We estimatethat 70% of Utah County households are owner-occupied and30% are renter-occupied in 2019. Salt Lake County has 66%owner households and 34% renter households.Total Population: CitiesThe highest population growth from 2018 to 2019 is inHerriman, Lehi, South Jordan, Eagle Mountain, and SaratogaSprings. These cities are in southwestern Salt Lake County andnorthwestern Utah County. The top ten growth cities account for89% of the combined population growth in Salt Lake County andUtah County from 2018-2019 (The cities are listed in Table 1 andFigure 1). City populations and changes are mapped in Figures 3through 5.2I N F O R M E D D E C I S I O N S TM
Table 1: Top 10 Population Growth, 2018-2019Salt Lake County and Utah County CitiesRankJuly 1,2018Pop.CityJuly 1,2019Pop.Changehouseholds from 2018 to 2019 are renter-occupied).5 Apartmentconstruction is booming in the downtown area and in otherneighborhoods like Sugarhouse and Jordan Meadows. Salt LakeCity added over 1,500 new residents from 2018 to 2019 for anestimated 2019 population of 199,678, representing 0.8% growthfor the year. While solid growth, it is a slightly lower rate than thetwo previous years (1.1% growth from 2016 to 2017 and 0.9%growth from 2017 to 2018).As discussed, growth in Utah County surpasses Salt LakeCounty in both rate and number from 2018 to 2019. Six of thetop ten growth cities are in Utah County. Lehi grew the most inthe county, adding over 4,200 residents over the year (6.2%growth). Eagle Mountain and Saratoga Springs follow, withadditions of about 2,900 and 2,400 residents. Vineyard had thefastest growth rate in the county at 11.6% (over 1,100 people).Vineyard has seen very high levels of growth since 2010, whenits population was a mere 139 people. The large “@Geneva”master planned community, at the former site of the GenevaSteel Mill, drives this growth.As in bordering southwestern Salt Lake County, Lehi, EagleMountain, and Saratoga Springs in northwestern Utah Countyoffer space for single-family home construction relatively closeto established or growing employment centers in both counties.Each of these cities has had mainly owner-occupied housingconstruction in the past year, and remains heavily owneroccupied in the overall housing composition of each city.American Fork, however, is notable as the only top ten growthcity other than Salt Lake City to favor renter-occupied housingconstruction this year. American Fork remains mostly owneroccupied overall, but new construction is bringing a notableincrease in renter-occupied housing. The city’s renter-occupiedshare of housing increased more than anywhere else in Utah orSalt Lake Counties, landing at 28% renter housing in 2019.Tables 7 and 8 share 2018 populations and changes for all hi68,31972,5624,2436.2%3South Jordan75,51578,6443,1294.1%4Eagle Mountain36,42339,3012,8787.9%5Saratoga Springs32,23734,6282,3917.4%6American Fork31,55633,4791,9236.1%7Salt Lake City198,133199,6781,5450.8%8Spanish 538.7%10Vineyard9,89111,0411,15011.6%Note: Ranked by largest 2018-2019 population growth.Source: Kem C. Gardner Policy Institute, David Eccles School of Business, University of UtahIn Salt Lake County, growth is concentrated in the southwestwhere land is still available for single-family home construction.Herriman, South Jordan, and Bluffdale each added substantialpopulations, mainly through large single-family developments.Herriman added by far the most residents of any city in eithercounty (5,539 people), arriving at 48,472 residents in 2019, anincrease of 12.9%. Within Salt Lake County, South Jordan has thenext highest growth, adding over 3,000 residents and surpassing78,500 in population. Owner-occupied housing dominates inthese cities, and new construction from 2018 to 2019 continuedto favor the construction of owner-occupied homes.Salt Lake City has the seventh highest population growth from2018 to 2019. Unlike the other top-growing cities in Salt LakeCounty, the majority of housing in the city is renter-occupied. Newconstruction has continued to boost the rental supply. The cityadded very few single-family homes, but instead added anabundance of new, high-density apartments (97% of ffdale1,4663.6%SpanishFork1,5450.8%6.0%Percent Population ountainSouthJordanLehi1,000014.0%8.0%Salt 3,1294.1%4,2436.2%5,000HerrimanTotal Population Change7,0006,0005,53912.9%Figure 1: Top 10 Population Growth with Percent Change, 2018-2019 Salt Lake County and Utah County CitiesPercent Changegardner.utah.eduI30.0%April 202025.0%20.0%n Change3%24.4%2,2676.3%2,500.8%ChangeI N F3,000O R M E D D E C I S I O N S TM2,3142,67222.2%3,5002,765Source: Kem C. Gardner Policy Institute, David Eccles School of Business, University of Utah
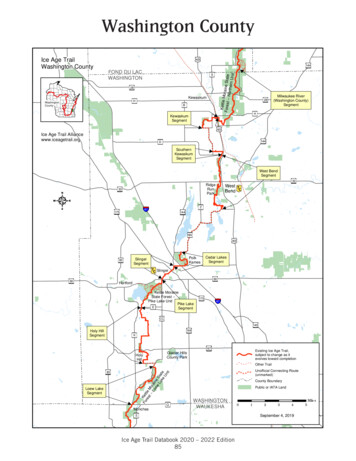
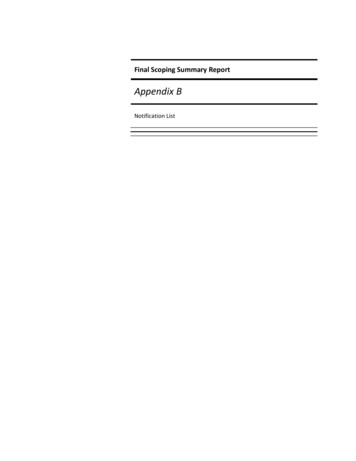
Total Population: TractsCensus tracts are subdivisions of a county of relatively similarpopulation size. They are a common statistical geography forCensus Bureau data, including survey data between decennialcensuses. The boundaries may be updated before eachdecennial census and remain the same for the following decade.Estimates at the tract level provide coverage of all areas of acounty and offer greater geographic detail than city-levelestimates, particularly for large cities that include many tracts.The highest population growth from 2018 to 2019 occurredin Tract 101.09 in Saratoga Springs, a large tract which includesthe Harvest Hills neighborhood and other developing areasnear the intersection of Crossroads Boulevard and RedwoodRoad. Housing construction boomed in the tract this year, with2018 to 2019 showing the highest year of growth in the area.New construction brought 760 new units and 2,765 newresidents, giving this tract the highest population growth of alltracts in the Salt Lake and Utah Counties. In the past year, 91%of new households were owner-occupied and 9% were renteroccupied in this tract.The top 10 growth tracts are shown in Table 2. The tractsconfirm the growth areas seen at the city level, and again reflectthe strong concentrations of population growth: the top 10tracts account for 60% of the combined population growth inSalt Lake County and Utah County from 2018 to 2019. FollowingTract 101.09 in Saratoga Springs, the next highest growth tractsare in southwestern Salt Lake County in parts of Herriman andthe South Jordan/West Jordan border area. The highest growthin this area is Tract 1151.06 of Herriman, which gained nearly2,700 residents. Following those tracts, the next highest growthtracts are also in Salt Lake County, in areas of Salt Lake City,Bluffdale, Murray, and West Jordan.Tract-level estimates reveal which areas are dramaticallychanging. For example, while Salt Lake City grew 0.8% at thecity level, Tract 1003.06, located in Jordan Meadows (betweenthe Utah State Fairpark and the Salt Lake International Airport),grew 24% this year, adding hundreds of new apartment units.We note that several tracts have grown so high in population—some becoming as large as cities—that they will be divided intomultiple tracts for the 2020 Census.Tract populations and changes are mapped in Figures 6through 11. Tables 9 and 10 share 2018 and 2019 populationsand changes for all tracts.24.4%6.0%Eagle 2,4371,126Notes: Ranked by largest 2017-2018 absolute population change. Source: Kem C. Gardner Policy Institute, David Eccles School of Business, University of UtahChange1,1508.7%1,188Percent Population Change19,5161,2644.0%9.3%12.0%2.0%VineyardWest JordanLehi/American 4%16,48735,011Salt LakeCity2,8787.9%Salt Lake 048.0%6.9%19,594SaratogaSprings102,26716,922South Jordan/West JordanLehi0Herriman892,314Change tain5 3,000 1003.06Change2,765Herriman6 2,000 1128.107 1,000 1121July 1, 2019 Pop.15,2273,1294.1%4 4,000 1131.07July 1, 2018 Pop.12,462SouthJordanTotal Population Change3 5,000 1152.09Tract Area DescriptionSaratoga Springs4,2436.2%Rank Census Tract ble 2: Top 10 Population Growth, 2018-2019, Salt Lake County and Utah County Census Tracts5.9%0.0%14.6%10.0%Percent 152.091128.101003.061131.0711211143101.12Percent Population 15.8%2,50016.3%3,0002,6722,765Total Population Change3,50022.2%Figure 2: Top 10 Population Growth with Percent Change, 2018-2019, Salt Lake County and Utah County Census Tracts101.04Census Tract NameChangePercent Changegardner.utah.edu4675650I N F O R M E D D E C I S I O N S TM203,582I51,200,71971April 202048,6922,081Source: Kem C. Gardner Policy Institute, David Eccles School of Business, University of Utah
Housing Units by TenureAs discussed in the methodology section, we estimate thetenure (owner or renter-occupied status) of new construction(anything after Census 2010) because the actual tenure isunknown. However, resulting estimates of owner and renterhouseholds still offer useful information about subcounty areas.We consider structures of 1-11 units to be owner-occupied, andstructures of 12 or more units to be renter-occupied.Our results show that from 2018 to 2019, the highest growthin owner-occupied households occurred in Lehi, Herriman,South Jordan, Eagle Mountain, and Saratoga Springs. Thesecities gained from 1,207 new owner households (Lehi) down to678 new owner households (Saratoga Springs). The UtahCounty portion of Draper experienced the fastest growth inowner households, at 12.3% (due to just 82 new ownerhouseholds), while Bluffdale and Herriman followed at 11.8%(381 new owner households) and 11.3% (1,011 new ownerunits), respectively.The number of renter-occupied households increased themost in Salt Lake City, Herriman, Murray, American Fork, andSouth Salt Lake, with Salt Lake City far exceeding the othercities. Several large developments added these renter units inSalt Lake City, with Liberty Boulevard, Hardware Village,Meridian Apartments, Block 44, Milagro Apartments, NorthTemple Flats, and Brixton Flats among the largest newcomplexes.6 There are 1,872 new renter households in Salt LakeCity, 598 in Herriman, 541 in Murray, 495 in American Fork, and458 in South Salt Lake (2018 to 2019).7The housing composition of some cities changed from 2018to 2019, as indicated by owner and renter shares of housing.Several cities increased their shares of owner-occupiedhouseholds, with the highest increases in shares in Bluffdale,Saratoga Springs, and the balance of Utah County.8 Followingthe opposite trend (increasing in shares of renter-occupiedhouseholds) were American Fork, Vineyard, Herriman, andSouth Salt Lake. Alta, in Little Cottonwood Canyon, has thehighest overall share of renter-occupied housing (79%). Theonly other cities with more renter-occupied than owneroccupied housing are South Salt Lake (65%), Provo (58%), SaltLake City (56%), and Midvale (52%).Data, Methodology, and Comparative EstimatesBuilding Permit Data and GeocodingWe analyzed building permit data from Construction Monitor,a proprietary source of permit data. We geocoded the data(mapped permits to their correct locations) using severalmethods. We performed most geocoding using the UtahAutomated Geographic Reference Center (AGRC) GeocodingToolbox, though other methods were used for permits thatwere not correctly located with the toolbox.9 Subdivisionnames were used to place a limited number of permits. Manypermits were individually researched to determine their properlocations.Over the years we have produced subcounty estimates,regional planners have often participated in improvement ofthe building permit data to help ensure its high quality. Ourcollaborators are the Wasatch Front Regional Council for SaltLake County and Mountainland Association of Governments forUtah County. They have provided edits pertaining toconstruction completion times, numbers of units, permitduplication, and building locations. As Construction Monitordoes not have complete coverage of large multifamilystructures, the Kem C. Gardner Policy Institute and the WasatchFront Regional Council added information for large apartmentprojects built after the 2010 Census that were not present inConstruction Monitor data. Many resources, including parceldata, real estate reports, news articles, and aerial imagery wereused to find information about additional structures for eachI N F O R M E D D E C I S I O N S TMyear of estimates. The addition of omitted apartment data isone of the most significant data refinements we perform interms of its impact on the resulting population estimates.We compared the improved Construction Monitor permitdata to the Census Bureau’s Building Permit Survey data andthe Ivory-Boyer Construction Database, both of which reportbuilding permits for cities and towns, to look for cities wherethe Construction Monitor data may be less accurate than thesesources.10 We observed that our permit data for Eagle Mountainwere low compared to the other sources, so we supplanteddata for the city with parcel (assessor’s) data from the Utah LandInformation Record Parcels to improve the housing unitestimates. In prior years we also used parcel data to add to ourdataset for Cottonwood Heights and Draper in Salt Lake County,and Spanish Fork, Elk Ridge, Woodland Hills, and Genola in UtahCounty.11 While we are not able to resolve all differences seenin permit data across sources, these refinements addcompleteness and accuracy to our building permit dataset.Salt Lake City data were also analyzed in detail due to thehistorically high number of new units permitted in late 2016,which were nearly all for large apartment complexes. TheCensus Bureau’s Building Permit Survey and Ivory-BoyerConstruction Database each reported over 3,000 new housingunits permitted, over twice the amount reported in any otheryear this decade.12 Using a list provided by the Ivory-BoyerConstruction Database, all multifamily units were researched to5gardner.utah.eduIApril 2020
Assumption 1: Time of Construction and Occupancy (Lag Times)We assume new housing units are built and then becomeeither occupied or vacant six months after the issue date of thebuilding permit. The only exceptions are for large multifamilyapartments, which have a much longer lag from permit date tooccupancy. The goal of differing assumptions for largemultifamily apartments is to improve the average timing ofconstruction and occupancy for housing units of this kind.In these estimates, we assume apartment projects of 100-174units are completed and occupied in two phases. The phasescome 12 and 15 months after the permit date, with half of theoverall units completed in each phase. We assume projects of175 or more units are completed and occupied in four phases.The phases are 9, 12, 15, and 18 months after the permit date,with one-quarter of the overall units completed each time.Some groups of permits have less than 100 units each but wereidentified as belonging to the same large complex; thesepermits follow the 15 or 18-month lags described here. Thesepermits are identified through an automated step, thoughsome are also manually adjusted. In some cases, permit datesfor specific complexes are adjusted so that the estimatedconstruction computations better match research findingsconcerning their actual construction timelines.better estimate their actual completion times, and wereadjusted accordingly. We found that several complexes fromthis large set of permits have contributed to both 2018 and2019 population estimates, with some complexes still notcomplete by the 2019 estimates. The timing of apartmentconstruction greatly influences our population estimates forSalt Lake City.Methodology and AssumptionsThe subcounty estimates are produced using the housingunit method. The basic technique of the housing unit method isvery straightforward; key points of the method used for theseestimates are shared here. Geography is crucial throughout theprocess, as the estimates are calculated at a census blockgeographic level, and tract and city estimates are aggregatedfrom the block results. The method begins with block-levelhousing and population data from the 2010 Census. Geocodedbuilding permit data, which include a housing unit count witheach permit, are used to estimate the annual changes inhousing units for each block. Once housing unit changes areestablished, ow
Brigham Young University and Utah Valley University, resides in college or university housing . In Salt Lake County, many students of the University of Utah and Westminster College live in off-campus housing that is not considered group quarters .4 Another nota