Transcription
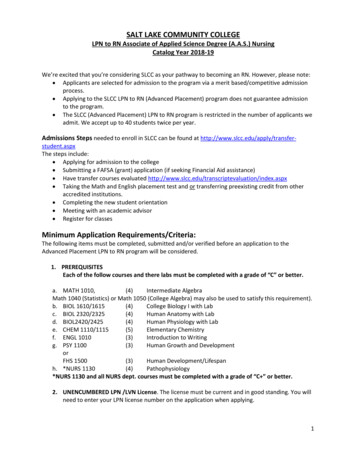
GREAT SALT LAKE NORTH ARM SALT CRUST MONITORING,SPRING 2017 UPDATEby Andrew Rupke and Taylor BodenOPEN-FILE REPORT 714UTAH GEOLOGICAL SURVEYa division ofUTAH DEPARTMENT OF NATURAL RESOURCES2020
Great Salt Lake North Arm Salt Crust Monitoring,Spring 2017 UpdatebyAndrew Rupke and Taylor BodenCover photo: Salt crust exposed along the north arm of Great Salt Lake near the Spiral Jetty.Suggested citation:Rupke, A. and Boden, T., 2020, Great Salt Lake north arm salt crust monitoring, spring 2017 update: Utah Geological SurveyOpen-File Report 714, 13 p., https://doi.org/10.34191/OFR-714.DisclaimerThis open-file release makes information available to the public that may not conform to UGS technical, editorial, or policy standards; thisshould be considered by an individual or group planning to take action based on the contents of this report. Although this product representsthe work of professional scientists, the Utah Department of Natural Resources, Utah Geological Survey, makes no warranty, expressed orimplied, regarding its suitability for a particular use. The Utah Department of Natural Resources, Utah Geological Survey, shall not be liableunder any circumstances for any direct, indirect, special, incidental, or consequential damages with respect to claims by users of this product.The Utah Geological Survey does not endorse any products or manufacturers. Reference to any specific commercial product, process, service,or company by trade name, trademark, or otherwise, does not constitute endorsement or recommendation by the Utah Geological Survey.OPEN-FILE REPORT 714UTAH GEOLOGICAL SURVEYa division ofUTAH DEPARTMENT OF NATURAL RESOURCES2020
Blank pages are intentional for printing purposes.
CONTENTSEXECUTIVE SUMMARY. 1INTRODUCTION AND BACKGROUND. 1METHODS. 1MONITORING RESULTS AND DISCUSSION. 1CONCLUSIONS. 8ACKNOWLEDGMENTS. 8REFERENCES. 9APPENDIX. 11FIGURESFigure 1. Salt crust monitoring transect locations. 2Figure 2. Salt crust monitoring station locations along transect 1. 3Figure 3. Salt crust monitoring station locations along transect 2. 4Figure 4. Salt crust monitoring station locations along transect 3. 5Figure 5. Salt crust thickness measurements from transect 1. 6Figure 6. Salt crust thickness measurements from transect 2. 6Figure 7. Salt crust thickness measurements from transect 3. 7Figure 8. Salt crust thickness measurements from stations along transect 2 and transect 3. 8TABLESTable 1. Lake conditions during study. 3
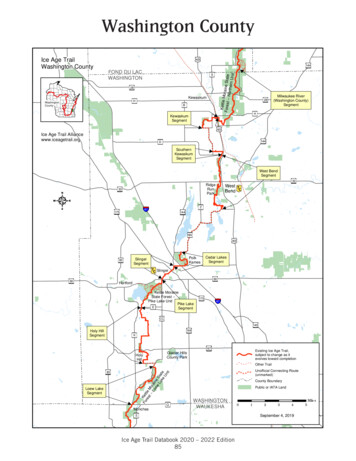
Great Salt Lake north arm salt crust monitoring, spring 2017 update1EXECUTIVE SUMMARYWhile monitoring nearshore salt crust thickness in the north arm of Great Salt Lake from summer 2015 through early spring2017, we observed seasonal changes and response to a causeway modification. The exposed salt crust, above water level, primarily exhibited dissolution; however, during late summer 2016 a minimal amount of growth may have occurred at the base ofthe crust. Where inundated, the salt crust showed more substantive responses to seasonal changes and lake events. As noted anddiscussed in our previous study (Rupke and others, 2016), measurements of salt crust below the water line exhibited thicknessloss of up to 0.46 ft between late summer 2015 and early spring 2016. Monitoring during summer 2016 showed seasonal saltcrust growth of up to 0.49 ft. Also, because of historical low lake levels in the north arm during summer 2016, extensive crustwas exposed at the north end of the lake and we recorded the thickest nearshore salt crust measurement of 2.88 ft. By earlyspring 2017, much of the nearshore salt crust had dissolved and we recorded crust dissolution as much as 0.54 ft. Crust dissolution between summer 2016 and early spring 2017 occurred in response to both seasonal lake rise and increased flow throughthe causeway bridge which opened on December 1, 2016.INTRODUCTION AND BACKGROUNDGreat Salt Lake (GSL) is divided by a rockfill railroad causeway that limits the flow of brine between the north and south armsof the lake. The rockfill causeway was completed in 1959 and the resulting restriction of flow has caused different salinity levelsin each arm. Salinity levels in the south arm are more variable, but the north arm has been at or near saturation with respect tohalite (sodium chloride) for most of the time since the causeway was constructed. These high salinity levels have resulted in asalt crust precipitating on the floor of the lake in the north arm. The salt crust has been a consistent presence in the north armwith the likely exception of the late 1980s and early 1990s when lake levels were high (Loving and others, 2000; Mohammedand Tarboton, 2012). The salt crust is important because it can sequester a large amount of the total salt load of GSL (over 20%)thereby having a significant effect on overall lake salinity.The purpose of this study was to monitor the thickness of the salt crust over time, in particular how the crust changed fromsummer 2016 through spring 2017. This study expands upon work reported in Rupke and others (2016) that included nearshorethickness measurements of the salt crust. Three transects and corresponding measurement sites used in the previous study wereused as a baseline for monitoring crust thickness changes in this study. The crust measurement methods outlined in Rupke andothers (2016) were also used in this study.Observing how the salt crust changes over time provides data that helps us understand how GSL’s salinity cycle functions. Morespecifically, we can better understand how the salt crust responds to changes in the GSL system. Also, our data collection providesa reference for understanding how the salt crust responded to the new railroad causeway bridge that opened on December 1, 2016.METHODSAs previously noted, we used the same crust measurement methods developed and reported in Rupke and others (2016).When re-occupying a site, we used a Wide Area Augmentation System-enabled GPS to locate the site. In some cases wewere able to locate the previous hole used. In that event, we did not measure the previous hole, but drilled and measured anew hole within a foot or two of the previous one. Old holes often appeared to have experienced enhanced dissolution, sore-measurement had potential to be inaccurate.During the study we also collected water/brine samples and measured the density. The procedures we used for measuringdensity are consistent with procedures used for the Great Salt Lake brine chemistry database that is maintained by the UtahGeological Survey and posted on the survey’s website (https://geology.utah.gov/docs/xls/GSL brine chem db.xlsx). Thebrine densities were measured using an Anton Paar DMA 35 density meter.MONITORING RESULTS AND DISCUSSIONTransects 1, 2, and 3 established by Rupke and others (2016) were monitored during the course of this study (figure 1). Transects 1 and 2 were revisited three times each and transect 3 was revisited twice. Lake conditions for all monitoring dates of each
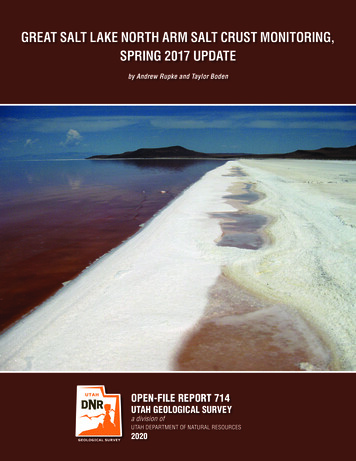
Utah Geological Survey2transect, including those from 2015 and early 2016 are summarized in table 1. Measurement data for transects 1, 2, and 3 arepresented in the appendix and figures 2, 3, and 4. The changes we observed are illustrated in figures 5, 6, 7, and 8.The salt crust generally experienced dissolution and thickness loss while exposed above the water line. Transect 2 illustratesthis well (figures 6 and 8a). However, from July 20, 2016, to September 20, 2016, several stations well above the water lineapparently experienced slight thickness growth (figure 8a). We are aware of no mechanism to increase the thickness of theexposed salt crust at the surface above the water with the possible exception of accumulation and assimilation of detrital/loosesalt, but this would only be viable very near the water’s edge (station 24 is a likely candidate for this). However, given thatbrine is generally just below the surface of the crust, the salt crust may have experienced some growth through precipitation ofsalt at its base. Because thickness increase was consistently observed at several stations (20, 21, 22, and 23; figure 8a), the crustprobably did experience some growth and the results are not due to measurement variability or error.340000360000Figure AreaÜ510 MilesGreat46200000OgdenSaltTransect 3ft4200Lake!(SaltLakeCity4600000Lake le4600000vel-4192ftvel Lake le4620000320000Transect 2North Armof45800004580000!(!( Transect 1Great Salt Lake45600004560000Railroad CausewayFigure 1. Salt crust monitoring transect locations. Grid coordinates are UTM Z12 NAD83 (m). BaseFigure 1. Salt crustmonitoringtransectUTM Z12NAD83 (m). Base imagery is from August 2014 and Juneimageryis fromAugustlocations.2014 andGridJunecoordinates2015 and isareprovidedby Google.2015 and is provided by Google.
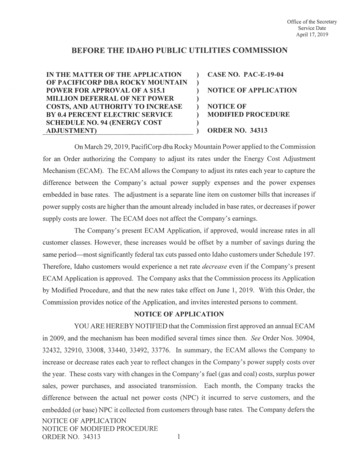
Great Salt Lake north arm salt crust monitoring, spring 2017 update3Table 1. Lake conditions during study. Surface water elevations from U.S. Geological Survey gage at Saline, Utah.DateEventNorth Arm Surface WaterElevation (feet)Measured Density of NorthArm Brine (g/cm3)August 13, 2015transect 1 measured4191.40--August 21, 2015transect 2 measured4191.34--August 25, 2015transect 3 measured4191.26--March 4, 2016transect 2 measured4190.861.218April 7, 2016transects 1 and 2 measured4190.911.223July 20, 2016transects 1 and 2 measured4189.971.230September 15, 2016transect 3 measured4189.10--September 20, 2016transects 1 and 2 measured4189.031.232December 1, 2016causeway breach opened4189.20--March 9, 2017transects 1 and 2 measured4192.751.185April 6, 2017transect 3 measured4193.32--April 12, 2017probing for crust near transect 013!(12!(10!(9!(129 1301361374587900!(xxx1.4x!(xxx1.36x(!( .250.730.74x0.550.410.380.3500.33x0.180.180Ü0500 09x0.16x0Figure2. ecttransect 11 (figure(figure 1).1). LabelLabel aboveLabelsbelowpointFigure2. Saltcrustmonitoringstationlocationsabove umber.Labelsbelowpointindicate salt crust thickness in feet on the following dates (in descending order): Aug. 13, 2015; Apr. 7, 2016; Jul. 20, 2016; Sep. 20, 2016; andindicatesalt crust thickness in feet on the following dates (in descending order): Aug. 13, 2015; Apr. 7, 2016; Jul. 20, 2016; Sep. 20, 2016; andMar. 9, 2017. An "x" indicates a measurement was not taken on that date. Grid coordinates are UTM Z12 NAD83 (m). Base imagery is fromMar.August9, 2017.Anand"x"isindicatesa measurementwas not taken on that date. Grid coordinates are UTM Z12 NAD83 (m). Base imagery is from2014provided byGoogle.August 2014 and is provided by Google.
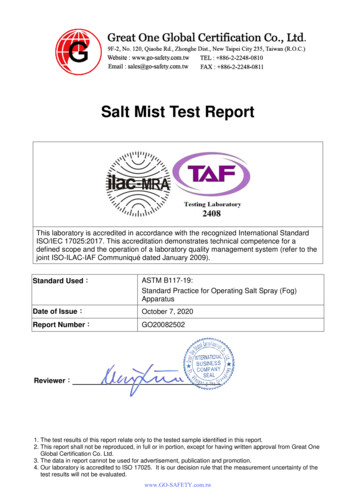
Utah Geological 4588500359900500 FeetFigure3. longtransecttransect 22 (figure(figure 1).1). Labelnumber.LabelsbelowpointpointFigure3. SaltcrustmonitoringstationLabel owingdatesdates(in(indescendingdescending order):4, 4,2016;Apr.7, 2016;Jul.Jul.20, 20,2016;Sep.Sep.20, 20,indicatesaltsaltcrustthicknessin ;2015;Mar.Mar.2016;Apr.7, 2016;2016;2016; and Mar. 9, 2017. An "x" indicates a measurement was not taken on that date. Grid coordinates are UTM Z12 NAD83 (m). Base imagery2016;and Mar. 9, 2017. An "x" indicates a measurement was not taken on that date. Grid coordinates are UTM Z12 NAD83 (m). Base imageryis from August 2014 and is provided by Google.is from August 2014 and is provided by Google.The largest changes in thickness came from stations that were inundated at least part of the time. During late winter and earlyspring 2016 and 2017, substantial decreases in crust thickness were recorded, and during late summer 2016, significant crustthickness increases were recorded. Between August 2015 and April 7, 2016, we measured thickness reductions of 0.46 and 0.42ft at stations 8 and 24 on transects 1 and 2, respectively. The largest increase we observed between measurements was at station 8 along transect 1 from April 7, 2016, to July 20, 2016, where the crust grew by 0.49 ft. From July 20, 2016, to September20, 2016, we observed a thickness increase of 0.39 ft at station 128 along transect 2. We also recorded several other thicknessincreases at sites that were underwater for all or part of summer 2016. The largest decrease in thickness was at station 29 alongtransect 3 where 0.54 ft of crust dissolved between September 15, 2016, and April 6, 2017. Along transect 2 at station 23, 0.48ft of salt crust dissolved between September 20, 2016, and March 9, 2017. Several other stations showed similar decreases inlate winter and early spring 2017 compared to our previous measurements from late summer 2016.The observed trends were basically consistent with lake conditions. Salt crust dissolved between summer 2015 and earlyspring 2016 during a time when the lake level rose slightly (0.3 ft) and significant precipitation events occurred that mayhave transiently and locally diluted nearshore brine (Rupke and others, 2016). Crust was added during summer 2016 as thenorth arm lake elevation dropped to record low levels (4189.0 ft above sea level at its lowest) and while water density wasrelatively high (1.232 g/cm3 on September 20, 2016) (table 1). The salt crust increases we measured during summer 2016were likely a result of salt raft accumulation and crystal growth on the floor of the lake. A significant change was evidentin our measurements in spring 2017. This was partially a function of seasonal change, but the opening of the causewaybreach on December 1, 2016, certainly played a role. By March 9, 2017, the north arm water level had risen 3.6 ft and thenearshore salt crust along transects 1 and 2 had dissolved completely at all stations where we were able to measure (figures5 and 6). In deeper water, we noted some remnant crust, but the water depth prevented us from taking accurate measurements. On April 6, we measured the crust along transect 3. The crust there was also undergoing dissolution, but a remnantremained (figure 7). However, at the most southerly station (station 29; in the deepest water) we noted areas where the crusthad completely dissolved away. Our water/brine density measurements from spring 2017 were notably lower at 1.185 and1.191 g/cm3 (table 1).
Great Salt Lake north arm salt crust monitoring, spring 2017 update34750039 !(40 !(0000.21x038 !(0.660.580.5461400026 !(27 !(28 !(29 !(1.11.120.7130 !( 1.090.17x0.690.4831 !(x0.940.7332 !(x46135001.3133 !( 1.02x34 !(3480000.930.840.81 51.581.34x1.6835 !( 1.23x1.581.18x1.881.57xx1.57x4613000461300036 !(3737b !((!x131 !( 2.24xx132 !( 2.48x04612500Ü4612500133 !(x2.88x1,000 FeetFigure4. Saltstationcrust ).left stationof pointnumber.indicatesFigure 4. Salt crustmonitoringlocations alongtransect3 (figureLabel 3leftof point LabelindicatesLabels right of pointnumber.of pointindicatesalt crustorder):thicknessfeet2015;on theindicate salt cruststationthicknessin feetLabelson therightfollowingdates(in descendingAug.in25,Sep.following15, 2016;datesand (inApr. 6, 2016. An "x"descendingAug.2016; andareApr.UTM6, 2016."x" indicatesmeasurementwasindicates a measurementwasorder):not takenon25,that2015;date.Sep.Grid15,coordinatesZ12 AnNAD83(m). Basea imageryis fromAugust 2014 and isnot taken on that date. Grid coordinates are UTM Z12 NAD83 (m). Base imagery is from Augustprovided by Google.2014 and is provided by Google.As the north arm water level reached record lows during late summer 2016, we were able to access areas of the crust that werepreviously inaccessible. As a result, our thickest crust measurement from this study and our previous study was obtained alongtransect 3 in September 2016 at station 133 where we measured 2.88 ft of salt crust. Notably, this measurement shows thickcrust much farther north than Goodwin (1973) projected, which has potential implications for the total salt load sequestered inthe north arm salt crust.Our results are useful for observing the seasonal changes and other trends in the lake for measurement sites that are submergedfor at least part of the time. Our measurements in spring 2016 demonstrated the winter/fall dissolution of salt crust at transects 1 and 2 related to seasonal freshening of the lake and perhaps short-term, local freshening from significant rain events.Measurements from summer 2016 showed precipitation of new salt crust in response to evaporation and concentration oflake brine, and measurements from late winter and early spring 2017 demonstrated a second year of winter/spring freshening
Utah Geological Survey6UTM Easting (m)3601500.03602503603503604503605503606500.2Salt Crust Thickness Sep-161.49-Mar-171.6Figure 5. Salt crust thickness measurementsfromthicknesstransect1. Solid circlesindicatecrustmeasurementsabove water/brine level, and openFigure 5. Salt crustmeasurementsfrom transect1. Solidsaltcirclesindicatesalt crustmeasurementsabove water/brinecircles indicate measurements belowthe water/brinelevel.level, and open circles indicate measurements below thewater/brine level.UTM Easting (m)3599000.03600003601003602003603000.2Salt Crust Thickness 161.220-Sep-161.49-Mar-171.6Figure 6. Salt crust thickness measurementsfromtransect2. Solid fromcirclesindicatecrustmeasurementsabove water/brine level, and openFigure 6. Salt crustthicknessmeasurementstransect2. Solidsaltcirclesindicatesalt crustmeasurementsabove water/brinecircles indicate measurements belowthe water/brinelevel.level, and open circles indicate measurements below thewater/brine level.
Great Salt Lake north arm salt crust monitoring, spring 2017 update7UTM Northing (m)46123000.04612800461330046138004614300Salt Crust Thickness Figure 7. Salt crust thickness measurements from transect 3. Solid circles indicate salt crustFigure 7. Salt crust thickness salt crust belowmeasurementsabove water/brine level, and openabovefromwater/brinelevel,opencirclescircles indicatemeasurementsthelevel.circles indicate measurementswater/brinebelow thewater/brine level.and dissolution. However, the timing of our measurements includes periods of unusual circumstances. Spring runoff in 2016was minimal, and the north arm experienced unusually low water level rise (less than 0.6 ft in total). The exposed crust inspring 2016 also exhibited signs of significant heavy rain that may not be typical but may have contributed to nearshore crustdissolution (Rupke and others, 2016). Also, the opening of the causeway bridge on December 1, 2016, resulted in dramaticwater level rise (over 3.7 ft between our September 20, 2016, and March 9, 2017, measurements) in early 2017. Unfortunately,because seasonal water level rise and opening of the causeway bridge were coincident, we cannot separate the two events inunderstanding the salt crust’s response. However, we can safely assume that the salt crust experienced greater levels of dissolution because of the bridge opening.Nearshore measurements and the limitations of our methods present some challenges in interpretation of trends. For instance, asmentioned in Rupke and others (2016), we are uncertain how much of an effect heavy rain events had on the nearshore crust bylocally diluting the water nearest to the shore during heavy runoff. Also, as water level rises and falls, our ability to measure thecrust at certain sites changes, disrupting the continuity of our records at important locations. Water level rise and fall presentsthe added complication of some measurement sites experiencing both exposure and inundation for undetermined amounts oftime. Additionally, when the crust completely dissolves, as it did along much of transects 1 and 2, we do not have a full assessment of the amount of dissolution that could have occurred.Although notable dissolution of the nearshore crust occurred during winter and early spring 2017, we assume that a significantamount of salt crust remains in more central, submerged parts of the north arm. This highlights the potential benefit of measuring salt crust thickness in deeper water if a reasonable method can be developed, thereby reducing the limitations listed above.However, we intend to continue monitoring the nearshore salt crust to continue to qualitatively observe trends and perhaps moresubstantive conclusions can be drawn from a longer record of observations.
Utah Geological Survey8a1.4Station 19Station 20Salt Crust Thickness (feet)1.2Station 211.0Station 22Station 230.8Station 24Station 1260.60.40.20.0Jul. 2015Oct. 2015Jan. 2016Apr. 2016Jul. 2016Oct. 2016Jan. 2017Apr.Ap 2017Jul. 2017Oct. 2016Jan. 2017Apr. 2017Jul. 2017Dateb1.2Salt Crust Thickness (feet)1.00.80.6Station 260.4Station 27Station 280.2Station 29Station 380.0Jul. 2015Oct. 2015Jan. 2016Apr. 2016Jul. 2016DateFigure 8. Salt crust thickness measurements from stations along (a) transect 2 and (b) transect 3. Solid circles indicate salt crust tsfromstationsalong (a) transectabove elowthe water/brinelevel. 2 and (b) transect 3.Solid circles indicate salt crust measurements above water/brine level, and open circles indicatemeasurements below the water/brine level.CONCLUSIONSNearshore monitoring of the salt crust is useful for qualitatively observing trends caused by changing lake conditions. Bothseasonal changes and causeway modifications were reflected in how the salt crust changed from summer 2015 through earlyspring 2017. Measurements from late winter and early spring in both 2016 and 2017 recorded notable dissolution of the saltcrust in areas where it was below the water/brine level, and summer 2016 was marked by growth of the salt crust in areaswhere it was inundated. Somewhat unusual lake conditions were present during our period of monitoring, so future monitoring may help define more substantive conclusions on the usefulness of nearshore observations. More quantitatively usefulobservations would likely require monitoring of the salt crust in deeper water.ACKNOWLEDGMENTSWe thank the Division of Forestry, Fire and State Lands for providing funding for this project. Michael Vanden Berg, Ken Krahulec, Craig Morgan, Stephanie Carney, and Mike Hylland provided helpful reviews of the report.
Great Salt Lake north arm salt crust monitoring, spring 2017 update9REFERENCESGoodwin, J.H., 1973, Composition and lithology of the salt crust, north arm, Great Salt Lake, Utah: unpublished report prepared by the Utah Geological and Mineralogical Survey, 12 p.Loving, B.L., Waddell, K.M., and Miller, C.M., 2000, Water and salt balance of Great Salt Lake, Utah, and simulation of waterand salt movement through the causeway: U.S. Geological Survey Water-Resources Investigations Report 00-4221, variously paginated.Mohammed, I.N., and Tarboton, D.G., 2012, An examination of the sensitivity of the Great Salt Lake to changes in inputs:Water Resources Research, v. 48, no. W11511, 17 p.Rupke, A., Boden, T., and Nielsen, P., 2016, Great Salt Lake’s north arm salt crust: Utah Geological Survey Report of Investigation 276, 47 p. https://doi.org/10.34191/RI-276.
10Utah Geological Survey
Great Salt Lake north arm salt crust monitoring, spring 2017 update11APPENDIXSalt thickness measurement dataAPPENDIX. Salt thickness measurement 2.138.884.252.19Thickness 1Thickness 2Thickness 3Thickness UTM Z12 NAD83UTMUTMEasting 88510DateMeasuredMeasurementin esnonononononononoyesnonoyesyesNumber of holes Commentused formeasurement3333?3?3?n/aedge of salt crust11only a few inches from shore11111111patchy in this area11111at the edge of water1111n/aunable to measure, but some salt crust present; crust irregular and covered with 112sample SCI-1 collectede
spring 2017, much of the nearshore salt crust had dissolved and we recorded crust dissolution as much as 0.54 ft. Crust dissolu-tion between summer 2016 and early spring 2017 occurred in response to both seasonal lake rise and increased flow through the causeway bridge whic