Transcription
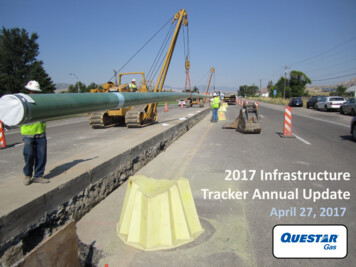
2017 InfrastructureTracker Annual UpdateApril 27, 2017
Agenda PHMSA Mega Rule Belt Line Replacement 2017 Projects Scheduling 2016 Cost Variance High Pressure Replacement 2017 Projects Update2016 Cost VarianceUpdated HP Replacement Program Evaluation CriteriaScheduling
Pipeline Safety “Mega Rule” (not final) New Administration Impacts– Delay of final rule– Speculation that non-statutory parts may beremoved or reduced in scope (NTSB items) Example: “the proposed rule’s guidance for verifyingthe maximum allowable operating pressures andmaterials of pipelines goes beyond what is coveredunder Congress’ mandate to the agency”– No clarifying information to date has beenprovided by PHMSA
Belt Line Replacement Belt Line Maps Pipe Retired Pipe Remaining Work Prioritization Belt Line 2017 Schedule Progress Update
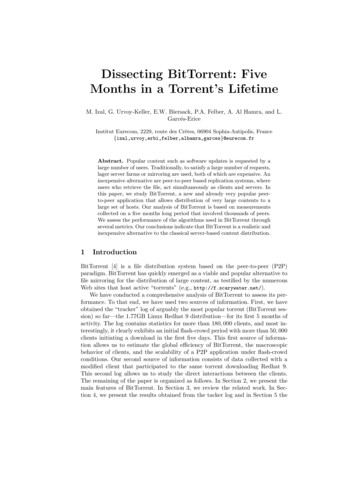
2100 N.NSALT LAKE COUNTY8” & Larger MainsRemaining on Tracker (26mi)(28.4mi)Replaced on Tracker (7.9(5.5 mi)20172016 ProjectsRegulator Station400 S.Salt Lake CityU of USunnyside Ave.300 E.1300 E.800 S.1000 E.South Temple400 E.100 S.200 W.MainNorth Temple500 N.500 W.1000 W.2200 W.33.9 Miles on Tracker (Total)1700 S.5400 S.Taylorsville3300 S.5
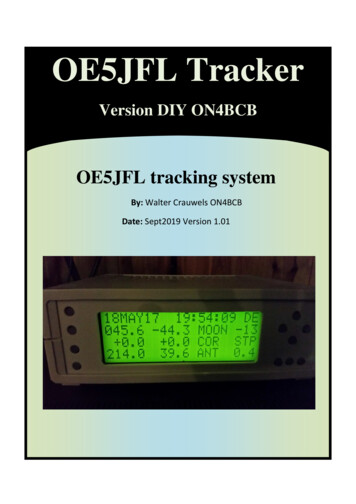
NUTAH COUNTY3.8 Miles on Tracker8” & Larger MainsRemaining on Tracker (1.0 mi)Replaced on Tracker (2.8 mi)2017 ProjectRegulator StationBYU800 W.800 N.Provo400 S.400 S.PV00076
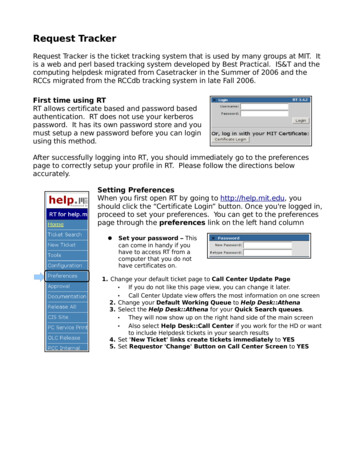
N2nd St.WEBER COUNTY17.1 Miles on TrackerWall Ave.8” & Larger MainsRemaining on Tracker (14.0 mi)Replaced on Tracker (3.1 mi)Regulator StationOgdenSan Jose St.Washington30th St.WeberState6200 S.7
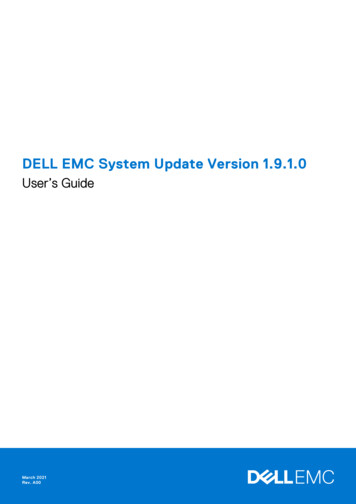
NClearfieldDAVIS COUNTYFreeport CntrGentile St.15.3 Miles on Tracker8” & Larger MainsRemaining on Tracker (14.2 mi)Replaced on Tracker (1.0 mi)2017 ProjectRegulator StationLaytonShepard Ln.FarmingtonPages Ln.Bountiful1100 N.NSL8
Belt Line 2016 Cost VariancesProjectSalt Lake CountyDavis ,209 8,290,000 8,699,837VarianceExplanation(243,628) Re-route of 16” pipe on 300 East resulted in anadditional approximate 1,600’ of pipeinstallation. (166,209) Installation costs higher than anticipated (373,422)
Belt Line PipeOriginal Tracker PipeFootageSalt Lake County178,848Utah County20,242Weber County90,259Davis County80,606Total369,955Miles33.93.817.115.370.1
Belt Line PipeOriginal Tracker PipeFootageSalt Lake County178,848Utah County20,242Weber County90,259Davis County80,606Total369,955Retired Tracker PipeFootageSalt Lake County41,502Utah County15,138Weber County16,169Davis s7.92.93.11.014.8
Belt Line PipeOriginal Tracker PipeFootageSalt Lake County178,848Utah County20,242Weber County90,259Davis County80,606Total369,955Retired Tracker PipeFootageSalt Lake County41,502Utah County15,138Weber County16,169Davis s7.92.93.11.014.8Remaining Tracker PipeFootageMilesSalt Lake County137,34626.0Utah County5,1041.0Weber County74,09014.0Davis County75,20814.2Total291,74855.3
Scheduling Belt Line iderationsReal Property& ROWAcquisitionsRemedialActionsRisk Score PriorityScheduleOther projectspecificconsiderationsScheduling per Section III of the Settlement Stipulation, Docket 13-057-05, Exhibit 5
Project SegmentsMarch 2016 Risk Score PriorityMarch 2017 Risk Score PrioritySegment Priority:Partially Complete Segments20, 28, 15, 16, 27, 17, 9, 7,26, 14, 4, 10, 29, 21, 8, 45,18, 12, 39, 46, 44, 31, 42, 11,6, 53, 40, 37, 38, 22, 36, 41,30, 19, 13, 47, 34, 43, 25, 24,23, 48, 49, 51, 50, 32, 33.Segment Priority:Partially Complete Segments28, 9, 7, 10, 15, 26, 4, 17, 27,20, 14, 29, 21, 8, 45, 39, 12,16, 18, 46, 31, 44, 42, 11, 38,6, 53, 36, 13, 37, 41, 22, 30,47, 19, 34, 24, 23, 43, 40, 49,48, 51, 50, 25, 32, 33.Completed segments:1, 2, 3, 5, 35, 52, 54Completed segments:1, 2, 3, 5, 35, 52, 54 Prioritized by relative risk score
2017 Risk ScorePrioritySegment Priority:28, 9, 7, 10, 15, 26,4, 17, 27, 20, 14,29, 21, 8, 45, 39,12, 16, 18, 46, 31,44, 42, 11, 38, 6,53, 36, 13, 37, 41,22, 30, 47, 19, 34,24, 23, 43, 40, 49,48, 51, 50, 25, 32,33.*2017 segments2017 ScheduleSegments:17 (1700 S, SLC)21 (1300 E, SLC)34 (820 N, Provo)50 & 51 (Davis County)15 & 20 (300 E, SLC)26 & 27 (100 S, SLC)Remedial ActionsSME info-Segment 17Leaking Valve-Segments 26 & 27Shorted ntsLocal GovernmentRequirementsSLC 2018 1300 E roadreconstruction-Segment 21EfficiencyConsiderations2017 FL Replacement- Segments 50, 51BYU HP Line-Segment 34ScheduleReal Property& ROWAcquisitionsOther project-specific considerationsReviewed March 2017 rankings. Revisedproject scheduling for other considerations.
Belt Line 2017 Current 2017 ProjectsSchedule:– Salt Lake County ( 6.97M) 1700 S in SLC (February - May)1300 E in SLC (February – July)300 E in SLC (Summer)100 S in SLC (Summer)– Utah County ( 1.10M) 820 N in Provo (Spring-Fall)– Davis County ( 9.02M) Phase I with FL replacement(January – December)
Belt Line Work 2017Belt Line:1700 S between 700 E & 1300 E in SaltLake City, Salt Lake Co.Construction:February – May 2017Challenges Include:Limited closures and workspaceFootage:4,600 ft.Salt Lake City
Belt Line Work 2017Belt Line:1300 E between 800 S and 1700S in Salt Lake City, Salt Lake Co.Construction:February – July 2017ChallengesInclude:Limited closures and workspace.Heavy traffic.Footage:7,000 ft.SaltLakeCity
Belt Line Work 2017Belt Line:100 S between 700 W and 500 W and500 W between 100 S and 200 S in SaltLake City, Salt Lake Co.Construction:Summer 2017Challenges Include:Running line, limited workspace,pedestrian trafficFootage:2,200 ft.600 W100 S200 S500 WSalt Lake City
Belt Line Work 2017Belt Line:820 N from 700 E to Oakmont Lane in Provo, Utah Co.Construction:June-NovemberChallenges Include: Limited workspace, running line, vehicular andpedestrian trafficFootage:4,000 ft.Provo
Belt Line Work 2017Belt Line:Davis County Beltline Replacement inconjunction with FL21-50replacementConstruction:January – DecemberChallengesInclude:Water table, working over existinglines, permitsFootage:29,000 ft.
Belt Line Work 2017Belt Line:300 E between 800 S and 2100 SaltLake CityConstruction:Summer 2017ChallengesInclude:Limited workspace, pick and relay dueto congested utility corridorFootage:Approx. 3,300 ft.Salt Lake City
High Pressure Replacement HP Replacement Program 2017 Projects Update 2016 Cost Variance Updated HP Replacement Program Evaluation Criteria Scheduling
Feeder Line UpdateI-15FarmingtonFL21-502017: Phase IReplaced by FL122BountifulI-15rerouteWoods CrossNorth Salt LakeLine:21-50Schedule:2017-2020Challenges Include:Water table, working overexisting lines, UDOT permits2017 Budget 45,500,9502017 Footage:54,280 ft.
Feeder Line UpdatePV0004 (tap on FL26)Schedule:2017 pending BYU approvalChallenges Include:Coordination with BYU construction project2017 Budget 400,0002017 Footage:1,400 ft. (to retire)FL26 tap toPV0004900 EBYUReplaced by FL128,Oakmont LnLine:Extension to BYUPV0004820 NTracker-eligibleBYU-reimbursed“Y” trailhead
Feeder Line UpdateLine:FL51Schedule:UnknownChallenges Include:Coordinating construction schedules2017 BudgetUnknown2017 Footage:Road construction by Weber Countywest of 2016 replacement work.FL51Plain CityI-15Hwy 134FL53Far West1150 S4700 WHwy 39Tracker-eligible2016 Project
2016 Cost VarianceProjectFL6BudgetActual 8,500,000 7,372,767FL24 27,300,000 29,039,092FL21(FL117) 17,000,000 16,594,897VarianceExplanation 1,127,233 Retirement and Restoration efforts will becomplete in spring 2017. (1,739,092) Multiple reroutes through Orem and Provoadded extra time and footage. UDOTrequired bore be attempted. Failed borecrossing of a UDOT road. 405,103 Retirement and Restoration efforts will becomplete in spring 2017FL11-FL13 1,250,000 1,774,319FL89 4,000,000 3,350,141 649,859 Retirement and Restoration efforts will becomplete in spring 2017FL51 4,000,000 3,698,440 301,560 Mild winter conditions and minimalrestoration requirements contributed to thisproject being under planned spend. 550,000 500,045 49,955 62,600,000 62,329,702 270,299PreengineeringTotal (524,319) Expanded wetland and difficulty handling anddisposing of ground water.
HP Replacement Risk Evaluation CriteriaRisk Likelihood of Failure (Threat) x Consequence of Failure (Consequence)Likelihood of Failure (LOF)PreviousaConstruction Year (14% )NewConstruction (15%b)Manufacturing (55%b)Pipe/Equipment Condition (24%a)External Corrosion (30%b)Manufacturing – Pipe (14%a)Pressure Test Records (24%a)Reconditioned (24%a)aSME-based weightingbWeighting based on Incident Counts from PHMSA Database
HP Replacement Risk Evaluation CriteriaRisk Likelihood of Failure (Threat) x Consequence of Failure (Consequence)Likelihood of Failure (LOF)PreviousNewYear (14% ) Construction Pre-1955 – High Risk aConstruction (15%b)o Construction Year1955 - 11/1970 – Medium RiskPost 11/1970a – Low Risk Pipe/Equipment Condition (24% )a SMEPre-1948 or unknownPost 1948 through pre-1955Post 1955 through November 1970Post November 1970 and pre-19851985 or latero Construction SME Factoro Leak History from Construction ThreatsManufacturing – Pipe (14%a)Manufacturing (55%b)Pressure Test Records (24%a)External Corrosion (30%b)Reconditioned (24%a)aSME-based weightingbWeighting based on Incident Counts from PHMSA Database
HP Replacement Risk Evaluation CriteriaRisk Likelihood of Failure (Threat) x Consequence of Failure (Consequence)Likelihood of Failure (LOF)Previous Construction Year (14% ) Pipe/Equipment Condition (24% )– Pipe (14% ) Manufacturing Low Freq Electric Resistance Weld – HighaNewConstruction (15%b)Manufacturing (55%b)o Longitudinal Seam Weld Typeaa Electric Flash Weld – HighLongitudinal Seam Weld Factor 1.0 – HighPre-1960 – Medium Risk Double Submerged Arc Weld Submerged Arc WeldPost 1960 – Low Pressure Test Records (24% )Record not found – HighRecord found - Low(24% ) Reconditioned Yes – Higha (Low Freq) Electric Resistance WeldSubmerged Arc WeldedElectric Flash WeldSeamlessContinuous Seam WeldDouble Submerged Arc WeldHigh Frequency Electric Resistance Weld No test history or test less than 1.1 x MAOPTest pressure of at least 1.10x MAOPTest pressure to at least 1.25x MAOPTest pressure to at least 1.50x MAOPTest pressure to 2.00x MAOP or greatero Post-Construction Pressure Testa o Reconditioned Pipe FactorNo – Low YesNoExternal Corrosion (30%b)aSME-based weightingbWeighting based on Incident Counts from PHMSA Database
HP Replacement Risk Evaluation CriteriaRisk Likelihood of Failure (Threat) x Consequence of Failure (Consequence)Likelihood of Failure (LOF)Previous Construction Year (14% ) Pipe/Equipment Condition (24% ) Manufacturing – Pipe (14% ) Pressure Test Records (24% ) Reconditioned (24% )aNewConstruction (15%b)Manufacturing (55%b)ao Manufacturing SME Factoro Leak History from Manufacturing Threatso Operating Stress Level (%SMYS)aaa Below 10%10% to 20%20% to 30%30% to 40%40% or greaterExternal Corrosion (30%b)o TIMP Evaluation (Coating, Age, History, etc.)aSME-based weightingbWeighting based on Incident Counts from PHMSA Database
HP Replacement Risk Evaluation CriteriaRisk Likelihood of Failure (Threat) x Consequence of Failure (Consequence)Consequence of Failure (COF)PreviousHCAs (67%)Census Data (33%)NewPopulation (Safety) (80%)Throughput (Volume) (20%)
HP Replacement Risk Evaluation CriteriaRisk Likelihood of Failure (Threat) x Consequence of Failure (Consequence) Summary of Improvements– Industry expert, Dynamic Risk, developedalgorithms for Questar Gas utilizing currentindustry data and research– PHMSA incident based threat weightings– Data-driven Geographical-information-system (GIS) basedMore parametersImproved utilization of system data– Increased granularity
Feeder Lines Prioritized by HP criteriaPrev. HP Criteria1- FL11-2 and FL11-2A were renamed to FL120.New HP Criteria
Scheduling Feeder Line iderationsReal Property& ROWAcquisitionsRemedialActionsHP CriteriaScheduleOther projectspecificconsiderationsScheduling per Section III of the Settlement Stipulation, Docket 13-057-05, Exhibit 4
HP CriteriaRemedial ActionsPermittingRequirementsLocal City RequirementsEnvironmentalRequirements FL51: AccommodateWeber County roadproject.EfficiencyConsiderations 1- FL11-2 and FL11-2A were renamed to FL120.ScheduleFL26: Coordinatedwith Utah CountyBelt Line.Real Property& ROWAcquisitions2017 Schedule FL26FL21-50FL21-20 (Retire Only)FL51?Other projectspecificconsiderations
2017 ScheduleLineFL26FL21FL51?LocationUtah CountyDavis CountyWeber County
Updated Schedule Original plan had a 2028 completion date.Updated plan has completion date as of 2035.Improved granularity of estimates.Costs higher than anticipated.Company anticipates seeking increase inannual budget in its next general rate case.
QUESTIONS?
Apr 27, 2017 · Belt Line 2017 Current 2017 Projects Schedule: – Salt Lake County ( 6.97M) 1700 S in SLC (February - May) 1300 E in SLC (February – July) 300 E in SLC (Summer) 100 S in SLC (Summer) – Utah County ( 1.10M) 820 N in Provo (Spring-Fall) – Davis County (