Transcription
Mathematical ReasoningLesson 13: Mean, Median, Mode, and RangeLESSON 13: Mean, Median, Mode and RangeWeekly Focus: central tendencyWeekly Skill: computation andreal applicationLesson Summary: First, students will solve a problem about buying carpet. In Activity 1, they will do a vocabularymatching activity. In Activity 2, they will do some examples and computation practice. In Activity 3, they willsolve word problems in the student book. In Activity 4, they will do problems in the workbook. Activity 5 is anapplication about the Super Bowl. There is an exit ticket and extra problem. Estimated time for the lesson is twohours.Materials Needed for Lesson 13: Video (3 minutes): Central Tendency Video. It is required for teachers and optional for students.Activity 1 to print/projectHandout 13.1 of definitions and examples (attached)Worksheet 13.2 on computation (attached)Mathematical Reasoning Test Preparation for the 2014 GED Test Student Book (pages 30-31)Mathematical Reasoning Test Preparation for the 2014 GED Test Workbook (pages 38-41)Worksheet 13.3 on Super Bowl for application activity (attached)Exit ticket (attached)Optional: decks of cards for Activity 2Objectives: Students will be able to: Understand the definitions of measures of central tendency (mean, median, mode)Compute these measuresSolve word problems about mean, median, mode, and rangeSolve real life problems of applicationACES Skills Addressed: N, CT, LS, and ECCCRS Mathematical Practices Addressed: Use appropriate tools strategically, Math Fluency, Building SolutionPathways, Construct viable arguments and critique the reasoning of othersLevels of Knowing Math Addressed: Concrete, Abstract, Communication and ApplicationNotes:You can add more examples if you feel students need them before they work. Any ideas that concretelyrelates to their lives make good examples.For more practice as a class, feel free to choose some of the easier problems from the worksheets to dotogether. The “easier” problems are not necessarily at the beginning of each worksheet. Also, you maydecide to have students complete only part of the worksheets in class and assign the rest as homework orextra practice.The GED Math test is 115 minutes long and includes approximately 46 questions. The questions have a focuson quantitative problem solving (45%) and algebraic problem solving (55%).Students must be able to understand math concepts and apply them to new situations, use logicalreasoning to explain their answers, evaluate and further the reasoning of others, represent real worldD. Legault, Minnesota Literacy Council, 20141
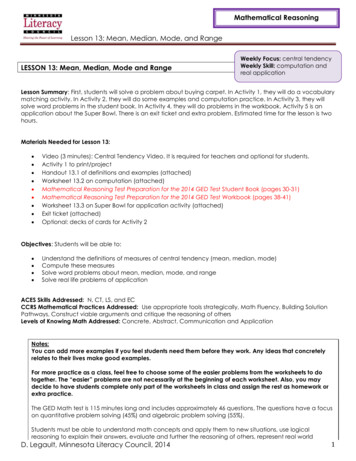
Mathematical ReasoningLesson 13: Mean, Median, Mode, and Rangeproblems algebraically and visually, and manipulate and solve algebraic expressions.This computer-based test includes questions that may be multiple-choice, fill-in-the-blank, choose from adrop-down menu, or drag-and-drop the response from one place to another.The purpose of the GED test is to provide students with the skills necessary to either further their education orbe ready for the demands of today’s careers.Lesson 13 Warm-up: Solve the carpet questionTime: 10 MinutesWrite on the board: Ronda wants to buy carpet for her bedroom. She measures the lengthat 10 feet and the width at 8 feet 6 inches. The carpet is sold in 12-foot-wide rolls.Basic Question: What is the area of the bedroom?o If students convert inches to decimals and just convert 6 inches to 0.6, ask them whythis doesn’t work. Because it’s 6/12, not 6/10, so they have to do equivalent fractionsfirst. Answer: 10 x 8.5 85 square feet.Extension Questions: How many square feet should she buy knowing she’ll have to cut some off one side?o Draw a picture on the board if needed for explanation of where the extra is. She willbuy12 x 8.5 102 square feet She can buy a clearance carpet at 0.89/square foot or she can buy carpet that’s regularlysold at 1.29 a square foot but is now 20% off. Which is a better deal?o Students may figure out the whole 102 square feet price for each. See if anyonefigures out the price for just one square foot, which will give us the information weneed. 1.29 x 0.8 1.03, so the clearance carpet is cheaper.Lesson 13 Activity 1: VocabularyTime: 5 MinutesThis activity (below) can be projected on the board and done as a whole class. Havestudents volunteer to write answers. (Answers: 1d, 2a, 3b, 4f, 5c and 6e)D. Legault, Minnesota Literacy Council, 20142
Mathematical ReasoningLesson 13: Mean, Median, Mode, and RangeLesson 13 Activity 2: M,M,M, and Range ComputationTime: 20-25 Minutes1) Example A: Ask five students how many children they have, and write all the numbers on theboard. Now you can figure out together: Mean: Take all the numbers, add together, and divide by 5, the number of students surveyed.That gives you the average.Mode: Are there two students who have the same number of children (could be zero)? If yes,that’s the mode. If not, there is no mode.Median: Put all five numbers in a row from lowest to greatest. The one in the middle is themedian.Range: Take the difference of the greatest minus the lowest and that is the range.2) Example B: Now ask another student so you have six total. Figure out the mean, the mode (ifthere is one), and the range. What is the median? It’s halfway between the two middlenumbers. (If those are 2 and 3, the median in 2.5, for example)3) Give students Handout 13.1 for more examples.4) Do Worksheet 13.2 for practice. Do the first one together. An alternative to the worksheet is tohave groups of 3-4 students use a deck of cards. Together they pick 4-5 cards and computethe M,M,M and range. Every group would have different answers so the teacher would needto circulate to check.5) Note to teacher: These terms are also known as the “measures of central tendency”. Youmay want to mention this to students in case they see this term elsewhere.Lesson 13 Activity 3: Word ProblemsTime: 15 MinutesHave students work independently in the student book pages 30-31. Circulate to help.Review any questions that students found challenging. Choose a few problems to havestudents volunteer to do on the board and explain if they like.D. Legault, Minnesota Literacy Council, 20143
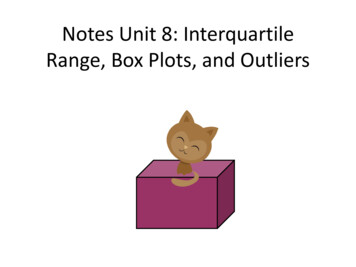
Mathematical ReasoningLesson 13: Mean, Median, Mode, and RangeActivity 1 Vocabulary MatchVocabularyDefinition1. modeA. the average2. meanB. middle number3. medianC. lowest number4. rangeD. most frequently occurring5. minimum6. maximumnumberE. highest numberF. difference between lowestand highest numbersD. Legault, Minnesota Literacy Council, 20144
Mathematical ReasoningLesson 13: Mean, Median, Mode, and RangeHandout 13.1D. Legault, Minnesota Literacy Council, 20145
Mathematical ReasoningLesson 13: Mean, Median, Mode, and RangeD. Legault, Minnesota Literacy Council, 20146
Mathematical ReasoningLesson 13: Mean, Median, Mode, and RangeWorksheet 13.2—ComputationD. Legault, Minnesota Literacy Council, 20147
Mathematical ReasoningLesson 13: Mean, Median, Mode, and RangeWorksheet 13.2—Computation AnswersD. Legault, Minnesota Literacy Council, 20148
Mathematical ReasoningLesson 13: Mean, Median, Mode, and RangeLesson 13 Activity 4: Word ProblemsTime: 20-25 MinutesDo the problems in the workbook pages 38-41. Do some of the challenging ones on theboard.Lesson 13 Activity 5 Application: Super Bowl StatsTime: 20-25 MinutesMean, median, and mode are used when comparing statistics in many areas in our society.Ask students what areas these statistics are used in. They should have lots of ideas after doingthe workbook problems. Some are school, sports, weather, business, housing sales, and workhours.The following activity asks students to figure out the numbers for a popular American event,the Super Bowl. Students may use their calculators to save time since the point is tounderstand how to solve the problems. The activity is from the website yummymath.com.Lesson 13 Exit TicketTime: 5 MinutesThis activity can be done as a class survey/discussion. Ask everyone how many TV sets theyhave in their homes. Then figure out together the mean, median, mode, and range.The numbers are small so it should happen quickly. If there isn’t much time, just ask a fewstudents.Lesson 13 Extra Word Problem on Test ScoresTime: 5-10 MinutesWrite on the board:Shonda met with her son’s English class teacher at parent conferences. The teachertold Shonda that her son got 78, 89, 63, and 82 on his first four tests. There is one test leftand he needs to increase his average to 80% to get a B in the class.Basic Questions: What is her son’s average in English class now? (78 89 63 82 divided by 4 312/4 78%)Is this the mean, the median, or the mode? (mean)D. Legault, Minnesota Literacy Council, 20149
Mathematical ReasoningLesson 13: Mean, Median, Mode, and RangeExtension Question: By what percent does he need to increase his test scores? (2%)Does this mean he needs to get 80% on the last test? (No, 80% is the average of all 5 tests)What does he need to get on the last test to have an 80% average?o This question is challenging, but see if the students can talk it through.o (78 89 63 82 x) 5 80o 312 x 5 80o x 400 – 312 88% on the last testD. Legault, Minnesota Literacy Council, 201410
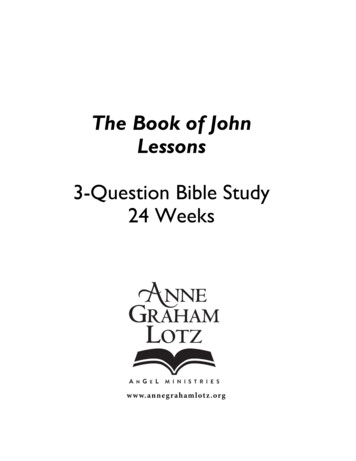
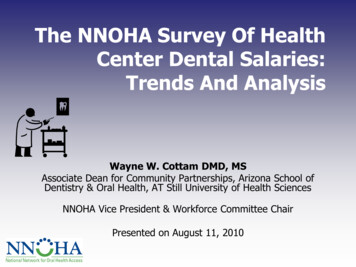
Mathematical ReasoningLesson 13: Mean, Median, Mode, and RangeWorksheet 13.3—Super Bowl ActivityThe Typical Super Bowl Score?NameHow many points will be scored this Super Bowl? Round to the nearest hundredth when necessary.To get a clearer idea lets look at the last twelve Super Bowl XXVIIXXXVIFeb. 3, 2013Feb. 5, 2012Feb. 6, 2011Feb. 7, 2010Feb. 1, 2009Feb. 3, 2008Feb. 4, 2007Feb. 5, 2006Feb. 6, 2005Feb. 1, 2004Jan. 26, 2003Feb. 3, 2002Ravens 34, 49ers 31Giants 21, Patriots 17Packers 31 Pittsburg 25Saints 31 Colts 17Pittsburgh 27 Arizona 23New York 17, New England 14Indianapolis 29, Chicago 17Pittsburgh 21, Seattle 10New England 24, Philadelphia 21New England 32, Carolina 29Tampa Bay 48, Oakland 21New England 20, St. Louis 171. What is the mean score for the winning team in the Super Bowl? Make sure to show or explain your method.2. What is the mean score for the losing team in the Super Bowl? Make sure to show or explain your method.3. By using the mean of the winning and losing scores, what is the mean Super Bowl final score? By how manypoints on average does the winning team beat the losing team by?4. Find the median score of the winning teams in the Super Bowl. Make sure to show or explain your method.5. Find the median score of the losing teams in the Super Bowl. Make sure to show or explain your method.6. By using the median of the winning and losing scores, what is the median Super Bowl final score? Using themedian, by how many points on does the winning team beat the losing team by?7. Now thatyou have usedboth theCouncil,mean and medianD. Legault,MinnesotaLiteracy2014 to explore the typical Super Bowl score, which statisticseems to better represent the data? Why?11
Reasoning4. Find the median score of the winning teams in the Super Bowl. Make sure to Mathematicalshow or explain yourmethod.Lesson 13: Mean, Median, Mode, and Range5. Find the median score of the losing teams in the Super Bowl. Make sure to show or explain your method.Worksheet 13.3 [cont.]—Super Bowl Activity6. By using the median of the winning and losing scores, what is the median Super Bowl final score? Using themedian, by how many points on does the winning team beat the losing team by?7. Now that you have used both the mean and median to explore the typical Super Bowl score, which statisticseems to better represent the data? Why?8. Looking at all scores, winning or losing, is there a mode of the data set? If so, what is it? Knowing what youknow about football, does it make sense that this score would be the mode?9. Another statistic that we have not talked about is the range. Find the range for each:a. Which of the twelve Super Bowls had the greatest range? Which Super Bowl was that and what was therange?b. Find the range of the scores of the winning Super Bowl teams.c. Find the range of the scores of the losing Super Bowl teams.d. Find the range of all of the Super Bowl scores from the data set.10. Next year we will add the 2014 Super Bowl score to this data set. How many points will the 2014 losing teamneed to score so that the new 13 year mean of the losing scores is exactly 20 points? How many points will thewinning teamneed to scoreLiteracyso that theCouncil,13-year meanis exactly 30 points? Show or explain your method.D. Legault,Minnesota201412
XLVIFeb. 5, 2012Giants 21, Patriots 17XLVFeb. 6, 2011Packers 31 Pittsburg 25XLIVFeb. 7, 2010Saints 31 Colts 17XLIIIFeb. 1, 2009Pittsburgh 27 Arizona 23XLIIFeb. 3, 2008New York 17, New England 14XLIFeb. 4, 2007Indianapolis 29, Chicago 17Lesson 13: Mean, Median, Mode, and RangeXLFeb. 5, 2006Pittsburgh 21, Seattle 10XXXIXFeb. 6, 2005New England 24, Philadelphia 21XXXVIIIFeb. 1, 2004New England 32, Carolina 29XXXVIIJan. 26, 2003Tampa Bay 48, Oakland 21Worksheet13.3—SuperBowl ActivityAnswersXXXVIFeb. 3, 2002New England 20, St. Louis 17Mathematical Reasoning1. What is the mean score for the winning team in the Super Bowl? Make sure to show or explain your method.(34 21 31 31 27 17 29 21 24 32 48 20) /12 335 /12 27.922. What is the mean score for the losing team in the Super Bowl? Make sure to show or explain your method.(31 17 25 17 23 14 17 10 21 29 21 17) / 12 242 / 12 20.173. By using the mean of the winning and losing scores, what is the mean Super Bowl final score? By how manypoints on average does the winning team beat the losing team by?Mean of the winning and losing scores (27.92 20.17) / 2 24.05Differences between the winning and losing scores are; 3, 4, 6, 14, 4, 3, 12, 11, 3, 3, 27, 3. The mean ofthose differences if 93/12 7.754. Find the median score of the winning teams in the Super Bowl. Make sure to show or explain your method.172021212427293131323448 winning scores arranged from smallest to largest.So, the median winning score is 27 29 56/2 28.5. Find the median score of the losing teams in the Super Bowl. Make sure to show or explain your method.101417171717212123252931 losing team scores arranged from smallest to largest.So, the median losing score is (17 21)/2 19.6. By using the median of the winning and losing scores, what is the median Super Bowl final score? Using themedian, by how many points on does the winning team beat the losing team by?Maybe the median final Super Bowl score would be the average of 28 and 19 which is 28 19 47/2 23.5. The winning team usually wins by 28 – 19 9 points.7. Now that you have used both the mean and median to explore the typical Super Bowl score, which statisticseems to better represent the data? Why?I’m not sure that either is more representative. The median losing team score is a score that is much closerto the lowest losing score than the highest losing score. There are also 4 losing scores of 17. So the modeis 17 and 19 is pretty close to the mode. The mode of 17 makes the median values weighted more heavilyin the 17 score.8. Looking at all scores, winning or losing, is there a mode of the data set? If so, what is it? Knowing what youknow about football, does it make sense that this score would be the mode?17 appears in the losing scores four times and once in the winning scores. It appears a total of five timesmaking it the only mode.9. Another statistic that we have not talked about is the range. Find the range for each:a. Which of the twelve Super Bowls had the greatest range? Which Super Bowl was that and what was therange?Tampa Bay 48, Oakland 21range 27 pointsSuper Bowl 37 XXXVIIb. Find the range of the scores of the winning Super Bowl teams.17 to 48 31 pointsc. Find the range of the scores of the losing Super Bowl teams.D. Legault, MinnesotaLiteracy10 to 31 21points Council, 201413
If not, there is no mode. Median: Put all five numbers in a row from lowest to greatest. The one in the middle is the median. Range: Take the difference of the greatest minus the lowest and that is the range. 2) Example B: Now ask another student so you have six total. Figure out the mean, the mode

![AANA Update FY2012-ND 3-29-12 [Read-Only]](/img/8/aana-20update-20fy2012-nd-203-29-12-20-5bread-only-5d.jpg)