Transcription
Shimoni et al. Journal of Hematology & Oncology (2016) 9:118DOI 10.1186/s13045-016-0347-1RESEARCHOpen AccessLong-term survival and late events afterallogeneic stem cell transplantation fromHLA-matched siblings for acute myeloidleukemia with myeloablative compared toreduced-intensity conditioning: a report onbehalf of the acute leukemia working partyof European group for blood and marrowtransplantationAvichai Shimoni1*, Myriam Labopin2, Bipin Savani3, Liisa Volin4, Gerhard Ehninger5, Jurgen Kuball6, Donald Bunjes7,Nicolaas Schaap8, Stephane Vigouroux9, Andrea Bacigalupo10, Hendrik Veelken11, Jorge Sierra12, Matthias Eder13,Dietger Niederwieser14, Mohamad Mohty2 and Arnon Nagler1,2AbstractBackground: Myeloablative (MAC) and reduced-intensity conditioning (RIC) are established approaches forallogeneic stem cell transplantation (SCT) in acute myeloid leukemia (AML). Most deaths after MAC occur within thefirst 2 years after SCT, while patients surviving leukemia-free for 2 years can expect a favorable long-term outcome.However, there is paucity of data on the long-term outcome (beyond 10 years) and the pattern of late eventsfollowing RIC due to the relative recent introduction of this approach.Methods: We analyzed long-term outcomes in a cohort of 1423 AML patients, age 50 years, after SCT fromHLA-matched siblings, during the years 1997–2005, median follow-up 8.3 years (0.1–17).Results: The 10-year leukemia-free survival (LFS) was 31 % (95CI, 27–35) and 32 % (28–35) after MAC and RIC,respectively (P 0.57). The 10-year GVHD/ relapse-free survival (GRFS), a surrogate for quality of life was 22 % (18–25)and 21 % (18–24), respectively (P 0.79). The 10-year non-relapse mortality (NRM) was higher and relapse rate waslower after MAC, throughout the early and late post-transplant course. The 10-year LFS among 584 patients survivingleukemia-free 2 years after SCT was 71 % (65–76) and 73 % (67–78) after MAC and RIC, respectively (P 0.76). Advancedleukemia at SCT was the major predictor of LFS subsequent to the 2-year landmark. Relapse was the major cause oflate death after both regimens; however, NRM and in particular chronic graft-versus-host disease and second cancerswere more common causes of late death after MAC.(Continued on next page)* Correspondence: ashimoni@sheba.health.gov.il1Department of Bone Marrow Transplantation, Chaim Sheba Medical Center,Tel HaShomer and Tel-Aviv University, Tel Aviv, IsraelFull list of author information is available at the end of the article The Author(s). 2016 Open Access This article is distributed under the terms of the Creative Commons Attribution 4.0International License (http://creativecommons.org/licenses/by/4.0/), which permits unrestricted use, distribution, andreproduction in any medium, provided you give appropriate credit to the original author(s) and the source, provide a link tothe Creative Commons license, and indicate if changes were made. The Creative Commons Public Domain Dedication o/1.0/) applies to the data made available in this article, unless otherwise stated.
Shimoni et al. Journal of Hematology & Oncology (2016) 9:118Page 2 of 10(Continued from previous page)Conclusions: Long-term LFS and GRFS are similar after RIC and MAC. Most events after RIC or MAC occur within thefirst 2 years after SCT. Patients who are leukemia-free 2 years after SCT can expect similar good subsequent outcomeafter both approaches.Keywords: Acute myeloid leukemia, Allogeneic stem cell transplantation, Myeloablative conditioning, Reduced-intensityconditioning, Long-term outcomeBackgroundAllogeneic hematopoietic stem cell transplantation(SCT) is a potentially curative approach in patients withacute myeloid leukemia (AML). Substantial improvementhas been achieved in the last decades in SCT outcomesowing to improved supportive care and transplantationtechniques and a larger proportion of SCT recipients arebecoming long-term survivors [1].Reduced-intensity conditioning (RIC) has been widelyintroduced over the past 15 years to allow SCT in elderlyand medically infirm patients not eligible for standardmyeloablative conditioning (MAC) [2]. Several studies haveshown similar survival of AML patients after SCT with RICor MAC [3–9]. Most of these studies have shown that RICis associated with reduced non-relapse mortality (NRM)but increased relapse rate, resulting in a similar leukemiafree survival (LFS) as MAC. However, due to the morerecent introduction of RIC, there is paucity of data on thelong-term outcome (beyond 10 years) after RIC.Most deaths after SCT occur within the first 2 years[10]. Long-term survivors remain at increased risk for latecomplications and late morbidity and mortality that ishigher than their sibling donors or the age- and gendermatched general population [11–13]. In the largest studyof long-term survivors, the Center of International Bloodand Marrow Transplantation Research (CIBMTR) hasshown that the probability of patients who were alive anddisease-free at 2 years after SCT to remain alive 10 yearsafter SCT was 85 % (84 % among patients with AML)[13]. Relapse was the most common cause of late death,but chronic graft-versus-host disease (GVHD), infections,organ toxicity and second cancers were also importantcauses of late mortality. These observations were limitedto MAC recipients, and there is, similarly, paucity of dataon the kinetics of late events after RIC and the expectedoutcomes of 2-year survivors after RIC.In this study, we show that 10-year survival is similarafter RIC and MAC, and that 2-year survivors after RICcan expect a similarly favorable outcome as 2-year survivorsafter MAC.MethodsStudy design and data collectionThis is a retrospective multicenter analysis. Data were provided and approved for this study by the acute leukemiaworking party (ALWP) of the European Group for Bloodand Marrow Transplantation (EBMT). Eligibility criteriaincluded age 50 years, de novo AML in any diseasestatus at SCT, transplants from HLA-compatible siblingdonors between 1997 and 2005 with bone marrow (BM) orgranulocyte colony-stimulating factor (G-CSF)-mobilizedperipheral blood stem cells (PBSC) after MAC or RIC. Patients given unrelated or alternative donor grafts were notincluded. Variables collected included recipient and donorcharacteristics, disease features, transplant related factorsincluding drugs and total doses used in the conditioningregimen, and outcome variables.Conditioning regimensThe conditioning regimen was selected according to theparticipating center discretion. Dose intensity was definedaccording to EBMT criteria based on the reversibility andexpected duration of cytopenia after SCT [3]. MACconsisted of high-dose cyclophosphamide and high-dosebusulfan (BuCy) or total body irradiation (TBI). Reducedtoxicity myeloablative regimens consisted of a combination of fludarabine and myeloablative dose of analkylating agent (such as intravenous busulfan at a totaldose 9.6 mg/kg, melphalan 140 mg/m2, treosulfan 36g/m2) were included with MAC. RIC consisted of fludarabine combined with reduced dose alkylating agent (suchas busulfan 9.6 mg/kg) or low-dose TBI ( 8 Gy). GVHDprophylaxis consisted of cyclosporine A and a shortcourse of methotrexate in most patients. In vivo T celldepletion with anti-thymocyte globulin (ATG) or alemtuzumab was allowed according to the participating centerpolicy.Evaluation of outcomesDisease relapse was defined according to standardhematological criteria. NRM was defined as death of anycause in the absence of prior disease recurrence. LFSwas defined as survival without relapse. Overall survival(OS) was calculated from the day of SCT until death ofany cause or last follow-up. GVHD-free relapse-freesurvival (GRFS) was defined by the first of the followingevent: acute GVHD grades III-IV, extensive chronicGVHD, relapse or death [14]. Patients with no eventwere censored at last contact. The cause of death wascategorized according to standard criteria. The cause of
Shimoni et al. Journal of Hematology & Oncology (2016) 9:118death of patients who experienced relapsed disease atany time prior to death was considered relapse-related.Death in patients with active GVHD was defined asGVHD-related even if directly related to other cause.Statistical analysisThe primary end point of the study was 10-year LFS. Secondary endpoints included NRM, relapse incidence (RI),OS, acute and chronic GVHD, and GRFS. Cumulative incidence functions (CIF) were used to estimate RI and NRMin a competing risks setting, with death and relapse considered as competing events with each other [15]. In the analysis of chronic GVHD, relapse and death were consideredto be competing events. The probabilities of LFS, OS, andGRFS were calculated using the Kaplan–Meier estimates.The two regimen intensity groups were compared by thechi-square method for qualitative variables, and Mann–Whitney test for continuous parameters. Log-rank test wasused for examining the difference in survivor curves forLFS, OS, and GRFS. Gray test was uses to analyze thedifference in cumulative incidence curves for RI and NRM.The variables considered were patient age at transplantation, recipient gender, female donor to male recipient,cytogenetics risk group, status at transplantation (CR1,CR2/3 and active disease), source of stem cells (PB vs. BM),donor/recipient CMV seropositivity, in vivo T cell depletion, and year of transplantation. Multivariable analyseswere performed using Cox proportional hazards model forLFS and Fine-Gray model for RI and NRM [16]. For allprognostic analyses, continuous variables were categorizedand the median used as a cut-off point. All interactionsbetween conditioning and other variables were studied.Landmark analysis was performed in order to evaluate theimpact of prognostic variables on the outcome of patientsalive and with no relapse at 2 years after SCT [17]. Prognostic factors for assessment of outcomes subsequent to thelandmark time-point were assessed using similar methods.Statistical analyses were performed with SPSS 19.0 (Inc.,Chicago) and R2.14.2 software packages (R DevelopmentCore Team, Vienna, Austria).ResultsPage 3 of 10Table 1 Patient characteristicsMAC(n 701)RIC(n 722)P valueAge (median, years)54 (50–72)57 (50–75) 0.0001Gender (male)381 (54 %)395 (55 %)0.89F M157 (23 %)193 (27 %)0.0531 (8 %)43 (8 %)0.19CytogeneticsGoodIntermediate316 (77 %)393 (72 %)Poor66 (16 %)112 (20 %)Missing288174Status at SCTCR1443 (63 %)450 (62 %)CR284 (12 %)122 (17 %)Advanced174 (25 %)150 (21 %)Stem cell source(PBSC)515 (73 %)665 (92 %) 0.0001239 (33 %) 0.0001In vivo T cell depletion 81 (12 %)ATG55 (8 %)172 (24 %)Alemtuzumab0.0126 (4 %)67 (9 %)Patient CMV 336 (66 %)452 (73 %)0.02Donor CMV 284 (58 %)398 (65 %)0.009Year of SCT(median, range)2002 (1997–2005) 2003 (1997–2005) 0.0001Abbreviations: MAC myeloablative conditioning, RIC reduced-intensity conditioning,F M female donor to male recipient, SCT stem cell transplantation, PBSCperipheral blood stem cell, ATG anti-thymocyte globulinthymoglobulin at 2.5–10 mg/kg) or alemtuzumab. RICrecipients were more likely to receive PBSC rather thanBM (92 vs. 73 %, P 0.0001) and in vivo T cell depletion(33 vs. 12 %, P 0.0001). Twenty percent of MACrecipients and 16 % of RIC recipients had poor-riskcytogenetics, respectively (P 0.19). The median year oftransplant for patients in the MAC group was 2002(range, 1997–2005) while patients in the RIC group weretransplanted more recently, median year 2003 (range,1997–2005, P 0.0001). The median follow-up was8.7 years (range, 0.1–17.0) and 8.1 years (range, 0.1–14.9),respectively.Patient characteristicsPatient, disease and transplant characteristics are outlinein Table 1. A total of 1423 patients were included in theanalysis; 701 patients had MAC and 722 had RIC, respectively. The median age at SCT was 54 years (50–72)and 57 years (range, 50–75), respectively (P 0.0001).Twenty-five percent of MAC recipients had advanceddisease at SCT compared with 21 % of RIC recipients.The percentage of patients in CR1 and CR2/ later CRwas 63 and 12 % after MAC and 62 and 17 % after RIC,respectively (P 0.01). In vivo T cell depletion includedATG (either Fresenius at a total dose of 15–60 mg/kg orNon-relapse mortality and chronic GVHDThe 10-year NRM was 35 % (95 % CI, 31–39) and 20 %(95 % CI, 17–24) after MAC and RIC, respectively(P 0.0001). Multivariate analysis identified RIC (hazardratio (HR) 0.56, P 0.00001), age 55 years (HR 1.5,P 0.004), advanced disease (HR 1.6, P 0.02), andtransplantation from female donor to male recipient(HR 1.4, P 0.01) as factors predicting NRM (Table 2).Chronic GVHD occurred in 40 and 43 %, respectively(P 0.19). The factors predicting for chronic GVHDthat may govern quality of life after SCT were in vivo
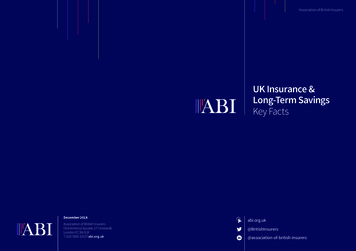
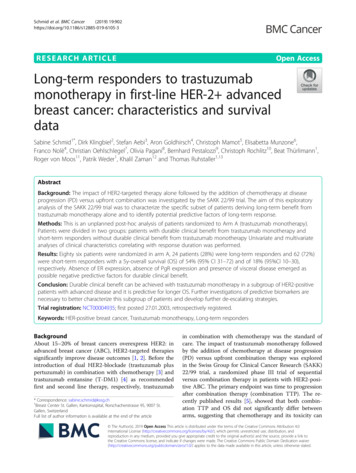
Shimoni et al. Journal of Hematology & Oncology (2016) 9:118Page 4 of 10Table 2 Multivariate analysis of pre-transplant factors predicting for NRM, relapse, and chronic GVHDNRMRelapseChronic GVHDFactorHR(95 % CI)P valueHR(95 % CI)P valueHR(95 % CI)P valueRIC vs. 9(0.95–1.49)0.12CR2 vs. 0(0.82–1.46)0.53Advanced vs. CR11.61(1.19–2.17)0.0022.71(2.17–3.38) 0.000011.42(1.08–1.85)0.01In vivo T cell 10.62(0.49–0.80)0.0002Age 55 1.00(0.82–1.23)0.99F 89–1.38)0.37Intermediate vs. (0.53–1.11)0.16Poor vs. 7(0.96–2.91)0.070.78(0.51–1.21)0.27Year of 0.97–1.06)0.58Patient CMV 0–1.23)0.95Donor CMV 0–1.21)0.87PBSC vs. .08–1.95)0.01CytogeneticsAbbreviations: as in Table 1. NRM non-relapse mortality, BM bone marrowT cell depletion (HR 0.62, P 0.0002), advanced disease (HR 1.4, P 0.01), and PBSC transplantation (HR1.45, P 0.01) but not the conditioning regimen used.RelapseThe 10-year relapse incidence was 34 % (95 % CI, 31–38)and 48 % (95 % CI, 44–52) after MAC and RIC, respectively (P 0.0001). However, after adjusting for multiplevariables RIC was no longer associated with increasedrelapse risk (HR 1.2, P 0.13, Table 2). Relapse waspredicted by SCT at CR2/later CR (HR 1.7, P 0.0004)or advanced disease (HR 2.7, P 0.00001), in vivo Tcell depletion (HR 1.4, P 0.01), age 55 years (HR 1.5,P 0.0004), and poor cytogenetics (HR 3.4, P 0.0002)(Table 2).LFS, OS, and GRFSThe 10-year LFS was 31 % (95 % CI, 27–35) and 32 %(95 % CI, 28–35) after MAC and RIC, respectively(P 0.57). LFS was similar after MAC and RIC in patientsage 50–55 years, been 36 % (95 % CI, 32–41) and 40 %(95 % CI, 33–46), respectively (P 0.32). However, therewas an advantage for RIC in patients age 55 years, 28 %(95 % CI, 24–32) and 20 % (95 % CI, 14–26), respectively(Fig. 1, P 0.02). RIC was also associated with anadvantage in LFS in patients with good risk cytogenetics,but LFS was similar in the different subsets according todisease status at SCT. In all, multivariable analysisidentified SCT at CR2/later CR (HR 1.5, P 0.0001) oradvanced disease (HR 2.2, P 0.00001), age 55 years(HR 1.4, P 0.00001), and poor cytogenetics (HR 1.7,P 0.005) as factors predicting for LFS (Table 3).The 10-year OS was 33 % (95 % CI, 29–37) and35 % (95 % CI, 32–39) after MAC and RIC, respectively (P 0.57). Multivariable analysis identified SCT atCR2/later CR (HR 1.6, P 0.0004) or advanced disease(HR 2.2, P 0.00001), age 55 years (HR 1.5, P 0.00001)and poor cytogenetics (HR 1.5, P 0.04) as factors associated with reduced OS. RIC was associated with a better10-year OS (HR 0.8, P 0.01).The 10-year GRFS, a surrogate for quality of life was22 % (18–25) and 21 % (18–24), after MAC and RIC, respectively (P 0.79). Multivariable analysis identifiedSCT at CR2/later CR (HR 1.4, P 0.0008) or advanced
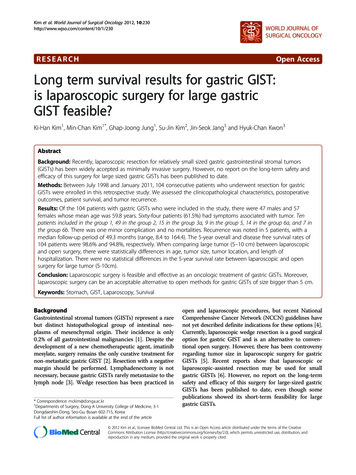
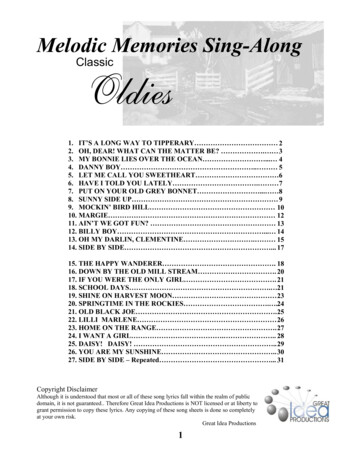
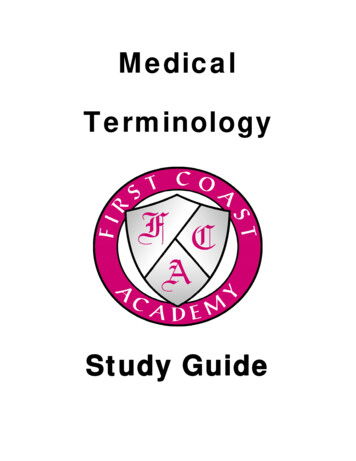
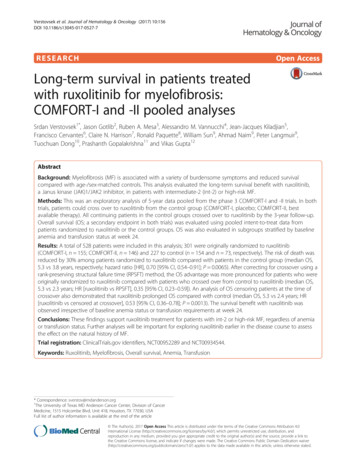
Shimoni et al. Journal of Hematology & Oncology (2016) 9:118Page 5 of 10Fig. 1 Overall survival after allogeneic stem cell transplantation in patients age 50–55 years (a) or 55 years (b)disease (HR 2.0 P 0.00001), age 55 years (HR 1.3,P 0.002) and poor cytogenetics (HR 1.6, P 0.01) asfactors associated with reduced GRFS. In vivo T celldepletion was associated with improved GRFS (HR0.8, P 0.04). RIC and MAC were associated withsimilar GRFS (Table 3). There was no difference in LFS,OS or GRFS according to the agent used for in vivo T celldepletion (ATG or alemtuzumab). In the global population there was a lower incidence of acute GVHD afteralemtuzumab compared to ATG, but there was no difference in the incidence of chronic GVHD or NRM.Landmark analysisFive hundred and eighty-four patients were alive andleukemia-free 2 years after SCT, 287 after MAC and 297after RIC. The 10-year LFS of patients surviving leukemiafree at the 2-year landmark was 71 % (65–76) and 73 %(67–78), respectively (Fig. 2a, global P 0.76). Multivariateanalysis identified advanced disease at SCT (HR 1.9,P 0.01) and female donor to male recipient (HR 1.5,P 0.04) as independent factors predicting LFS. Theconditioning regimen, age, cytogenetics and priorchronic GVHD were not significant (Table 4). The10-year overall survival (OS) was 73 % (67–78) and74 % (69–80), respectively (Fig. 2b, global P 0.81).Advanced disease was the only predicting factor inmultivariate analysis (HR 2.0, P 0.01).Table 5 outlines the causes of late deaths by theregimen and time after SCT. There were 86 late deathsafter MAC, 53 of them 2–5 years after SCT and 33beyond 5 years. Ninety-seven deaths occurred after RIC,67 of them 2–5 years after SCT and 30 beyond 5 years.Relapse was the leading cause of late death after bothregimens. It was the cause of 72 and 87 % of deaths 2–5years after MAC and RIC, respectively (P 0.06), and42 and 83 % of deaths beyond 5 years, respectively(P 0.006). In all, the 10-year relapse rate was 14 %(10–19) and 19 % (14–24), respectively (Fig. 3a, P 0.12).Multivariate analysis identified disease status at SCT(P 0.02) and poor cytogenetics (P 0.04) as factorspredicting for late relapse. The regimen used was not predictive. Prior chronic GVHD was no longer protectiveagainst relapse in patients reaching the 2-year landmarkleukemia-free. NRM was the cause of 28 and 13 % ofdeaths 2–5 years after MAC and RIC, and 58 and 17 % ofdeaths beyond 5 years, respectively. In particular, GVHDwas the cause of 14 and 6 % of late deaths afterMAC and RIC (P 0.08) while second cancers werethe cause of 12 and 2 %, respectively (P 0.01). In all,the 10-year late NRM rate was 15 % (11–20) and 9 %(6–13), respectively (Fig. 3b, P 0.03). Multivariateanalysis identified RIC (HR 0.4, P 0.006), advanceddisease at SCT (HR 2.3, P 0.03), age 55 years (HR1.8, P 0.07), and chronic GVHD (HR 2.0, P 0.03)as factors predicting for late NRM.In patients surviving leukemia-free 5 years after SCT,the subsequent NRM was 9 and 4 % after MAC andRIC, respectively (P 0.06). Subsequent relapse ratewere 5 and 6 % (P 0.53), and LFS was 86 and 90 %,respectively (P 0.27).DiscussionThe current study shows that with long-term follow-upLFS is similar after allogeneic SCT from HLA- matchedsiblings with RIC and MAC in patients with AMLage 50 years. The role of dose intensity in SCT conditioning for AML has been explored in multipleretrospective studies [18] (reviewed in 18). Most studies have shown that more intensive regimens controlleukemia better, but LFS is not improved due to
Shimoni et al. Journal of Hematology & Oncology (2016) 9:118Page 6 of 10Table 3 Multivariate analysis of pre-transplant factors predicting for LFS, OS, and GRFSLFSOSGRFSFactorHR(95 % CI)P valueHR(95 % CI)P valueHR(95 % CI)P valueRIC vs. 0.87–1.20)0.75CR2 vs. 1.42(1.16–1.74)0.0008Advanced vs. CR12.22(1.86–2.66) 0.000012.24(1.87–2.68) 0.000011.95(1.64–2.31) 0.00001In vivo T cell 10.84(0.71–0.99)0.04Age 55 years1.44(1.22–1.69) 0.000011.52(1.29–1.80) 0.000011.27(1.09–1.47)0.002F 97–1.33)0.10Intermediate vs. (0.79–1.47)0.63Poor vs (0.72–1.55)0.771.24(0.88–1.74)0.22Year of 0.94–1.00)0.08Patient CMV 3–1.15)0.77Donor CMV 5–1.15)0.90PBSC vs. .86–1.27)0.64CytogeneticsAbbreviations: as in Tables 1 and 2. LFS leukemia-free survival, OS overall survival, GRFS GVHD-free relapse-free survivalFig. 2 Subsequent outcomes of patients who were leukemia-free 2 years after stem cell transplantation. Overall survival (a). Leukemia-freesurvival (b)
Shimoni et al. Journal of Hematology & Oncology (2016) 9:118Page 7 of 10Table 4 Multivariate analysis of factors predicting for transplantation outcomes in patients surviving leukemia-free 2 years aftertransplantationNRMRelapseLFSFactorHR(95 % CI)P valueHR(95 % CI)P valueHR(95 % CI)P valueRIC vs. (0.49–1.19)0.24CR2 vs. (0.89–2.70)0.12Advanced vs. 1.14–3.21)0.01In vivo T cell 31.17(0.74–1.86)0.49Age 55 7(0.92–2.04)0.12F 02–2.29)0.04Intermediate vs. 3(0.62–3.30)0.40Poor vs. (0.69–44.58)0.111.14(0.45–2.87)0.79Year of 0.93–1.12)0.67Patient CMV 5–1.47)0.90Donor CMV 0–1.32)0.56PBSC vs. .55–1.59)0.81Chronic GVHD before 2 5(0.78–1.70)0.47CytogeneticsAbbreviations: as in Tables 1, 2 and 3remained with long-term follow-up. The 10-year LFS was31 % (95 % CI, 27–35) and 32 % (95 % CI, 28–35) afterMAC and RIC, respectively (P 0.57). In addition, theGRFS, which is a surrogate for quality of life analysis, wassimilar between the two regimens. Several retrospectiveanalyses and meta-analyses supported these observations[4–9]. Luger et al. reported in the largest such comparisonfrom CIBMTR, including 3731 MAC and 1448 RIC/excess NRM. In a prior report the ALWP of EBMThas shown in a comparison of 315 RIC and 407MAC recipients, age 50 years, that NRM was lower withRIC, relapse was higher, resulting in similar 2-year LFS[3]. The current analysis includes the same group, extended with data accumulating from more patients, transplanted during the same period, now followed for almost10 years. It shows that these shorter-term observationsTable 5 Causes of late death by conditioning regimen and time after transplantationMACRIC2–5 years5–10 years 10 years2–5 years5–10 years 10 yearsInfection240210GVHD831411Second malignancy145111Other NRM411200Relapse3814058232Abbreviations: as in Tables 1, 2, 3, and 4. Early causes of death (before 2 years) are not listed
Shimoni et al. Journal of Hematology & Oncology (2016) 9:118Page 8 of 10Fig. 3 Subsequent outcomes of patients who were leukemia-free 2 years after stem cell transplantation. Relapse incidence (a) and non-relapsemortality (b)nonmyeloablative (NMA) recipients, that the 5-year OSrates were 34, 33, and 26 % after MAC, RIC, and NMAconditioning, respectively [5]. OS was similar after RICand MAC but inferior after NMA. However, in this studyNRM was lower after RIC only in the early post SCTperiod. By 3 years, late NRM negated this early advantageand NRM rates became equivalent. In the current analysis,NRM rate was lower after RIC throughout the posttransplant course up to 10 years after SCT. This is possibly explained by the selection of patient age 50 years inthis analysis, compared to all adult patients in theCIBMTR study. Thus, the median age of MAC recipientswas 54 and 42 years in the different studies respectively,while the median age of RIC recipients was similar. OlderMAC recipients may be more prone to NRM in the latepost SCT period than younger recipients. Advanced age isa predictor of NRM in many of these studies. Historically,only younger patients ( 35–40) benefited from SCT withMAC in CR1 compared with chemotherapy, due toexcess NRM [19]. However, RIC has extended thebenefit to older patients [20, 21]. In the current analysis, RIC was associated with better long-term LFSthan MAC in patients age 55 years.However, all these analyses may be associated with aselection bias. Several randomized comparisons havebeen reported over the last years. Bornhauser et al. randomized patients with AML in CR1 to standard MAC(with 12Gy TBI) or RIC with an intermediate dose ofTBI (total 8Gy) [22]. The 3-year LFS was similar amongthe regimens. The GITTMO group randomized patientsto BuCy versus fludarabine and high-dose busulfan(FB4) [23]. NRM was reduced with the FB4 regimen butLFS was similar. It should be noted that the RIC arms inboth these studies would be considered MAC accordingto the registry criteria used in the current analysis. Theseregimens are better defined as reduced-toxicity myeloablative regimens (RTC). Scott et al. randomized patientsto conventional RIC versus MAC [24]. The study wasstopped early as relapse rates were markedly higher inthe RIC group. The reduction in NRM was not sufficientto compensate for this elevated risk and LFS was higherafter MAC. The conclusion from these randomizedstudies is that MAC is still the standard regimen foryounger patients. RIC can be a suitable alternative inpatients who are older or those not eligible for MAC.The new RTC regimens may prove to be as effective butsafer regimens that may ultimately replace MAC andmay even be acceptable in MAC-ineligible patients.Patients seek consultation regarding their prognosisnot only prior to SCT but also as time elapses afterwards. Many of the clinical factors predictive of LFS inthe early post-transplant period are no longer predictivelater on as the risk for early events declines. Most eventsafter MAC occur within the first 2 years [10]. In thelargest study of long-term survival including 10,632patients reported to the CIBMTR as having been aliveand disease-free at the 2 year time-point, the probabilityof remaining alive at the 10-year time-point was 85 %[12]. Older age and chronic GVHD were the main riskfactors in the entire population, while advanced diseaseat SCT was an additional risk factor in patients withleukemia. Relapse and NRM occurred in 10 and 9 % ofAML patients surviving alive and disease-free 2 yearsafter SCT. The CIBMTR has also designed an online calculator for estimation of subsequent LFS [25]. However,these data apply only to MAC, and data regarding thekinetics of post RIC events are scarce. The currentanalysis shows that most events after RIC also occur inthe first 2 years. The 10-year OS of patients alive anddisease-free 2 years after SCT was 73 and 74 % after
Shimoni et al. Journal of Hematology & Oncology (2016) 9:118MAC and RIC, respectively, with advanced disease atSCT been the major prognostic factor. These rates aremildly lower than those reported in the CIBMTR study;however, in that study, the median age of AML patientswas 28, with only 6 % over age 50 years, while allpatients included in this analysis are over 50 years.These data can serve to reassure patients given RIC atthe 2 year time-point that their subsequent survival is favorable and not significantly different than among those givenMAC. However, the causes of subsequent deaths are somewhat different between RIC and MAC. While relapse is themajor cause of late death in both, it is a more prominentcause of death after RIC. Chronic GVHD and second cancers are more prominent causes of late death after MAC.Second cancers are the cause of 5–10 % of late mortalityafter MAC [11]. Data of the incidence of second cancersafter RIC are limited as extended follow-up is required. In asingle center report from the Tel HaShomer group, the10-year incidence of second cancers was 1.7 % after MAC,7.4 % after RIC and 5.7 % after fludarabine-based RTC regimens [26]. After adjusting for patient characteristics, it wasshown that the incidence of second cancers is not reducedin the RIC/RTC era. A larger CIBMTR study found thatthe overall risk of second cancers is reduced after NMA/RIC although there was an increase of cancers of specificsites such as head and neck. Among patients aged 40–60years with MDS and AML, there was no difference betweenRIC/NMA and MAC [27]. In the current report, death dueto second cancers was more frequent after MAC. The TelHaShomer study speculated that fludarabine may have animportant role in the pathogenesis of second cancers.Fludarabine-based RTC regimens were included with MACin the CIBMTR and current EBMT reports. The currentanalysis is only on deaths and among older patients whichmay also explain part of these differences. The surveillancefor second cancers remains an important task in long-termpatient education and follow-up [28].This study has several limitations. This is a retrospective analysis that compared two not well-matchedcohorts. However, the retrospective design of this studywas the only wa
free survival (LFS) as MAC. However, due to the more recent introduction of RIC, there is paucity of data on the long-term outcome (beyond 10 years) after RIC. Most deaths after SCT occur within the first 2 years [10]. Long-term survivors remain at increased risk for la