Transcription
Lecture 2: DescriptiveStatistics and ExploratoryData Analysis
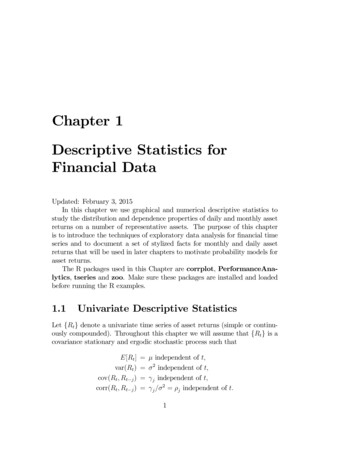
Further Thoughts on Experimental Design 16 Individuals (8 each from two populations) with replicatesPop 1Pop 2Randomly sample 4 individuals from each popTissue culture and RNA extractionLabeling and array hybridizationSlide scanning and data acquisitionRepeat 2 times processing 16 samples in totalRepeat entire process producing 2 technicalreplicates for all 16 samples
Other Business Course urses/akey/56008/index.htm Homework due on Thursday not Tuesday Make sure you look at HW1 soon and seeeither Shameek or myself with questions
Today What is descriptive statistics and exploratorydata analysis? Basic numerical summaries of data Basic graphical summaries of data How to use R for calculating descriptive statisticsand making graphs
“Central Dogma” of csSampleInferential Statistics
EDABefore making inferences from data it is essential toexamine all your variables.Why?To listen to the data:- to catch mistakes- to see patterns in the data- to find violations of statistical assumptions- to generate hypotheses and because if you don’t, you will have trouble later
Types of cretecontinuous2 categoriesmore categoriesorder mattersnumericaluninterrupted
Dimensionality of Data Sets Univariate: Measurement made on one variable persubject Bivariate:Measurement made on two variables persubject Multivariate: Measurement made on many variablesper subject
Numerical Summaries of Data Central Tendency measures. They are computedto give a “center” around which the measurements inthe data are distributed. Variation or Variability measures. They describe“data spread” or how far away the measurements arefrom the center. Relative Standing measures. They describe therelative position of specific measurements in the data.
Location: Mean1. The MeanTo calculate the average x of a set of observations, add theirvalue and divide by the number of observations:nx1 x 2 x 3 . x n 1x " xinn i 1!
Other Types of MeansTrimmed:Weighted means:n"w xix ii 1n"wx "ii 1!Geometric:#&x %" x i ( i 1 'n!!1nHarmonic:x !nn1"xi 1 i
Location: Median Median – the exact middle value Calculation:- If there are an odd number of observations, find the middle value- If there are an even number of observations, find the middle twovalues and average them ExampleSome data:Age of participants: 17 19 21 22 23 23 23 38Median (22 23)/2 22.5
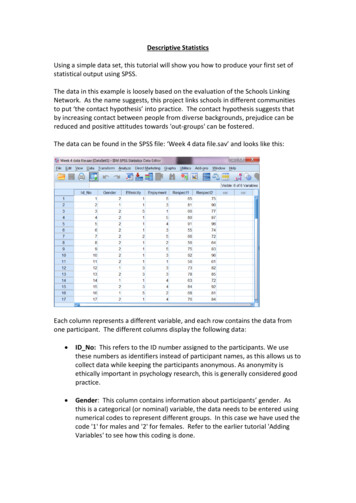
Which Location Measure Is Best? Mean is best for symmetric distributions without outliers Median is useful for skewed distributions or data withoutliers0 1 2 3 4 5 6 7 8 9 100 1 2 3 4 5 6 7 8 9 10Mean 3Mean 4Median 3Median 3
Scale: Variance Average of squared deviations of values fromthe meann2ˆ" ! (xi# x)in #12
Why Squared Deviations? Adding deviations will yield a sum of ? Absolute values do not have nice mathematicalproperties Squares eliminate the negatives Result:– Increasing contribution to the variance as you gofarther from the mean.
Scale: Standard Deviation Variance is somewhat arbitrary What does it mean to have a variance of 10.8? Or2.2? Or 1459.092? Or 0.000001? Nothing. But if you could “standardize” that value,you could talk about any variance (i.e. deviation) inequivalent terms Standard deviations are simply the square root of thevariance
Scale: Standard Deviationn"ˆ 2(x#x) iin #11. Score (in the units that are meaningful)2. Mean!3. Each score’s deviation from the mean4. Square that deviation5. Sum all the squared deviations (Sum of Squares)6. Divide by n-17. Square root – now the value is in the units we started with!!!
Interesting Theoretical Result Regardless of how the data are distributed, a certainpercentage of values must fall within k standard deviationsfrom the mean:Note use of µ (mu) torepresent “mean”.At leastNote use of σ (sigma) torepresent “standard deviation.”within(1 - 1/12) 0% . . k 1 (μ 1σ)(1 - 1/22) 75% . k 2 (μ 2σ)(1 - 1/32) 89% .k 3 (μ 3σ)
Often We Can Do BetterFor many lists of observations – especially if their histogram is bell-shaped1. Roughly 68% of the observations in the list lie within 1 standarddeviation of the average2. 95% of the observations lie within 2 standard deviations of theaverageAve-2s.d.Ave-s.d.Average68%95%Ave s.d.Ave 2s.d.
Scale: Quartiles and IQRIQR25%Q125%25%Q225%Q3 The first quartile, Q1, is the value for which 25% of theobservations are smaller and 75% are larger Q2 is the same as the median (50% are smaller, 50% arelarger) Only 25% of the observations are greater than the thirdquartile
Percentiles (aka Quantiles)In general the nth percentile is a value such that n% of theobservations fall at or below or itn%Q1 25th percentileMedian 50th percentileQ2 75th percentile
Graphical Summaries of DataA (Good) Picture IsWorth A 1,000 Words
Univariate Data: Histograms andBar Plots What’s the difference between a histogram and bar plot?Bar plot Used for categorical variables to show frequency or proportion ineach category. Translate the data from frequency tables into a pictorialrepresentation Histogram Used to visualize distribution (shape, center, range, variation) ofcontinuous variables “Bin size” important
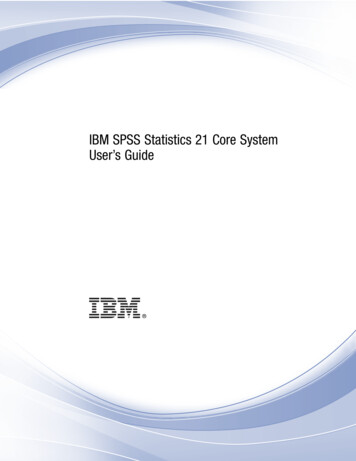
Effect of Bin Size on HistogramFrequencyFrequencyFrequency Simulated 1000 N(0,1) and 500 N(1,1)
More on Histograms What’s the difference between a frequency histogramand a density histogram?
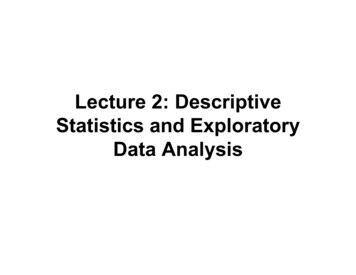
More on Histograms What’s the difference between a frequency histogramand a density histogram?Frequency HistogramDensity Histogram
Box 0.0AGEVariables
Bivariate DataVariable 1Variable 2CategoricalCategoricalDisplayCrosstabsStacked Box usScatterplotStacked Box Plot
Multivariate DataClustering Organize units into clusters Descriptive, not inferential Many approaches “Clusters” always producedData Reduction Approaches (PCA) Reduce n-dimensional dataset into much smaller number Finds a new (smaller) set of variables that retains most ofthe information in the total sample Effective way to visualize multivariate data
How to Make a Bad GraphThe aim of good data graphics:Display data accurately and clearlySome rules for displaying data badly:–––––Display as little information as possibleObscure what you do show (with chart junk)Use pseudo-3d and color gratuitouslyMake a pie chart (preferably in color and 3d)Use a poorly chosen scaleFrom Karl Broman: http://www.biostat.wisc.edu/ kbroman/
Example 1
Example 2
Example 3
Example 4
Example 5
R Tutorial Calculating descriptive statistics in R Useful R commands for working with multivariatedata (apply and its derivatives) Creating graphs for different types of data(histograms, boxplots, scatterplots) Basic clustering and PCA analysis
Statistics and Exploratory Data Analysis. Further Thoughts on Experimental Design Pop 1 Pop 2 Repeat 2 times processing 16 samples in total Repeat entire process producing 2 technical repl