Transcription
Cost Management ServicesPowering Healthcare. Empowering Employers.
Agenda Background/Overview The Problem and the Broken System Physician Led Medical Bill Review (MBR) Open Access Medical Plan Care Navigation Services (Pre-Care) Proactive Member Advocacy Open Access Design/Program Options Implementation and Member Education
Background Career: 25 Years of Cost Management Experience WC, Self-Funded Health, Imaging Facility Mgmt, Network Development AMPS: Cost Management Industry Leader for 16 years Mission – to establish a Fair system for all (employer and provider) AMPS becomes Co-Fiduciary to the Plan Physician Led, Technology/Data Driven Medical Bill Review Core Function. Also embedded into the Open Access Model Open Access Health Plan Largest Group: 120,000 Members, Smallest Group: 50 EEs More than 1B in Claims in past 12 Months Drexi Rx – Pharmacy Solution – Anthony Masotto
The ProblemYou run a Healthcare Business like it or not “GM is a health & benefits company with an auto company attached.”– Warren Buffet AND .It spends more on healthcare than steel, as does Starbuckson coffee beans. For nearly all, the 2nd largest operating expense behind payroll. Even billion organizations like Amazon/JP Morgan/Berkshire Hathawaycannot sustain healthcare costs.How’s your healthcare business doing?
The ProblemYou run a Healthcare Business like it or not“In 2021, the cost of healthcare for ahypothetical American family of 4 covered byan average employer-sponsored preferredprovider organization (PPO) plan is 28,256”According to The Milliman Medical Index man-Medical-Index
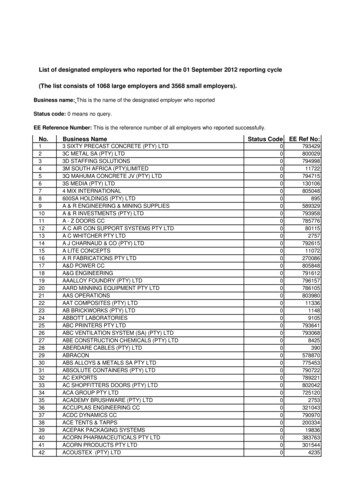
The ProblemHousehold Income is Devastated by Healthcare176%Cumulative growth in selectmetrics, 2010 to 2020 –Kaiser Family ers’CoinsuranceWorkers’Total CostShareTotalCoveredHealth CostsCosts Paidby InsuranceWorkers’Wages
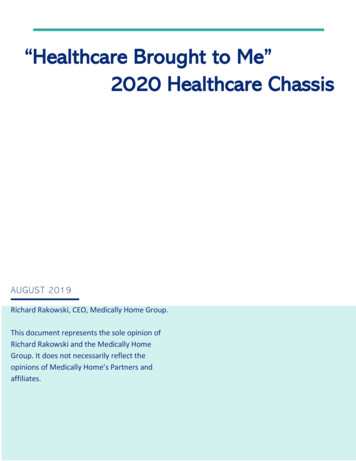
The ProblemAverage Health Insurance PremiumsWorker Contributions for Family Coverage, 2006 – 2016: ‘Status Quo’ ApproachUnsustainable:Cannot continueto ‘cost shift’ toemployees.(Source: Kaiser/HRET Survey of Employer-Sponsored Health Benefits, 2006-2016)
The Broken SystemWhy is Healthcare so Expensive? Employees never ask for the price of service, don’t shop around Hospitals – Create own prices; operating like an unregulated utility (thinkOPEC) Most assume there is no choice and that the BUCAHs act on our behalf Physicians – Greater utilization, more income (fee for service) Employee/members – Limited interest and resources to make informedfinancial decisions Insurance – Higher the cost, higher the profit (even w/fixed margin – thinkMLR). System is SET UP TO FAIL the employer/member.
The ‘Affordable’ Healthcare Act and “MLR” MLR, or Medical Loss Ratio, is a prime example of misaligned incentives inthe health care supply chain. The Medical Loss Ratio is a provision in theAffordable Care Act that was intended to keep insurance carriers from overcharging their customers. It requires that carriers spend .80 of each dollar collected in the smallgroup market, and .85 of each dollar collected in the large groupmarket, to pay its customers’ medical claims and activities that improvethe quality of care. If health care costs go up, then the carrier is justified in charging higherpremiums increasing the value of their 15% or 20%. With a model likethis, carriers benefit when health care costs go UP.
The Broken SystemWhy is Healthcare so Expensive?PPO: Formal DefinitionA Preferred Provider Organization (or ”PPO” and sometimes referred to as a Participating ProviderOrganization or Preferred Provider Option) is a managed care organization of medical doctors,hospitals, and other health care providers who have agreed with an insurer or a third-partyadministrator to provide health care at REDUCED RATES to the insurer's or administrator'sclients.PPO: Definition in PracticeA Preferred Provider Organization (or ”PPO” and sometimes referred to as a Participating ProviderOrganization or Preferred Provider Option) is a Contractual Arrangement, created in secret andconsidered proprietary, that is made between two entities (insurance carriers and medical providersincluding hospitals, physicians and ancillary providers) that not only control the cost of care thatmost employers and employees pay, BUT IN WHICH EACH OF THOSE ENTITIES BENFEFIT ASTHE COSTS GO UP.
The Broken SystemWhy is Healthcare so Expensive? Healthcare Bills are Paid with little diligence “No Audit” Clause Gov’t Stats show 90%, 95%, 97% of Claims found to have errors 98% of Claims are Paid off High Level Summary Bill (UB-04) No Transparency: PPO’s hide true costs PPO Top-down pricing with NO Benchmarking – ILLUSIONARY DISCOUNTS Conflict of Interest: We assume Carriers/PPO Networks are acting on behalfof client’s best interest “Head in the bed” mentality from the capitalistic provider community.(Dr. Josh Luke, “Health-Wealth”. www.health-wealth.com)
Why Errors ExistCare Giving is Primary / Billing is SecondarySeparate Systems EMR – Manages Clinical Care RevCycle – Manages BillingMedical Transcription Offsite/Offshore Manual Data Entry Sloppy Handwritten Orders/DocumentationClinical Workflow Booked When Ordered (not when rendered)Standard ”Order Sets” Bundle ServicesPRN prescriptions ('pro re nata’) taken as neededAnesthesia not documenting Start/Stop TimePCP and RN order the same treatment
Why Errors ExistHow to Maximizing Revenue: Upcoding & UnbundlingUpcoding RN procedure coded as by MD SpecialistSimple, single-view X-ray coded as complex with different viewing anglesSedation billed as anesthesiaED minor treatment (antibiotics and basic wound care) coded as high-complex careNICU Severity Level 4 coded for full stayAdd History of Cancer Diagnosis Code, upgrades to more costly DRG case rateChange primary Diagnosis Code to adjacent code, upgrades to more costly DRG case rateUnbundling Operating Theater billed in conjunction with bundled Surgery CPT (all Surgery CPTs are bundles)Supplies billed separate from Surgery CPTSame X-Ray or MRI used twice (head used for neck too)Blood draw, separate from lab (Arterial Puncture, Venipuncture Routine)IV Treatment, separate from R&B (IV Therapy EA AD HR, Concurrent IV Ther)Diabetes Treatment, separate from R&B (Glu Home Use Diagnos, Glucose Quant, Insulin 1 Unt Inj)SampleDescriptions
Facility Billing PracticesUniversal Bill Summary charges 1-3 pages Generally utilized forimmediate paymentItemized Bill Complete descriptionof charges Varies in lengthMedical Chart Complete Records Combination of physician/nursenotes and test results Often 500 pages Key Data The U.S. General Accounting Office has estimated that there are overcharges on 99% of all hospital bills! A review of 40,000 hospital bills in a national study by Equifax Services found errors on over 97% of bills!
The SolutionPhysician-Led Medical Bill ReviewOver 90%of hospital billscontain errors tothe detriment ofthe payerStudies by U.S.Government andEquifaxDid you know The Physician Panel: Performs a line-by-line review Corrects any mistakes Ensures accurate and reasonable pricing 8%Savings fromerrors alone
Physician Led Medical Bill ReviewUB-04 Invoice Used to Pay Hospital Bills*7% to 10% ofcharges includeerrors but can’t beseen on thisinvoice
Physician Led Medical Bill ReviewMUST Have the Itemized Bill*7% to 10% ofcharges are in errorbut can’t be seen onthis invoice
FIRST PHP Claim Sent to AMPS - 517,126 in ERRORSCommon Tactic: NICU Severity Upcoding / MBR INN Claim - Regional Health PlanScenario MBR performed on INN Claim Large & complex NICU Claim First 68 days of Interim BillFindings1. 184,673 Savings - NICU Levels adjusted to be consistent withnational NICU criteria established by Milliman2.BilledBefore AMPS After AMPS 978,502 978,502 AllowedSavings %391,401171,99260%82%1. 184,673 – NICU Severity Level Correction2. 332,453 – Med Surg Unbundled Supplies 332,453 Savings - Unbundled Services from Med Surg Suppliesremoved Applied PPO Discount & AMPS Adjustments21
Charged 138,071 for a Service that was NEVER performedServices Booked When Ordered / Expertise Required to Identify Non-Rendered ServicesScenario Emergency Room visit, chest pains Stress Test ordered, but not rendered MBR Full performed on OON claim AMPS Medical Director review of sequence of events and notesidentified, previous HIDA scan showed biliary calculus deposits.Therefore, Stress Test (Adenosine) not performed.Findings1. 118,630 Savings – Denied all charges associated with AdenosineStress Test Dr. Duke - The notes stated an adenosine stress test wouldbe considered but this test was never performed most likelybecause the results of a previous HIDA scan showed biliarycalculus deposits. The patient’s pain was attributed to thisas all of his cardiac markers had remained unchangedincluding serial EKG's. the (adenosine) test was neverperformed and the MAR shows no administration of thismedication and there is no adenosine stress test reportincluded. Deny the entire charge for Adenosine.2. 4,922 Savings – Denied outpatient encounter line-items, notapplicable since converted to in-patient encounter3. 9,894 Savings – Adjusted to R&C pricesBilledBefore AMPS After AMPS 138,071 138,071 Allowed133,9294,625Savings %3%97%1. 118,630 - Adenosine Stress Test Never Administered2. 9,894 - Excessive charges adjusted3. 4,922 - Unbundling & ER to Inpatient w/ ER left on bill123
Actual Hospital ChargesFrom Audited Claims
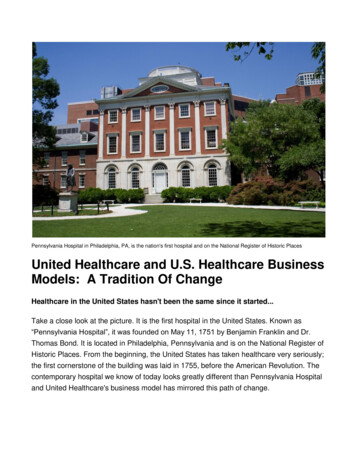
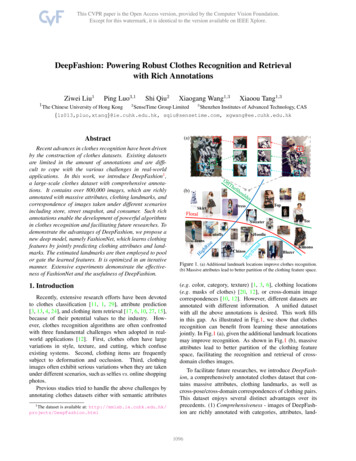
The System is Flawed:Hospital Mark-UpHow much does a Computed Tomography (CT) Scan cost?Hospital AHospital BAverageBilledAverageCostAverage MedicarePayment50% PPODiscount 1,516 112 195 758 212 207 141 181 1,506 134Hospital C 2,268 232Hospital E 3,042 76Hospital DHospital F 1,547 1,492MC 150% 753 263 193 1,134 290 213 1,521 175 773 746 293 311 320 272
The SolutionAn Open Access Medical PlanWhat is “Open Access”?It is a Self-Funded Plan Design that involves the removal of the middle-man (thePPO Network), and as such, ALLOWS for Medical Bill Review as well as ensuringthe plan does not overpay To determine what a fair market reimbursement is to the provider for aparticular service, ‘reference points’ are used when repricing claims Cost: Self-Reported provider Costs are submitted to Medicare every year.This data is utilized in determining a FAIR payment Medicare Allowed Rates: Also public data that is used in making adetermination of FAIRMainly, claims are repriced to the Average of 150% of Medicare & 135% ofthe provider’s Cost, or benchmarked back to Medicare, 148%
The SolutionOpen Access Claim ExampleXYZ Medical Procedure Using a traditional ‘Top Down’ PPO Discount Model Medicare Allowed Rate 1,000 COST to provider 920.00 Provider’s Billed Charge 7,000 (7x’s Medicare) PPO Network ‘discount’ 3,200 PAID AMOUNT BY PLAN 3,800 (3.8x’s the Medicare Rate)XYZ Medical Procedure Using a traditional “Cost-Plus” Reference BasedReimbursement Model Medicare Allowed 50% 1,500 SAVINGS TO PLAN 3,800 - 1,500 2,300 or 39%
The SolutionSavings Estimates – Raw Data SampleIndiana Based Employer (84 Employees on the Plan)
You can take control over your plan and its costs! .What’s Easier? Increasing revenue by 40% OR cutting healthcare costs by 20%? .No contest!Employer with 50M in top line revenue, spends 5M on healthcare costs (typicalfor a company with 500 employees). They make 2.5M in profits last year (5%margin). Through a refined health benefits approach, they can recognize aconservative 20% cost reduction (on the high end, we can see as much as 30-40%). Indoing so, their EBITDA grew by 1M which is a 40% increase. To create the sameEBITDA impact, they'd have to grow top line revenue by 20MM!Imagine the increased wages, year-end bonuses, profit-sharing, additional hiring,expansion plans, etc. that could be achieved
All In One SOLUTIONFiduciary Protection Ensures prudent execution of Plan Document termsIntelligent Pricing Fair Pricing built on expertise and smart softwareMember Advocacy Standing ready to help MembersCare Navigation Connecting Members with friendly ProvidersProvider Relations Fostering local relationshipsData Visibility On-demand data visibility – anytime, anywhere
Member AdvocacyMember AdvocacyEducation From The Start Direct line of communication with Members by attending open enrollment andeducating Members on their new healthcare plan Available 12 hours each weekday from AMPS multi-lingual Member Services Centers inAtlanta, GA and Phoenix, AZ Tailored training and marketing materials on how to identify a balance bill andengage their Member AdvocateA Proactive Approach AMPS Member Advocacy Team proactively contacts the Member with a reminder to calltheir AMPS Member AdvocateHuman ResourcesAll In One provides Human Resources with educational material to distribute to Membersin order answer common questions
Care NavigationFind. AMPS Provider Finderand Pricing Tools areused by AMPSNavigation Team andutilizationmanagement partnersto find a “friendly”Provider when needingmedical care, based oncost, quality, location,and prior utilization.Steer.Schedule. Steer Members tocontracted Providers inAMPS “direct-toemployer” programs. Transparent, bundledpricing on plannedelective medicalprocedures Plan designs that offersavings for both thePlan and the Memberswhen utilizing theAMPS direct contactedProviders for medicalcare. Additional savings atAmbulatory SurgeryCenters, independentImaging Facilities andGI Centers as opposedto a hospital.MembersAll In One provides members with access to providers offering the best value, loweringthe employee's out of pocket costs.
AMPS Connect
Data VisibilityOn-demand data visibility – anytime, anywhereA Trusted Source for Your Data On-demand visibility into Plan performance,with noteworthy metrics, easy-to-understanddashboards, messaging alerts, and tailoredreports via secure email.Analytics & Reporting 24/7 Access through AMPS Portal Transparency Email NotificationsCFOs / Consultants / HRAMPS online portal allows CFOs to monitor the overall medicalspend of the company real time with 24/7 access.
Optional Strategies Using an Open Access ModelFULL OPEN ACCESSEliminate PPO in itsentirety. Replace with RBPfor all claims with balancebill protection. NoNetworks. Max Savings.HYBRID OPEN ACCESSUse ProfessionalONLY Network andall other claims runthrough AMPS’ OpenAccess SolutionDUALOPTIONOffer traditional PPOand alternative OpenAccess solution. MemberChoice.
Complimentary Savings Analysis – Proof of ConceptIn order to obtain a Savings Analysis from AMPS, we needthe data from Option 1 or Option 2 shown. The morecomprehensive the data we receive, the more we can drilldown into the following areas: Savings Summary Savings by Claim Type Costly Hospitals / Providers Claim Insights Statistics by Location Market AnalysisOPTION 1AMPS will create a high-level savingsanalysis based on several assumptions.Requirements:1.) Plan Financial Data Total Billed Charges Total Allowed2.) CensusOPTION 2AMPS will create an in-depth savingsanalysis that provides insight on plan spend,high-cost claims, provider acceptance, etc.Requirements:1.) Claim Data – ANSI 837 or Flat File2.) Census2.) 3 Largest Claims Paid (UB, IB, EOB)
Thank You!Neil Ropp – PHP TPA Services800-982-7257nropp@phpni.comScott Fuqua708-415-7094scottfuqua@advancedpricing.com
A review of 40,000 hospital bills in a national study by Equifax Services found errors on over 97% of bills! Universal Bill Summary charges 1-3 pages Generally utilized for immediate payment. Itemized Bill Complete description of charges Varies in length. Medical Chart Complete Records Combination of physician/nurse