Transcription
THEBREAKOUT ALERTSPECIAL REPORTThe Breakout AlertGuide to Technical Analysis
THEBREAKOUT ALERTThe Breakout AlertGuide to Technical AnalysisBy Jeff Clark, editor, Breakout AlertTechnical analysis (TA) is much more of an art than a science. If you try to force it toconform to strict rules and formulas, it will be wrong almost every time.Try thinking of TA the way I do where the chart of a stock (or index) and its technicalindicators is an emotional picture of the stock at a specific moment in time. If I can goback in that picture and find a time where the conditions were similar, and note howthe chart behaved afterwards, it can provide strong clues about what to expect in thefuture.But TA is emotional. It evolves. So, conditions that used to provide a catalyst for a bigmove or reversal may need to get more extreme to cause a similar movement the nexttime.Think about it this way When I first got married, I’d often come home from work, take off my socks, and dropthem on the floor next to the couch in the living room. My wife would come home, seemy socks on the floor, and get all ticked off about it. This happened over and over again.Eventually, though, my wife got a little better about dealing with her slob of ahusband, and I got a little better about not leaving my socks next to the couch.Leaving my socks on the floor no longer elicited the same reaction from my wife.She still had the same emotions. But she had adapted. She had evolved. She wouldneed a bigger catalyst before getting upset with me – like when she found a dozenpairs of dirty socks tucked underneath the sofa.Here’s my point A lot of my trading strategy revolves around finding emotionally overbought/oversold conditions that are ready to reverse. TA helps me identify conditions inwhich investors’ emotions have gotten extreme, and where I can see how stocks havereacted to similar conditions in the past.But you can’t force TA into a strict formula. You have to give it some “wiggle room.”2
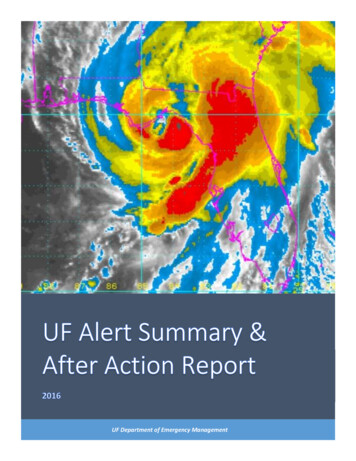
THEBREAKOUT ALERTIn this guide, I aim to show you the fundamentals of chart pattern analysis, and teachyou everything you need to know about my approach to TA. I’ll also show you that,while TA can be a valuable predictive tool, it isn’t foolproof or 100% accurate everysingle time. It’s a tool that should support the trade idea, but not be the trade idea.With all that said, let’s get started.ANATOMY OF A CHART PATTERNBefore you can start identifying chart patterns, there are important aspects of apattern to know and consider.TrendA trend is the general direction of the price of a security, asset, or index.Upward trends form as prices make consistently higher highs and higher lows.Downward trends form as prices make lower highs and lower lows. And sidewaystrends form as the highs and lows of a price stay generally the same.TrendlineA trendline is a line drawn over a series of highs or lows to show the direction of asecurity’s price over a given timeframe. The two trendlines that make up typical chartpatterns are support and resistance lines.Plotting support and resistance lines is one of the first steps to identifying a chartpattern. See the chart of the VanEck Vectors Gold Miners ETF (GDX) below for anexample of a sideways trend with consistent support and resistance levels.3
THEBREAKOUT ALERTTimeframeA timeframe is a period in which a trend is identified. For our purposes, trendsmanifest over several different timeframes – hours, days, weeks, and months.We often refer to the short term, intermediate term, and long term when talking abouttimeframes. We define the short term as one day to two weeks, the intermediate termas two weeks to three months, and the long term as anything longer than that.SupportA trendline formed below the price of a security which the price stays above. Thistypically marks the spot where buyers step up and buy the stock.These trendlines can rise, fall, or stay horizontal.ResistanceA trendline formed above the price of the security which the price stays below. Thistypically marks the spot where sellers prevail.Like support lines, resistance lines can rise, fall, or stay horizontal.BreakoutA breakout occurs when the price of a security breaks through a support orresistance line. This can indicate either that a pattern has completed successfully orthat a security has bucked a trend.4
THEBREAKOUT ALERTVolumeVolume is the number of shares or contracts transacted in a security in a giventimeframe. A transaction is made up of both a buy and a sell from two separate parties.Trading volume can be used as a confirmation tool when analyzing a trend breakout.For instance, if a stock price breaks out of a trend with high trading volume, the newtrend will likely continue. If it breaks out with lower volume, it indicates the breakoutcould reverse.Price TargetA price target is where a trader predicts the price will be in the future. Traders usechart analysis and predetermined conditions to predict where the price of a securitywill go.TECHNICAL INDICATORSWhile recognizing chart patterns can help traders predict future price movements,it’s not a foolproof method. It’s also very important to know various technicalindicators and overlays that we use to identify chart patterns, and any short-termstrength or weakness in a security Moving Average (MA)A trend-following indicator used in technical analysis to smooth out price actionby filtering out large spikes and drops in a security’s price. For our purposes,we’ll most often be using the simple 50-day MA.Exponential Moving Average (EMA)A type of moving average that is weighted more towards recent data. Becauseof this, the EMA reacts to price changes in a security more quickly than a simpleMA. For our purposes, we’ll most often be using the 9-day EMA.Moving Average Convergence Divergence (MACD)A momentum indicator that shows the relationship between two distinctmoving averages of a security’s price. Traditionally, the MACD is calculated bysubtracting the 26-day exponential moving average (EMA) from the 12-day EMA.Relative Strength Index (RSI)A momentum indicator designed by J. Welles Wilder to measure the speed andchange of price movements. The RSI ranges from 0 to 100. Traditionally, tradersconsider a security overbought if the RSI is over 70 and oversold if it’s below 30.The data is generally measured over a period of 14 trading days.5
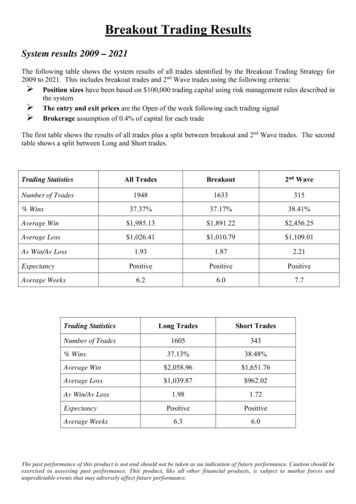
THEBREAKOUT ALERTBollinger BandsPoints on a chart plotted two standard deviations above and below an asset’smoving average line. It is used in technical analysis to determine overboughtand oversold market conditions.The bands are also subject to market volatility – during periods of low volatilitythe bands contract, while during periods of high volatility the bands widen.McClellan OscillatorAn indicator used in technical analysis to determine the balance betweenstocks that are advancing and declining. It is calculated by subtracting the 39day exponential moving average (EMA) of stock advances, less declines, fromthe 19-day EMA of stock advances, less declines. The result is a momentumindicator that works similarly to the MACD.Commodity Channel Index (CCI)A momentum-based indicator that is often used to determine when aninvestment is reaching oversold or overbought conditions. In general, itmeasures the current price level relative to an average price level over a givenperiod of time.If the CCI is high, prices are far above their average. If the CCI is low, prices arefar below their average. This versatile indicator can be applied to indices, ETFs,stocks, and other securities.Now, here are some of the most common chart patterns and how to play them CHART PATTERNSDouble Top/Bottom PatternA double top or double bottom chart pattern indicates a future move beyond tworepeated support or resistance levels.For instance, if a chart has a big run up to a resistance level, falls, and then returns tothe resistance level (forming two “tops” on the chart), it is likely to head much lower.See the chart of United Airlines (UAL) on the following page. The chart found twosimilar peaks (marked by the blue arrows) near a strong resistance level (the blue line)and then broke down.The reverse is true, too If a chart makes two bottoms at a support level but doesn’tbreach them, it is likely that the next high will be higher than the previous peak.6
THEBREAKOUT ALERTNote the double bottom that UAL formed below (the red arrows). After bottoming asecond time at the same support level, the stock overcame its previous peak.HOW TO TRADE THE DOUBLE TOP/BOTTOM PATTERN:Traders using a double top pattern should look to enter short trades after a security’sprice has started to decline from its previous resistance level.For the double bottom pattern, look to enter long trades once the price reverses froma similar support level a second time.Head and Shoulders PatternThe head and shoulders pattern is used to predict a trend reversal from bullish to bearish.It’s considered one of the most reliable reversal patterns.7
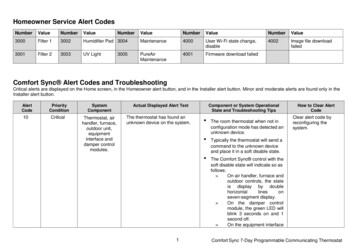
THEBREAKOUT ALERTThis pattern is formed when the price of a security in a bullish trend forms a peak andthen dips down to form a trough below it. This forms the first “shoulder.”After finding the bottom of the trough, the price rises again to form a second high,higher than the first. Again, the price declines to a similar level as the previoustrough. This larger peak is what’s called the “head” of the pattern. And connecting thetwo troughs forms the “neckline” of the pattern.Finally, the price of the security will make another high from the bottom formed bythe second trough – the second shoulder. This high will be lower than the previoushigh set by the “head” and closer to the initial shoulder. (See the chart of the U.S.dollar below for an example.)It is at this point – if the pattern plays out successfully – that the price will break downfrom any bullish uptrend and decline to lows last seen before the initial shoulder.HOW TO TRADE THE HEAD AND SHOULDERS PATTERN:Aggressive traders following this pattern should look to enter short trades once thelevel set by the first “shoulder” is reached and reverses.Conservative traders following this pattern should look to enter short trades afterthe price breaches the neckline.If the price can’t break the neckline, it’s called a failed head and shoulders reversal Ifthat happens, the stock typically rises.8
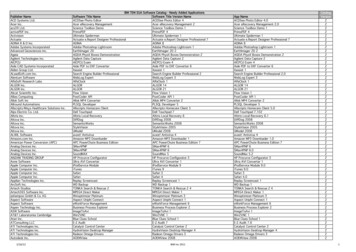
THEBREAKOUT ALERTInverse Head and Shoulders PatternCharts can also form an inverse head and shoulders pattern. This pattern is used topredict a downtrend reversal. The pattern is, as the name implies, the inverse of thetypical head and shoulders pattern.The pattern starts when the price of a security falls to form a trough (the firstshoulder) and recovers. Then, it falls again to form a lower trough and recovers to theprevious high set after the first trough, forming the head.Finally, after the price falls again to form a third trough – but not as low as theprevious one (the second shoulder) – the pattern resolves in a breakout to the upside.See the chart of Seattle Genetics (SGEN) below for an example.HOW TO TRADE THE INVERSE HEAD AND SHOULDERS PATTERN:Once identified, traders should look to enter long trades once the second shoulderclearly forms – meaning when the price reverses from a higher low than the previoustrough (the head).Wedge PatternA wedge pattern is a contrary indicator, predicting a reversal move as the tradingrange of a security tightens as it rises or falls. The two variants, a rising wedge and afalling wedge, work similarly.In a rising wedge pattern, the price of a stock or security is in an uptrend and makesa series of gradually higher highs and higher lows.9
THEBREAKOUT ALERTIf the trading range within the uptrend begins to contract, the trend is likely to breakdown at the corner of the wedge, below the major support level.See the chart of Hertz (HTZ) below for an example of a rising wedge pattern resolvingto the downside.The same is true of falling wedge patterns, in which the price of a security in adowntrend will break out from the pattern once the series of gradually lower lows andlower highs contracts tightly. Once the price of a downtrending security breaks abovethe falling resistance line, the pattern resolves to the upside.See the chart of General Motors (GM) below for an example of a falling wedge patternresolving to the upside.10
THEBREAKOUT ALERTHOW TO TRADE THE WEDGE PATTERN:Traders following the rising wedge pattern should look to enter short trades once theprice of a security breaks below the rising support line.Likewise, falling wedge patterns should be exploited on the long side by doingthe opposite – entering a long position when the price breaks above the fallingresistance line.Flag and Pole PatternA flag pattern is a continuation pattern that forms as the price of an asset or securitybegins to trend downward after a sharp rise upward, or vice versa.The “flag” of the pattern is formed by two parallel lines acting as the resistance andsupport for the trend as it bucks the initial trend, or the “pole.”See the chart of GameStop (GME) below for an example of how the “poles” formed bysharp spikes in price usually resolve to the downside.Flag patterns usually resolve to the opposite direction of where the flag was trending.This occurs once the price of a security breaks through resistance or support,depending on the previously established trend.HOW TO TRADE THE FLAG AND POLE PATTERN:Traders following this pattern should look to enter positions when the price breaksthe flag formation in the direction the price was moving before the flag formed.11
THEBREAKOUT ALERTTriangle PatternsA triangle pattern is one of the simplest types of chart patterns to spot and follow.This type of pattern occurs when a stock price consolidates – meaning the lows andhighs in the stock price trend closer together and volatility tightens. This manifestsas two trendlines that converge at an apex.This apex marks the end of a triangle pattern. At that point, the pattern will eithercomplete successfully and the movement predicted by the pattern will manifest, orthe pattern will fail and a new trend will be established. (Note: Traders should notenter trades using a triangle pattern until it resolves in a breakout to either side.)There are several variants of triangular chart patterns, all of which predict differentfuture price action:a) Symmetrical TriangleA symmetrical triangle pattern marks a period of consolidation in a trend aftera prior large move in either direction. As the price of a stock chops around backand forth between lower highs and higher lows, two converging trendlines – adescending resistance line and an ascending support line – form, leading to anapex point and completing the triangle.See the chart of W.W. Grainger (GWW) below for an example of a symmetricaltriangle reaching its apex and resolving to the upside.Once the chart reaches the apex point, the price typically breaks out in the samedirection as the initial large move. To determine future price action, look for a breakabove the descending resistance line if the pattern is playing out after a large run up.If the pattern formed in response to a large move to the downside, look for the stockprice to break below the ascending support line for another downside move.12
THEBREAKOUT ALERTHowever, if the trend reverses at the apex point and breaks in the opposite directionof the previous move, it is likely that the trend has reversed.HOW TO TRADE THE SYMMETRICAL TRIANGLE PATTERN:Traders following this pattern should look to enter positions in the samedirection as the initial move that preceded the price consolidation.b) Ascending TriangleAn ascending triangle pattern marks a potential bullish breakout upon completion.It is also often preceded by an upward trend, making it a continuation pattern (likethe flag pattern we discussed earlier).The pattern is formed by two trendlines: an ascending support line formed byhigher lows, and a flat resistance line formed by repeated tests of a high point in theprice. At the apex of this trend, the price of a security is likely to break to the upside.See the chart of the VanEck Vectors Semiconductor ETF (SMH) below for an exampleof an ascending triangle pattern reaching its apex and resolving to the upside.The key aspect to watch in this pattern is the rising support line. It indicatesdeclining selling interest. If the price breaks below this support line, the patternfails and a new trend is formed.HOW TO TRADE THE ASCENDING TRIANGLE PATTERN:Traders following this pattern should look to enter long trades once the priceof the security breaks the sideways resistance line.13
THEBREAKOUT ALERTc) Descending TriangleA descending triangle pattern represents the opposite of the ascendingtriangle pattern – a successful completion of the pattern results in a break tothe downside.The pattern is formed by two trendlines: a declining resistance line of lowerhighs, and a steady support level of repeated lows.See the chart of the iPath Bloomberg Coffee Subindex Total Return ETN (JO)below for an example of a descending triangle pattern reaching its apex andresolving to the downside.The descending triangle culminates at the apex near the sideways supportline (the resistance line in the ascending triangle) and typically resolves in abreak to the downside. This is the opposite of the ascending triangle, in whicha break from the pattern to the upside occurs when the pattern culminates atthe apex formed at the sideways resistance line.HOW TO TRADE THE DESCENDING TRIANGLE PATTERN:Traders following this pattern should look to enter short positions once abreak to the downside of this pattern has occurred.Cup and Handle PatternA cup and handle pattern occurs when a security rebounds from a low period over anintermediate- to long-term timeframe to retest old highs. This action forms a roundedbottom in the stock’s trajectory – the “cup.”14
THEBREAKOUT ALERTAfter reaching those previous highs, traders who held the stock since then wouldbe looking to exit their positions, as they’re now profiting on the trade. This sellingpressure then forms a new trend from the recent test of the previous high. Thischannel is the “handle” of the pattern.If the pattern completes successfully, the price should break above the trendestablished by the “handle” and go on to reach new highs.See the chart of the VanEck Vectors Coal ETF (KOL) below for an example of asideways-trending handle forming after a cup.HOW TO TRADE THE CUP AND HANDLE PATTERN:Traders following this pattern should look to enter long positions once the trendestablished by the “handle” breaks to the upside.Rectangle PatternA rectangle pattern is a continuation pattern which marks a pause in the trend for asecurity’s price. The pattern is formed by a series of at least two consistent highs andlows. These highs and lows make up the connecting point for two parallel lines thatform the top and bottom of the rectangle.This pattern completes once the security price breaks below the top or bottom ofthese two parallel lines. Thus, the rectangle is similar to the symmetrical triangle, butnot as predictive. This is because a series of higher lows and consistent highs is notestablished.See the chart of Chevron (CVX) on the next page for an example.15
THEBREAKOUT ALERTHOW TO TRADE THE RECTANGLE PATTERN:Traders following this pattern could look to enter trades once either the support orresistance line has been breached. But as we mentioned, the rectangle pattern isn’t a verygood predictive pattern. So it shouldn’t be relied upon like the other patterns listed here.Instead, the rectangle pattern can help pin down other potential patterns or trends.CrossesWhile not technically a pattern, a cross can be an important catalyst to watch whenlooking to enter new trades in either direction.A cross occurs when the various moving average lines of a security – like the movingaverage (MA), exponential moving average (EMA), or Bollinger Bands – cross oneanother.This can result in a number of buy or sell signals, depending on the lines involved andthe direction.One example of a bullish cross is when the 9-day EMA crosses above the 50-day MA.This indicates that the most recent, ultra-short-term price action has been favorablewhen compared to longer-term price action. This means that momentum has shiftedin the opposite direction, and typically results in a broken trend.See the chart of the United States Oil Fund (USO) on the next page for an example ofthe 9-day EMA crossing above the 50-day MA, and the effect it has.16
THEBREAKOUT ALERTHOW TO TRADE A CROSS:Traders watching for crosses should look to establish long positions as the 9-dayEMA crosses above the 50-day MA.And on the downside, look to establish short positions when the 9-day EMA crossesbelow the 50-day MA.Sledgehammer PatternAnother important trend to watch out for is the “sledgehammer.” Like the cross, thesledgehammer isn’t technically a pattern like most of the others on this list. But it isstill a valuable TA tool.The sledgehammer is a bullish reversal pattern. It plays out when a stock get crushed,bounces a little, and then gets crushed again.See the chart of Target (TGT) on the next page for an example of where to buy in whenobserving a sledgehammer pattern.17
THEBREAKOUT ALERTHOW TO TRADE THE SLEDGEHAMMER PATTERN:Traders following this pattern should look to enter long positions on that secondcrushing – the reason being that when sledgehammer patterns play out, the momentumindicators are usually stretched so far to the downside that a reversal move is highly likely.IN SUMMARYSo, there you have it – a quick and easy illustration of some of the most frequentlyused chart patterns, and how to use them.I suggest keeping this guide handy – maybe print it out and keep it near your desk.And refer to it whenever I issue a trade recommendation. It’ll keep you in tune withhow I use TA. Then, once you’re more comfortable, you can start searching for thesepatterns in your own trading.There are other patterns, for sure. But the patterns I’ve explained here are the onesI look for most. They tend to be reliable at forecasting future price movements. Andthey’ve helped to identify many successful trade setups for me over the years.I expect they’ll continue to do so.Best regards and good trading,Jeff Clark18
THEBREAKOUT ALERT 2019 Jeff Clark Trader, 455 NE 5th Ave, Suite #D351, Delray Beach, FL 33483, USA. All rights reserved. Any reproduction, copying, or redistribution, in whole or in part, isprohibited without written permission from the publisher.Customer service representatives are available to help you Monday-Friday, from 9 a.m. to 7 p.m. ET. Phone: (800) 752-0820 or (443) 353-4499 if calling from overseas.Email: feedback@jeffclarktrader.com.Information contained herein is obtained from sources believed to be reliable, but its accuracy cannot be guaranteed. It is not designed to meet your personal situation –we are not financial advisors nor do we give personalized advice. The opinions expressed herein are those of the publisher and are subject to change without notice. It maybecome outdated and there is no obligation to update any such information.Recommendations in Jeff Clark Trader publications should be made only after consulting with your advisor and only after reviewing the prospectus or financial statementsof the company in question. You shouldn't make any decision based solely on what you read here.Jeff Clark Trader writers and publications do not take compensation in any form for covering those securities or commodities.Jeff Clark Trader expressly forbids its writers from owning or having an interest in any security that they recommend to their readers. Furthermore, all other employeesand agents of Jeff Clark Trader and its affiliate companies must wait 24 hours before following an initial recommendation published on the Internet, or 72 hours after aprinted publication is mailed.19
Trading volume can be used as a confirmation tool when analyzing a trend breakout. For instance, if a stock price breaks out of a trend with high trading volume, the new trend will likely continue. If it breaks out with lower volume, it indicates