Transcription
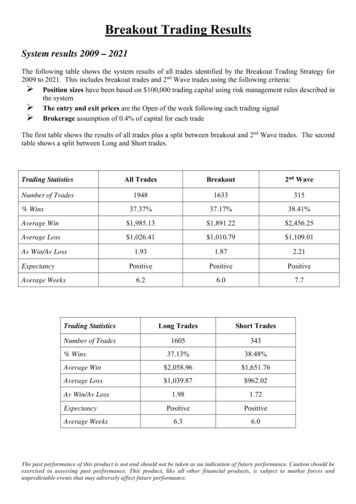
Breakout Trading ResultsSystem results 2009 – 2021The following table shows the system results of all trades identified by the Breakout Trading Strategy for2009 to 2021. This includes breakout trades and 2nd Wave trades using the following criteria: Position sizes have been based on 100,000 trading capital using risk management rules described inthe system The entry and exit prices are the Open of the week following each trading signal Brokerage assumption of 0.4% of capital for each tradeThe first table shows the results of all trades plus a split between breakout and 2nd Wave trades. The secondtable shows a split between Long and Short trades.Trading StatisticsAll TradesBreakout2nd WaveNumber of Trades1948163331537.37%37.17%38.41%Average Win 1,985.13 1,891.22 2,456.25Average Loss 1,026.41 1,010.79 7.7% WinsAv Win/Av LossExpectancyAverage WeeksTrading StatisticsLong TradesShort TradesNumber of Trades160534337.13%38.48%Average Win 2,058.96 1,651.76Average Loss 1,039.87 962.021.981.72PositivePositive6.36.0% WinsAv Win/Av LossExpectancyAverage WeeksThe past performance of this product is not and should not be taken as an indication of future performance. Caution should beexercised in assessing past performance. This product, like all other financial products, is subject to market forces andunpredictable events that may adversely affect future performance.
The following simulated results were generated by historically back testing the system and therefore arenot results achieved in real time. Simulated performance results have inherent limitations such as thebenefit of hindsight. These and other factors relating to the markets in general or to the implementationof any specific trading system can adversely affect actual trading results.2009 Simulation portfolio Starting capital is 100,000. Dividends have been ignored.The entry and exit prices are the Open of the week following each trading signal.A brokerage assumption of 0.4% of capital invested has been used for each full trade.Sector risk of a maximum of 3 positions per sector in each direction (long & short).Trading StatisticsFinal CapitalTrades 153,105.64%Gain53.11%%Maximum Drawdown9.08%Number of Trades% Wins3969.23%Average Win 2,304.14Average Loss 758.85Av Win/Av Loss3.04Average Weeks per trade8.6The past performance of this product is not and should not be taken as an indication of future performance. Caution should beexercised in assessing past performance. This product, like all other financial products, is subject to market forces andunpredictable events that may adversely affect future performance.
Trades - 2009 Simulation portfolio Starting capital is 100,000. Dividends have been ignored.The entry and exit prices are the Open of the week following each trading signal.A brokerage assumption of 0.4% of capital invested has been used for each full trade.Sector risk of a maximum of 3 positions per sector in each direction (long & short).Share codes ending with a ‘2’ are 2nd wave MaterialsEnergyEntryDirection -Dec-09UnitsPriceTrade Value ExitInc. Costs 48,3432,129 5.15 3.01 1.75 3.32 1.58 10.89 2.69 7.36 20.65 4.89 3.83 3.19 49.00 5.74 3.80 4.22 2.59 5.20 0.95 0.56 1.24 5.63 12.14 4.27 1.93 0.29 2.71 12.45 0.94 1.68 11.80 0.71 5.56 7.81 2.07 2.89 3.70 1.74 6.81 7,868.10 13,914.04 3,979.25 19,163.88 8,025.60 9,085.99 9,085.56 3,994.80 8,987.65 13,221.97 6,263.26 14,730.01 12,639.40 13,670.48 10,282.20 7,622.58 9,078.09 13,606.00 6,973.45 13,632.56 8,898.28 15,109.79 17,552.40 18,117.82 17,448.12 10,888.26 19,071.19 20,650.60 11,972.84 13,313.84 26,395.60 14,290.97 19,281.84 20,137.28 10,229.74 29,211.63 21,895.80 14,575.62 14,556.89 5.60 2.90 1.12 3.12 0.58 12.15 3.46 7.28 19.74 4.96 4.46 3.32 50.60 7.00 4.30 5.57 2.52 5.19 0.71 0.53 1.67 5.46 11.59 4.60 2.38 0.42 3.89 13.16 1.28 1.59 9.25 0.92 6.23 8.05 2.50 2.97 4.00 1.77 7.13 8,590.40 13,351.60 2,556.96 17,936.88 2,958.00 10,096.65 11,639.44 3,967.60 8,626.38 13,357.28 7,323.32 15,268.68 13,105.40 16,604.00 11,588.50 10,020.43 8,797.32 13,525.14 5,190.81 12,850.38 11,935.49 14,594.58 16,689.60 19,439.60 21,429.52 15,705.48 27,265.01 21,740.32 16,238.08 12,549.87 20,775.50 18,443.24 21,518.42 20,672.40 12,305.00 29,848.66 23,576.00 14,767.11 N18-Dec-09OPENOPENOPENOPENOPEN ProfitWeeks 29114233222- 722.30- 562.44 1,422.29- 1,227.00 5,067.60 1,010.66 2,553.88 27.20 361.27 135.31- 1,060.06 538.67- 466.00 2,933.52 1,306.30 2,397.85- 280.77- 80.86- 1,782.64- 782.18 3,037.21- 515.21- 862.80 1,321.78 3,981.40 4,817.22 8,193.82 1,089.72 4,265.24- 763.97 5,620.10 4,152.27 2,236.58 535.12 2,075.26 637.02 1,680.20 191.49 .06%11.60%2.66%20.29%2.18%7.67%1.31%4.28%
2010 Simulation portfolio Starting capital is 100,000. Dividends have been ignored.The entry and exit prices are the Open of the week following each trading signal.A brokerage assumption of 0.4% of capital invested has been used for each full trade.Sector risk of a maximum of 3 positions per sector in each direction (long & short).Trading StatisticsFinal CapitalTrades 142,384.04%Gain42.38%%Maximum Drawdown6.79%Number of Trades% Wins3571.43%Average Win 1,978.98Average Loss 709.05Av Win/Av Loss2.79Average Weeks per trade8.9The past performance of this product is not and should not be taken as an indication of future performance. Caution should beexercised in assessing past performance. This product, like all other financial products, is subject to market forces andunpredictable events that may adversely affect future performance.
Trades - 2010 Simulation portfolio Starting capital is 100,000. Dividends have been ignored.The entry and exit prices are the Open of the week following each trading signal.A brokerage assumption of 0.4% of capital invested has been used for each full trade.Sector risk of a maximum of 3 positions per sector in each direction (long & short).Share codes ending with a ‘2’ are 2nd wave trialMaterialsFinancialsEnergyNo 947 3.090 2.200 5.750 2.497 3.175 11.610 34.410 15.460 1.540 0.890 12.280 3.800 7.890 0.315 3.077 5.190 0.670 6.400 1.245 1.025 21.500 3.940 1.970 1.200 0.500 24.950 7.020 2.750 1.790 13.550 0.640 1.860 3.570 1.460 0.825Trade ValueInc Costs 12,909.49 9,929.00 8,688.55 11,497.64 19,139.90 15,223.86 16,237.90 13,256.04 20,093.90 15,424.38 7,841.28 19,468.40 10,836.31 9,324.43 13,140.48 10,385.67 6,233.42 12,871.20 12,321.57 11,090.20 10,381.10 10,392.38 17,295.28 10,530.00 10,110.50 7,841.35 22,280.66 16,980.50 16,131.84 14,883.70 25,348.72 13,870.22 6,706.27 6,455.84 deValue 2.780 1.905 5.200 2.680 3.530 11.820 32.650 15.500 1.340 0.950 12.680 3.370 7.590 0.515 3.090 5.500 1.460 6.799 1.735 1.100 20.800 4.420 3.100 1.220 0.560 23.300 6.630 2.740 1.770 14.370 0.705 2.160 3.980 1.470 0.890 11,567.58 8,562.98 7,826.00 12,290.48 21,194.12 15,436.92 15,345.50 13,237.00 17,547.30 16,398.90 8,064.48 17,335.28 10,466.61 15,183.23 13,141.77 10,961.50 13,528.36 13,618.40 17,101.90 11,853.60 10,004.80 11,611.34 27,106.40 10,662.80 11,263.28 7,292.90 20,970.69 16,851.00 15,887.52 15,720.78 27,810.84 16,042.32 7,446.58 6,473.88 23,092.83Week s2331120891120101012917185151611941217782467655522 Profit/Loss- 1,341.91- 1,366.03- 862.55 792.84 2,054.22 213.06- 892.40- 19.04 2,546.60 974.52 223.20 2,133.12 369.70 5,858.80 1.29 575.83 7,294.94 747.20 4,780.33 763.40- 376.30 1,218.96 9,811.12 132.80 1,152.78- 548.45- 1,309.97- 129.50- 244.32 837.08 2,462.12 2,172.10 740.31 18.04 15.66%11.04%0.28%7.45%
2011 – Simulation portfolio Starting capital is 100,000. Dividends have been ignored.The entry and exit prices are the Open of the week following each trading signal.A brokerage assumption of 0.4% of capital invested has been used for each full trade.Sector risk of a maximum of 3 positions per sector in each direction (long & short).Trading StatisticsFinal CapitalTrades 94,703.86%Gain-5.30%%Maximum Drawdown14.51%Number of Trades% Wins6934.33%Average Win 1,405.97Average Loss 880.28Av Win/Av Loss1.60Average Weeks per trade5.3The past performance of this product is not and should not be taken as an indication of future performance. Caution should beexercised in assessing past performance. This product, like all other financial products, is subject to market forces andunpredictable events that may adversely affect future performance.
Trades - 2011 Simulation portfolio Starting capital is 100,000. Dividends have been ignored.The entry and exit prices are the Open of the week following each trading signal.A brokerage assumption of 0.4% of capital invested has been used for each full trade.Sector risk of a maximum of 3 positions per sector in each direction (long & short).Share codes ending with a ‘2’ are 2nd wave rialsNo ClassMaterialsNo CDEnergyIndustrialsNo ergyNo ClassCSIndustrialHealthcareEnergyIndustrialNo alsNo 5961,8015,6644,4212,5043,0933,1826,8388453,742 1.510 7.700 3.200 1.180 38.750 4.230 0.550 0.305 3.460 3.000 9.600 3.430 1.172 1.160 5.110 1.020 1.130 6.300 28.363 6.630 0.855 0.440 9.800 0.355 0.338 0.470 4.390 2.230 8.260 1.725 3.360 4.730 1.510 8.790 76.500 12.300 0.340 2.950 28.830 4.300 1.370 4.060 1.660 5.100 1.600 1.545 3.140 1.060 7.170 1.135 3.400 2.250 3.120 2.470 12.900 4.040 1.125 3.180 1.895 19.950 6.150 1.285 2.060 1.455 4.250 1.650 2.140 10.670 2.440Trade ValueInc. Costs 19,861.00 11,290.40 19,584.40 9,940.20 19,605.40 18,827.19 17,709.15 11,169.98 16,720.18 8,584.80 17,147.60 17,119.33 9,013.78 14,835.68 11,708.22 4,830.50 7,743.93 10,635.30 14,519.78 18,931.72 18,247.83 10,046.88 16,058.40 14,247.97 11,612.48 6,736.45 16,886.09 8,064.86 17,009.66 10,445.60 8,694.08 13,312.98 8,745.05 14,253.05 16,152.40 11,980.60 7,917.54 19,129.85 12,720.09 5,699.20 10,543.45 10,586.62 7,094.26 9,752.40 10,095.20 13,717.64 12,749.36 12,768.02 9,868.94 5,924.54 15,824.20 4,844.90 6,780.24 19,584.39 9,597.70 16,310.44 6,624.93 13,378.20 6,082.72 11,938.20 11,031.35 7,248.64 9,070.46 3,628.52 13,198.45 5,271.50 14,692.52 9,052.55 ceTradeValue 1.450 7.230 3.290 1.145 39.230 4.340 0.640 0.335 3.230 2.620 8.910 2.960 1.162 1.230 5.130 1.250 1.225 7.040 29.331 6.540 0.810 0.390 9.890 0.360 0.445 0.410 4.060 2.020 7.980 1.345 2.660 3.550 1.425 8.020 73.990 11.100 0.295 2.690 24.170 3.560 1.200 3.780 1.610 3.340 1.575 1.475 2.580 1.085 7.430 1.190 2.870 1.910 3.300 2.440 11.880 3.540 0.960 2.700 1.790 18.770 4.450 1.385 2.080 1.100 3.950 1.420 2.210 10.300 2.370 18,995.00 10,526.88 20,217.05 9,606.55 19,928.84 19,239.22 20,524.16 12,219.46 15,545.99 7,467.00 15,850.89 14,714.16 8,972.96 15,667.74 11,706.66 5,943.75 8,429.23 11,932.80 15,076.13 18,599.76 17,216.55 8,869.38 16,140.48 14,390.64 15,227.01 5,852.75 15,553.86 7,276.04 16,366.98 8,177.60 6,910.68 10,032.30 8,286.38 12,952.30 15,685.88 10,855.80 6,838.40 17,514.59 10,707.31 4,699.20 9,198.00 9,816.66 6,908.51 6,412.80 9,897.30 13,043.43 10,433.52 13,016.75 10,268.26 6,236.79 13,411.51 4,129.42 7,200.60 19,268.68 8,803.08 14,234.34 5,630.40 11,313.00 5,722.63 11,186.92 8,014.45 7,844.64 9,195.68 2,754.40 12,217.35 4,518.44 15,111.98 8,703.50 8,868.54Week 4421336156727710541613544421 Profit/Loss- 866.00- 763.52- 632.65- 333.65- 323.44 412.03 2,815.01 1,049.48- 1,174.19- 1,117.80- 1,296.71- 2,405.17 40.82 832.06- 1.56- 1,113.25- 685.30- 1,297.50- 556.35- 331.96- 1,031.27- 1,177.50 82.08 142.67 3,614.53- 883.70- 1,332.23- 788.82- 642.68 2,268.00 1,783.40 3,280.68 458.67- 1,300.75 466.52 1,124.80- 1,079.15 1,615.26 2,012.78- 1,000.00- 1,345.45- 769.96 185.75 3,339.60- 197.90- 674.21- 2,315.84 248.72- 399.32- 312.26 2,412.69 715.48- 420.36- 315.71- 794.62- 2,076.10- 994.53- 2,065.20- 360.09- 751.28 3,016.90- 596.00- 125.22 874.12- 981.10- 753.06 419.46- 349.05 %-7.43%-14.29%2.85%-3.86%2.47%
2012 – Simulation portfolio Starting capital is 100,000. Dividends have been ignored.The entry and exit prices are the Open of the week following each trading signal.A brokerage assumption of 0.4% of capital invested has been used for each full trade.Sector risk of a maximum of 3 positions per sector in each direction (long & short).Trading StatisticsFinal Capital%Gain%Maximum DrawdownNumber of Trades% WinsTrades 118,055.8618.06%7.7%5935.59%Average Win 1,920.71Average Loss 586.29Av Win/Av Loss3.28Average Weeks per trade6.0sThe past performance of this product is not and should not be taken as an indication of future performance. Caution should beexercised in assessing past performance. This product, like all other financial products, is subject to market forces andunpredictable events that may adversely affect future performance.
Trades - 2012 Simulation portfolio Starting capital is 100,000. Dividends have been ignored.The entry and exit prices are the Open of the week following each trading signal.A brokerage assumption of 0.4% of capital invested has been used for each full trade.Sector risk of a maximum of 3 positions per sector in each direction (long & short).Share codes ending with a ‘2’ are 2nd wave ITIndustrialsNo ClassCDNo ClassCDIndustrialsEnergyHealthcareNo erialsMaterialsCSMaterialsNo lsNo ClassMaterialsNo 647,7121,332 0.880 0.555 0.560 3.190 17.700 3.630 14.950 4.890 30.900 3.820 8.440 1.545 2.280 7.990 3.020 1.255 4.160 4.790 4.120 2.740 2.580 5.600 1.950 11.730 10.800 1.220 9.389 2.480 9.900 2.450 7.810 2.400 4.610 3.200 13.800 4.630 2.600 8.250 25.900 0.750 13.900 2.200 3.320 8.460 5.090 1.585 5.710 1.680 2.910 4.670 3.450 1.410 7.880 2.150 10.350 1.440 10.700 1.320 8.990Trade ValueInc. Costs 16,870.72 10,923.11 10,910.96 19,880.33 13,506.00 14,865.97 12,443.55 21,102.02 12,688.50 7,559.62 12,422.64 10,936.25 19,666.28 12,008.63 7,171.10 17,265.21 17,279.12 10,862.83 21,146.24 11,202.48 10,465.94 13,586.80 5,473.10 17,781.06 21,350.80 18,697.28 15,318.73 20,968.48 14,661.30 12,778.95 14,616.64 5,199.20 9,339.14 11,432.00 21,379.40 8,283.86 13,898.40 21,420.50 18,151.00 9,647.80 8,024.50 17,121.00 10,683.40 7,525.96 9,873.48 16,493.34 20,942.63 13,362.56 20,478.19 9,372.93 22,262.35 9,593.97 19,082.96 9,103.35 21,822.60 9,228.72 12,504.80 10,221.04 2OpenOpenOpenPrice 1.250 0.515 0.570 3.960 16.930 3.560 14.570 4.910 30.500 3.080 8.500 1.400 2.250 8.000 2.940 1.195 3.650 3.040 3.800 2.590 2.050 5.680 2.050 11.730 11.450 1.270 9.074 3.080 9.660 2.270 7.900 2.280 5.040 3.340 13.400 5.290 3.240 8.050 25.570 0.945 13.600 2.150 3.440 7.800 4.790 1.960 5.640 2.010 2.740 4.460 3.400 1.370 8.070 2.050 10.900 1.420 10.800 1.290 8.990TradeValue 23,867.50 10,095.03 11,061.42 24,579.72 12,866.80 14,521.24 12,078.53 21,103.18 12,474.50 6,070.68 12,461.00 9,870.00 19,329.75 11,976.00 6,953.10 16,373.89 15,100.05 6,922.08 19,425.60 10,546.48 8,349.65 13,836.48 5,776.90 17,853.06 22,545.05 19,385.28 14,745.25 25,936.68 14,248.50 11,792.65 14,725.60 4,959.00 10,251.36 11,980.58 20,676.20 9,426.78 17,249.76 20,817.30 17,847.86 12,107.34 7,820.00 16,664.65 11,025.20 6,910.80 9,254.28 20,313.44 20,602.92 15,923.22 19,204.66 8,915.54 21,851.80 9,284.49 19,464.84 8,644.85 22,890.00 9,063.86 12,571.20 9,948.48 11,974.68Week 291421342347563111 Profit/Loss%Gain/Loss 6,996.78 41.47%- 828.08-7.58% 150.461.38% 4,699.39 23.64%- 639.20-4.73%- 344.73-2.32%- 365.02-2.93% 1.160.01%- 214.00-1.69%- 1,488.94 -19.70% 38.360.31%- 1,066.25 -9.75%- 336.53-1.71%- 32.63-0.27%- 218.00-3.04%- 891.32-5.16%- 2,179.07 -12.61% 3,940.75 36.28%- 1,720.64 -8.14%- 656.00-5.86% 2,116.29 20.22%- 249.68-1.84%- 303.80-5.55%- 72.00-0.40% 1,194.255.59% 688.003.68%- 573.48-3.74% 4,968.20 23.69%- 412.80-2.82%- 986.30-7.72% 108.960.75% 240.204.62%- 912.22-9.77%- 548.58-4.80%- 703.20-3.29% 1,142.92 13.80% 3,351.36 24.11%- 603.20-2.82%- 303.14-1.67% 2,459.54 25.49%- 204.50-2.55%- 456.35-2.67% 341.803.20%- 615.16-8.17%- 619.20-6.27% 3,820.10 23.16%- 339.71-1.62% 2,560.66 19.16%- 1,273.53 -6.22%- 457.39-4.88%- 410.55-1.84%- 309.48-3.23% 381.882.00%- 458.50-5.04% 1,067.404.89%- 164.86-1.79% 66.400.53%- 272.56-2.67%- 48.40-0.40%
2013 – Simulation portfolio Starting capital is 100,000. Dividends have been ignored.The entry and exit prices are the Open of the week following each trading signal.A brokerage assumption of 0.4% of capital invested has been used for each full trade.Sector risk of a maximum of 3 positions per sector in each direction (long & short).Trading StatisticsFinal Capital%Gain%Maximum DrawdownNumber of Trades% WinsTrades 121,885.1921.89%7.7%6045.00%Average Win 1,690.61Average Loss 720.03Av Win/Av Loss2.35Average Weeks per trade5.7The past performance of this product is not and should not be taken as an indication of future performance. Caution should beexercised in assessing past performance. This product, like all other financial products, is subject to market forces andunpredictable events that may adversely affect future performance.
Trades - 2013 Simulation portfolio Starting capital is 100,000. Dividends have been ignored.The entry and exit prices are the Open of the week following each trading signal.A brokerage assumption of 0.4% of capital invested has been used for each full trade.Sector risk of a maximum of 3 positions per sector in each direction (long & short).Share codes ending with a ‘2’ are 2nd wave LD2AUTsCTD2LLC2BEN2BTTTPI2SectorEnergyCDNo TFMaterialsIndustrialNo ClassFinancialsCDCDNo alMaterialsITIndustrialCDHealthcareNo ClassFinancialCDFinancialNo ClassHealthcareNo ClassNo ClassIndustrialMaterialsNo ce36,850 0.4554,810 3.7001,670 11.8504,830 3.6609,850 1.10010,900 1.480990 16.5003,310 5.0509,100 1.6802,020 10.140160 59.0003,860 5.310540 35.600310 66.2704,130 3.430140 146.9602,720 1.1603,310 2.4904,510 3.9802,000 10.4501,590 8.1902,690 1.8505,290 3.9401,860 9.8506,190 2.2703,680 2.950550 39.2905,620 1.1709,650 1.970370 35.2502,150 3.60011,910 1.3003,160 5.940290 44.32024,240 0.3401,560 11.8101,840 11.7602,140 10.1502,340 3.2501,120 10.8503,240 5.700230 47.36040,300 0.3454,250 4.630720 30.8804,370 4.3207,660 1.4161,480 6.0304,200 2.8104,880 3.8102,220 3.9905,600 3.5508,810 1.1652,650 5.0005,770 3.0301,380 5.8801,660 11.0102,000 11.4703,260 5.60016,800 1.155Trade valueInc. costs 16,834.35 17,869.00 19,869.50 17,749.40 10,878.60 16,197.20 16,401.00 16,783.10 15,349.60 20,565.60 9,478.00 20,579.40 19,146.40 20,460.90 14,108.70 20,491.20 3,142.40 8,208.70 18,022.20 20,984.40 12,969.30 4,956.50 20,927.00 18,395.00 13,994.50 10,812.00 21,522.30 6,549.00 19,087.30 13,095.30 7,771.20 15,545.40 18,846.40 12,904.80 8,274.80 18,498.00 21,550.80 21,808.60 7,635.80 12,201.20 18,542.80 10,936.80 13,959.50 19,757.10 22,323.60 18,954.80 10,890.56 8,960.40 11,754.40 18,668.00 8,893.40 19,799.60 10,305.25 13,303.60 17,412.30 8,147.20 18,350.60 23,032.80 18,329.60 19,482.40ExitDatePriceTradeValue08-Feb-13 0.455 16,766.7522-Feb-13 3.900 18,759.0001-Mar-13 12.620 21,075.4018-Jan-13 3.450 16,663.5022-Feb-13 1.200 11,820.0029-Mar-13 1.750 19,075.0015-Feb-13 15.560 15,404.4005-Apr-13 5.380 17,807.8024-May-13 1.810 16,471.0022-Mar-13 9.990 20,179.8005-Apr-13 59.280 9,484.8022-Mar-13 5.050 19,493.0012-Apr-13 37.610 20,309.4010-May-13 70.240 21,774.4031-May-13 3.080 12,720.4026-Apr-13 137.670 19,273.8021-Jun-13 0.695 1,890.4012-Jul-13 1.020 3,376.2003-May-13 3.860 17,408.6010-May-13 10.150 20,300.0005-Jul-13 4.500 7,155.0005-Jul-13 1.900 5,111.0024-May-13 3.500 18,515.0024-May-13 9.550 17,763.0028-Jun-13 2.380 14,732.2009-Aug-13 2.090 7,691.2026-Jul-13 40.340 22,187.0005-Jul-13 1.350 7,587.0006-Sep-13 2.310 22,291.5005-Jul-13 35.000 12,950.0019-Jul-13 3.800 8,170.0009-Aug-13 1.380 16,435.8009-Aug-13 6.030 19,054.8009-Aug-13 42.400 12,296.0023-Aug-13 0.320 7,756.8030-Aug-13 10.820 16,879.2023-Aug-13 13.300 24,472.0020-Sep-13 9.990 21,378.6004-Oct-13 3.180 7,441.2011-Oct-13 10.660 11,939.2025-Oct-13 5.900 19,116.0004-Oct-13 47.510 10,927.3008-Nov-13 0.465 18,739.5008-Nov-13 4.870 20,697.5015-Nov-13 32.290 23,248.8001-Nov-13 4.300 18,791.0013-Dec-13 1.980 15,166.8015-Nov-13 5.960 8,820.8027-Dec-13 2.430 10,206.0029-Nov-13 3.790 18,495.2022-Nov-13 3.680 8,169.6027-Dec-13 3.330 18,648.00Open 1.150 10,131.5013-Dec-13 4.580 12,137.00Open 3.020 17,425.4013-Dec-13 5.450 7,521.0013-Dec-13 10.550 17,513.00Open 11.750 23,500.00Open 5.750 18,745.00Open 1.170 19,656.00Week 098493942784732221 90 6.07%-1,085.90 -6.12%941.408.65%2,877.80 17.77%-996.60-6.08%1,024.70 6.11%1,121.40 7.31%-385.80-1.88%6.800.07%-1,086.40 -5.28%-1,163.00 -6.07%-1,313.50 -6
The following table shows the system results of all trades identified by the Breakout Trading Strategy for 2009 to 2020. This includes breakout trades and 2nd Wave trades using the following criteria: ¾ Position sizes have been based on 100,000 trading ca