Transcription
Electrocardiogram (EKG) InterpretationWWW.RN.ORG Reviewed March, 2022 – Expires March, 2024Provider Information and Specifics available on our WebsiteUnauthorized Distribution Prohibited 2022 RN.ORG , S.A., RN.ORG , LLCWanda Lockwood, RN, BA, MAPurpose:The purpose of this course is to familiarize the nurse with different types ofEKGs and the EKG waveform and to help the nurse to identify both normaland abnormal EKG findings.Goals:Upon completion of this course, the nurse should be able to:Describe heart anatomy.Describe the flow of blood through the heart.Outline the 5 phases of the cardiac cycle.Describe cardiac conduction.Describe the 5 phases of cardiac depolarization-repolarization.Draw and label the normal EKG waveform, P to U and explain eachpart of the wave.Discuss how different leads represent the heart.Explain placement of electrodes for 12-lead, 5-lead, and 3-lead EKGs.Outline 9 steps in interpreting the EKG.Describe EKG characteristics of atrial fibrillation, atrial flutter,wandering atrial pacemaker, and premature atrial complex.Describe EKG characteristics of sinus bradycardia and 4 types of heartblock.Describe EKG characteristics of junctional rhythm, ventricularfibrillation, different types of ventricular tachycardia, and prematureventricular complex.Describe the difference between RBBB and LBBB.Describe asystole and pulseless electrical activity.Introduction:
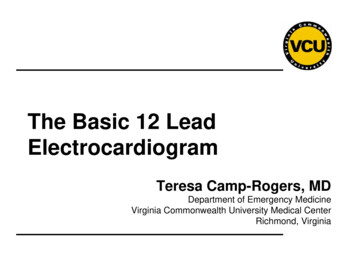
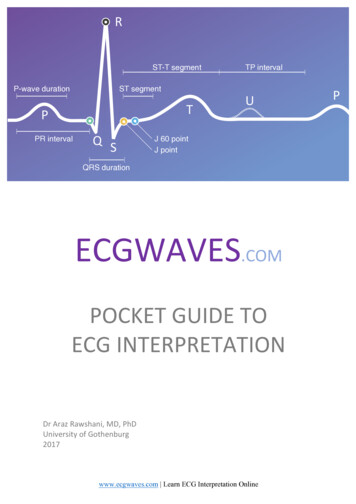
An electrocardiogram (EKG, ECG) is a record of the electrical activity of theheart. While the EKG cannot provide information about the mechanicalfunctioning of the heart, it can demonstrate the rate and rhythm andabnormalities in conduction. Additionally, changes inthe EKG may indicate enlargement of the heartchambers, cardiac ischemia or injury, cardiac infarctand electrolyte disorders as well as the effects of somedrugs.The heart is about 9 by 12 cm in size in the averageadult and weighs 9 to 12 ounces (250-350 g). Whilenewborns have only about 0.2 liters (one cup) of bloodcirculating, children over 5 or 6 and adults have about4.5 to 5.5 liters of blood circulating.With each heartbeat, the heart pumps about 60 to 90 mL resulting incirculation of 5 to 7 liters of blood every minute and 7600 liters per day withan average heart rate of 70 beats per minute. The normal heart ejects about65% of the intraventricular volume in each cardiac cycle (referred to as theejection fraction).The heart lies in the mid chest with about one-third to the right of midlineand two-thirds to the left. The top of the heart is at the second intercostalspace and the apex at the fifth intercostal space in the adult. The infant’sheart is more horizontal than the adult’s, and the apex is at the left fourthintercostal space. By age 7, the child’s heart is positioned as the adult’s.Blood circulation:Blood enters the heart throughthe superior vena cava into theright atrium. When the pressurein the right atrium exceeds thatof the pressure in the rightventricle, the tricuspid valveopens, allowing the blood to flowinto the ventricle until thepressure increases in theventricle, forcing the tricuspid valve to close.Meanwhile, the increased pressure in the right ventricle opens thepulmonary (pulmonic) valve (a semilunar valve) so the blood can enter the
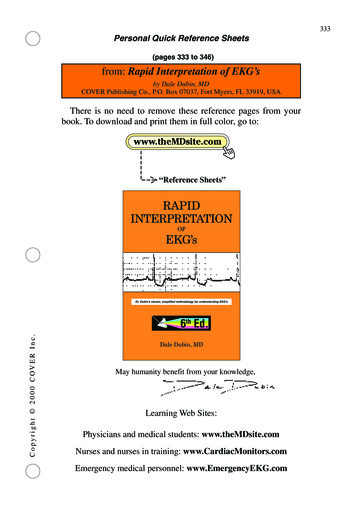
pulmonary artery and circulate in the lungs to exchange carbon dioxide foroxygen, returning to the heart through the pulmonary vein to the leftatrium.The increased pressure in the left atrium opens the mitral valve (AKAbicuspid valve) and the blood fills the left ventricle. As the pressureincreases in the left ventricle, the mitral valve closes, the ventricles contract,and the aortic valve (also a semilunar valve) opens, and the blood enters theaorta and the general circulation. The time during which the left ventricle isfilling with blood is referred to as diastole and pumping blood into the aortaas systole.The atria contract simultaneously rather than sequentially and so do theventricles: Both atria contract (lub) and then both ventricles (dub). Whenauscultating the heart, the heart sounds are those of the valves closing.The coronary ostium is a small opening in the aorta that lies near the aorticvalve. When the aortic valve is closed and the left ventricle is filling, bloodflows through the coronary ostium and to the coronary arteries, so that theheart muscle is nourished first.The cardiac cycle described above can be divided into 5 phases:1. Isovolumetric ventricular contraction: With ventricular depolarization,pressure increases in the ventricles and the tricuspid and mitral valvesclose while the pulmonic and aortic valves remain closed as well.2. Ventricular ejection: The pulmonic and aortic valves open, and theventricles eject blood (ventricular systole).3. Isovolumetric relaxation: The pulmonic and aortic valves close, thepressure in the ventricles falls, and the tricuspid and mitral valvesremain closed. The atria fill (atrial diastole).4. Ventricular filling: The tricuspid and mitral valves open and theventricles fill with about 70% of ventricular volume (ventriculardiastole).5. Atrial systole (atrial kick): Provides the additional 30% of blood for theventricles. The atrial kick (contraction of the atria) occurs withdepolarization of atrial myocardial cells at the sinoatrial node (P wave)and is essential for adequate filling of the ventricles.Cardiac conduction:In the normal heart, electrical impulses originate in the upper right atrium atthe sinoatrial (SA) node (AKA the cardiac pacemaker). As the impulse leaves
the SA node, it travelsthrough Bachman’sbundle to the left atriumand down the internodaltracts to theatrioventricular (AV)node and from theredown the Bundle of Histo the bundle branchesand ventricles, and tothe Purkinje fibers.Because the muscle of the left ventricle is thicker than that of the right, theimpulses travel more rapidly down the left bundle branch than the right sothat the ventricles can contract at the same time.A fibrous ring that does not conduct electrical impulses separates the atriafrom the ventricles, so impulses must pass through the AV node to reach theventricles (the reason an AV block may be life-threatening).The SA node at rest fires 60 to 100 times in adults per minute and 60 to190 times per minute in infants and children (depending on the age andlevel of activity) while the junctional tissue about the AV node (cardiacbackup pacemaker) fires 40 to 60 times per minute in the adult and 50 to 80times per minute in children younger than 3. The primary role of the AVnode is to delay impulses by about 0.04 second so that the ventricles can filladequately and don’t contract too rapidly.The Purkinje fibers not only conduct impulses but can also serve as a backuppacemaker, able to discharge between 20 to 40 times per minute in theadult and 40 to 50 times per minutes in children under age 3. Pacemakercells in the junctional tissue (about the AV node) and the Purkinje fibers areusually not triggered unless conduction above is blocked. When impulses aretransmitted backward toward the atria instead of downward from the atria,this is referred to as retrograde conduction.The ability of cells, such as the SA and AV nodes to spontaneously initiate animpulse is referred to as automaticity. The degree of cell response (resultingfrom ion shifts) is the excitability. The ability of cells to transmit electricalimpulses is their conductivity, and the degree of contraction in response tothe electrical impulse is the contractility.
The heart goes through 5 phases of depolarization-repolarization:0: Period of rapid depolarization (contraction) during which sodiumand calcium channels are open and sodium moves quickly into the celland calcium more slowly.1: Early repolarization during which the sodium channels close.2: Plateau phase in which calcium continues to flow into the cell andpotassium flows out. (Note that phases 1, 2, and the beginning of 3are referred to as the refractory period because no stimulus canexcite/depolarize the cell).3: Rapid repolarization during which calcium channels close butpotassium flows out of the cell at increased speed. (The last half ofthis phase is the relative refractory period because a strong stimulusmay excite/depolarize the cell.4: Resting phase during which the sodium-potassium pump allowspotassium inside the cell and sodium outside while the cell becomesimpermeable to sodium. Some potassium may flow out of the cell. Thecell prepares for a stimulus. Note: When no electrical activity is takingplace, the cells are considered polarized.
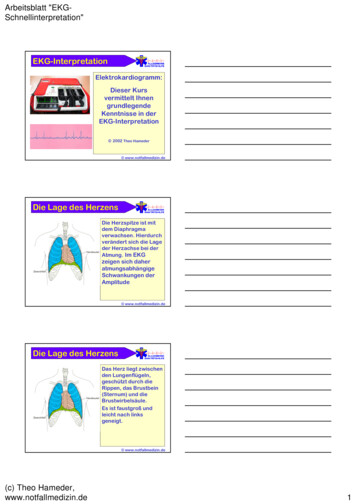
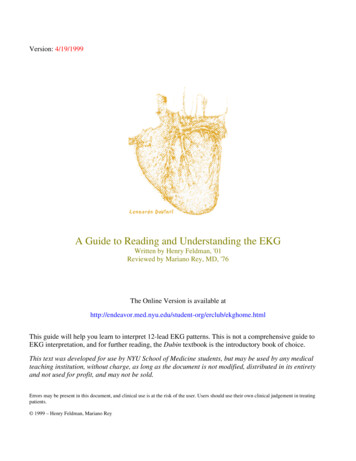
Electrocardiogram and conductionOn the EKG tracing, the baseline is referred tothe isoelectric line because there is no voltageduring this time. P-wave: represents atrial depolarization(which causes contraction) as the electricalimpulse spreads from the SA node through the atria (usually 0.08 to0.10 second). Isoelectric period: A brief period follows the P wave and representsthe time in which the impulse is traveling within the AV node (whereconduction slows) and the bundle of His. P-R interval: Extends from the beginning of the P wave until thebeginning of the QRS complex and reflects the time between the onsetof atrial depolarization and the onset of ventricular depolarization. Theduration usually ranges from 0.12 to 0.20 second. P-R segment: Extends from the end of the P wave until the beginningof the QRS complex and reflects an isoelectric period. QRS complex: Represents ventricular depolarization (contraction).The Q is downward deflection; R, upward, and S down (in most leads).The duration is usually 0.06 to 0.10 second. Prolongation of the QRSsegment indicates impaired conduction. The shape of the QRSsegment on the EKG tracing may vary from that above depending onthe lead used or the presence of abnormal conduction. Atrialrepolarization occurs during this time as well. ST segment: This isoelectric period represents a time period duringwhich the ventricles are completely depolarized (plateau phase). TheST segment may be depressed or elevated with ischemia or hypoxia. T wave: Represents ventricular repolarization.
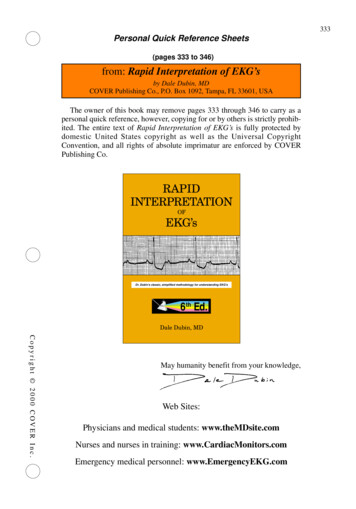
Q-T interval: Represents the total time of ventricular depolarizationand repolarization (from the beginning of the QRS segment to the endof the T wave). The duration is usually 0.2 to 0.40 second, but varieswith heart rates. The higher the heart rate, the shorter the duration. U wave: This wave is sometimes present and represents remainingventricular repolarization.Electrocardiogram basicsThe electrocardiogram is recorded onspecial EKG paper or strips divided intolarge squares containing 25 smallsquares. On the horizontal axis, eachsmall square is equal to 1 mm/0.04second and each large square 5mm/0.20 second on. So, a distance offive large squares is equal to 1 second.On the vertical axis, 5 mm (5 smallsquares) is equal to 0.5 mV. Thus, the vertical axis recordsamplitude/voltage; and the horizontal axis, time. Since one large squarecontaining 5 small squares horizontally equals 0.20 second, 5 large squaresequal one second.The terms electrode and lead are sometimes used interchangeably, but theelectrode is the disk with conductive gel that is placed on the patient’s skinto record electrical impulses, which are converted by the electrocardiograminto a waveform. A lead, on the other hand, is the view of the electricalactivity of the heart between a positive and negative pole. Therefore, thewaveform may change direction or height in different leads. For example, acomparison of leads I, II, and III shows typical differences.If electrical current travels toward a negative pole, the waveform deflectsprimarily downward and if toward a positive pole, the waveform deflectsupward. If the current is perpendicular to the lead, the waveform may besmall in comparison to other leads or may go in both directions (biphasic).
That is, if the heart’s electrical activity moves away from a positive electrode(toward negative), a negativedeflection occurs. If the heart’selectrical activity moves toward apositive electrode (away fromnegative), a positive deflectionoccurs.It’s important to know that electrodesare labeled and color-coded and thelabels and colors should always beverified before placement ofelectrodes. However, there are twoorganizations that have establishedlabeling and color-coding standards:The American Heart Association andthe International ElectrotechnicalCommission. These organizations usesimilar colors but in differentconfigurations.When performing an electrocardiogram or monitoring cardiac status,electrodes should be placed over dry, clean skin with adequate conductivegel.The skin can be wiped with alcohol swabs, thoroughly dried, and thenexfoliated with exfoliation paper. In some cases, hair may need to be clippedor shaved. Electrodes should not be placed directly over bone, scars,incisions, or irritated skin. The area of placement should be vigorously wipedwith gauze to remove dead skin and to dry if skin is moist.When placing electrodes about the heart, it’s essential to always palpate andcount the intercostal spaces to ensure proper placement. The firstintercostal space is the space palpable immediately below the clavicle.12-lead EKGThe 12-lead electrocardiogram utilizes 10electrodes but obtains 12 different views ofthe heart’s electrical activity. Some leadshave positive deflections (above isoelectricline) and others negative (below isoelectricline).
4 limb electrodes: RA, LA, RL, LL. These electrodes should avoidheavily muscled areas. Limb leads should be placed symmetrically andcan be placed on any part of the limb. However, if (for example), thearm electrodes are placed high on the upper arm, then the limbelectrodes should be placed on the thighs; but, if the arm electrodesare placed lower, above the wrists, the leg electrodes should be alsobe placed lower, above the ankles. The right leg electrode provides aground (neutral).Note that protocols for placement of limb leads may vary somewhat. Some,for example, place all electrodes on the trunk. The RA and LA leads may beplaced on the right and left upper chest near the shoulders and the limbleads on the right and left abdomen at about the level of waist, below the ribcage. This placement is especially used if the EKG is to be done withexercise. 6 precordial (in front of the heart/pericardium) electrodes:o V1—Right sternum, 4th intercostal spaceo V2—Left sternum, 4th intercostal space.o V3—Half way between V2 and V4.o V4—Midclavicular line, 5th intercostal space.o V5—In line with V4 at anterior axillary line.o V6—In line with V4 and V5 at midaxillary line.Note that proper placement of the electrodes is essential for properdiagnosis. If, for example, V1 and V2 are too high, this can result in T waveinversion that appears to result from an anterior MI.There are 3 unipolar augmented leads. The aV designation stands for“augmented voltage” because the low voltage must be augmented by theEKG machine in order to be visible. aVR: Positive electrode on right arm, producing a negative deflection.This lead may be used to show occlusion of the left main coronaryartery. aVL: Positive electrode on left arm, producing a positive deflection.Provides a superior or high lateral view of the heart wall. aVF: Positive electrode on the left foot, producing a positive deflectionand an inferior view of the heart wall.
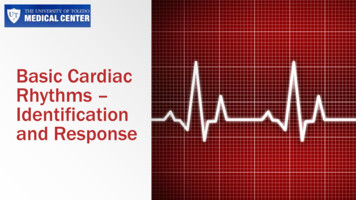
3- and 5- lead EKGThree and five electrodeplacements are commonly usedfor cardiac monitoring. Generally,a baseline 12-lead EKG should betaken prior to beginning cardiacmonitoring.For both 3 and 5-lead cardiacmonitoring, usually all electrodesare placed on the trunk. RA and LAare usually placed on the lateralchest at the level of the 2ndintercostal space. For 5-leadmonitoring, V1 is placed at the 4thintercostal space on the right ofthe mediastinum. The RL and LVlimb electrodes are generallyplaced below the rib cage on theright and left sides.With three lead EKGs/monitoring, the limb electrode (LL) is the ground andcan actually be placed anywhere away from the active leads. Placement ofthe active electrodes may vary somewhat depending on the lead to berecorded.Because manufacturers may vary somewhat, it’s important to always checkmanufacturer’s instructions regarding the use of any monitoring system toensure that electrode placement is correct and the equipment is correctlycalibrated.Einthoven’s triangleThe limb leads view the heart in the vertical plane; and the chest leads, thechest leads, the horizontal.Lead I: Right arm—left arm. (Anterior view)Lead II: Right arm—left leg. (Inferior view)Lead III: Left leg—left arm. (inferior view)
aVR lead: Right arm.aVL lead: Left arm. (Anterior view)aVF lead: Left leg. (inferior view)V1 to V3: Anterior view.V3 to V4: Septal view.V4 to V6: Lateral view.Electrodes are placed in positions referred to as Einthoven’s triangle. Notethat leads I, II, and III form the three sides of an equilateral triangle.Compare the different leads for a normal sinus rhythm in the illustrationbelow. Note again that the defection (up or down) depends on whether theelectrical activity is moving toward or away from a lead.
Lead II is the most commonly used for monitoring, so many EKG examplesreflect those represented by lead II. If two leads are monitored, then leadsII and V1 are most commonly used.Steps to interpreting the EKGBefore beginning to interpret EKGs, it’s important to first recognize a normalsinus rhythm because this is the baseline to which all other rhythms arecompared.Characteristics The rhythm is regular and the heartrate between 60 and 100. All P waves are of similar size and shape and upright (lead II) and a Pwave is present before every QRS complex. QRS complexes are all similar in size and shape. The R-R interval (0.12-0.20 second) and Q-T interval ( 0.12 second) arewithin normal parameters. T waves are upright and round (lead II). No abnormal beats are evident.Step 1: Assess rhythm
The rhythm is assessed to determine if it is regular or irregular. Assessingthe rhythm is relatively easy and can often be determined simply by lookingat the R waves on the EKG strip, but both the atrial rhythm (P to P) and theventricular rhythm (R to R) should be assessed as they may vary with somearrhythmias. The rhythm can be assessed by counting large or smallsquares between waves or by using calipers or ruler to measure thedistances.In the normal sinus rhythm strip above, it’s easy to see that there are 4large squares between each P wave and each R wave, so the rhythm isregular. However, in the rhythm strip below, it’s clear that the distancebetween both P and R waves vary from one beat to another, so the rates areirregular.Step 2: Calculate heartrateHeartrate is easiest calculated by counting the peaks of the P waves (atrialrate) and R waves (ventricular) over a specified period of time. If it’s clearthat both the P waves and the R waves are present and the rhythm isregular, only the R waves need be counted because the R wave is easiest toidentify.Many rhythm strips have small vertical 3-second markers (15 large squaresseparating them); therefore, these strips, such as the example below, are 6seconds long, so calculating the heart rate is fairly straight forward forregular rhythms: count the rate for 3 seconds and multiply by 20 or for 6seconds and multiply by 10. It the rhythm is irregular, then count for thelonger period.Every 5 small horizontal squares or one large square equals one second.Three beats per 3 seconds equal 60 beats per minute (3 X 20 60) and 4beats per 3 seconds equal 80 beats per minute (4 X 20 80). Heartmonitors automatically calculate the heartrate.
The heartrate is easy to estimate by using a sequencing method bymemorizing the following chart and counting backward from 300 for everylarge square between the matching wave, such as from R to R. This methodis easier to use if beginning the count on a wave that lines up even with avertical line. 1 large square: 300 bpm. 2 large squares: 150 bpm. 3 large squares: 100 bpm. 4 large squares: 75 bpm. 5 large squares: 60 bpm. 6 large squares: 50 bpm. 7 large squares: 43 bpm 8 large squares: 37 bpm.If, for example, there were 4 and a halfboxes between waves, then the heartratewould be between 75 and 60.Heartrates above 100 are classified as tachycardia and below 60 asbradycardia.Step 3: Assess P waveThe P wave reflects atrial contractions. The P wave should be smooth,rounded and upright and not notched or inverted and should be presentbefore each QRS. The normal amplitude is between 0.5 and 2.5 mm in leadII and equal to or less than 0.12 second in duration.(Remember that each small square vertically is equal to 1 mm and eachsmall square horizontally is equal to 0.04 second, so the height may varyfrom half a small square to 2.5 small squares and the width should extendno more than 3 small squares.)Discussion:
The P wave represents activation (depolarization/contraction) of the rightand left atria. The first third represents the right atrium; the middle acombination of both right and left activation, and the final third, the left. Inmost leads, such as lead II, both wavesgo in the same direction, resulting in amonophasic P wave.If, however the right atrium is enlarged,then right atrial activation may takelonger than left atrial activation so thatthe waveform from the right extends tothe end of the left activation, resulting ina P wave that is higher than normalbecause the two waveforms arecombined. If, on the other hand, the leftatrium is enlarged, the right atrialactivation time is normal but the left atrialactivation time is extended, resulting in alonger than normal P wave (which may benotched).Remember that the appearance of the P wave varies depending on the lead.It is upright (positive) in leads I, II, V4-6, aVL, -aVR and aVF but variable inleads III and V1-3 and inverted (negative) in lead aVR.The wave may be biphasic in V1 and sometimes V2. This means that thewaveform of right atrial activation and the left atrial activation move inopposite direction, so the initial (right) deflection is positive and the second(left) is negative.If the P wave is missing, this can mean that thereis a block masking the P wave. P waves that arenot originating in the SA node may result inabnormally (saw tooth, flat, pointed, biphasic,notched, or inverted).If P waves originate in the AV junctional tissue,they are inverted and may be located before theQRS complex, hidden in the QRS complex. or may even follow the QRScomplex. With tachycardia, the P wave is often not visible.
Step 4: Assess P-R IntervalThe P-R interval reflects the conduction system of the heart from the SAnode through the atria, AV node, and His-Purkinje system. The P-R intervalis more accurately a P-Q interval because it extends from the beginning ofthe P wave to the beginning of the QRS complex, that is from the beginningof contractions of the atria to beginning of contractions of the ventricles.The normal duration of the P-R interval is 0.12 second (3 small squares) to0.20 second (5 small squares). Assessment should determine if the P-Rinterval is normal, shortened, prolonged, or variable.Discussion:The P-R interval may vary somewhat in normal physiologic states. Forexample, if the sympathetic nervous system activates and the pulseincreases, the P-R interval shortens as conduction through the AV nodespeeds up. With deactivation, as the pulse slows, conduction also slows, sothe P-R interval is prolonged. However, evenwith this variability, the P-R interval usuallystays within normal parameters if there is nounderlying cardiac abnormality.If the P-R interval is shortened to less than0.12 second, this generally indicates that theelectrical conduction has bypassed the normalpathway (SA node through AV node) and the impulses have been conductedthrough accessory conducting tissue directly from the atria to the ventricles.This conducting tissue may lie between the atria and ventricles (WolffParkinson White Syndrome), between the atria and the AV node, or betweenthe AV node and the ventricles.With the Wolff-Parkinson-White syndrome, the short P-R interval presents adelta wave, which has a slurred upstroke into theQRS complex, which is prolonged.Shortened P-R intervals are often associated withparoxysmal supraventricular tachycardia andpalpitations and other EKG abnormalities.IF the P-R interval is prolonged to greater than 0.20second, this can represent heart block. Somemedications, such as beta blockers, can result in prolongation of the P-Rinterval. Additionally, some very well-conditioned athletes may develop a
normal prolonged P-R interval. Occasional prolonged P-R intervals areusually asymptomatic.If the P-R interval before each QRS is uniformly prolonged, this generallyindicates first degree heart block. If the P-R intervals are progressivelyprolonged until the P wave disappears, this represents second-degree AVblock (Mobitz type I), which is usually reversible with treatment. Thirddegree AV block (Mobitz II), however, (characterized by missing QRS) isusually not reversible and requires a permanent pacemaker.Step 5: Assess QRS complexThe QRS complex, which represents ventricular contraction and is the largestpart of the wave, is 0.06 to 0.12 second (3 squares) in duration. Amplitude,based on the height of the R wave, varies from 5 mm in frontal plane leadsto 10 mm or less in precordial leads with lead V4 generally exhibiting thetallest R wave.The Q wave (septal depolarization) is the first negative deflection after the Pwave, with duration of 0.04 second and amplitude less than a third of theamplitude of the R wave on the same lead.; the R wave (ventriculardepolarization), the first positive deflection after the Q wave; and the Swave (Purkinje depolarization), the first negative deflection after the R wave,extending further below the baseline than the Q wave.During assessment, it’s important to check first to see if the QRS complexesare present or absent and that they all follow P waves. Note whether thereare more or fewer P waves that QRS complexes. Survey the amplitude andduration to determine if they are within normal parameters and note if theQRS complexes have an unusual appearance (tall, low, notched, prolonged,chaotic) or are inverted.Note: if the R wave is missing, the complex is referred to as the QScomplex. If the Q wave is missing, the complex is referred to as the RScomplex.Discussion:
Normal sinus rhythm and supraventricular dysrhythmias generally havenormal QRS complexes. Abnormal QRS complexes, produced by abnormalventricular depolarization, can result from a numberof factors.QRS amplitude varies according to the lead andamplitude tends to be higher in males than females.Most QRS complexes with high amplitude results fromventricular hypertrophy,abnormal pacemaker, orbeats conducted aberrantly.Left ventricular hypertrophycan result in increasedamplitude 0.16 secondalthough occasionaldecreased amplitude mayoccur. Increased amplitudemay also occur with rightventricular hypertrophy.Ventricular dysrhythmias mayresult in a wide variety ofbizarre-looking prolongedQRS complexes with T wavesthat that may go in anopposite direction from the Rwaves. Wide QRS complexesmay be associated withidioventricular rhythm,ventricular tachycardia, thirddegree AB heart block, RBBB,and LBBB. Wide QRS complexes are a key finding with ventriculardysrhythmias.
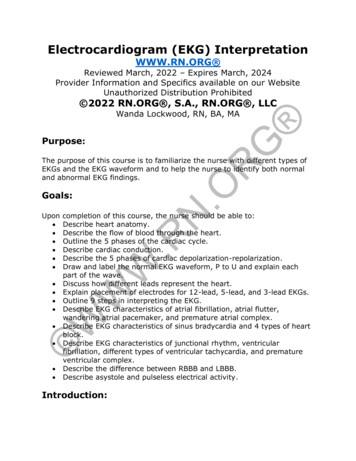
Low-voltage (amplitude) QRS complexes arethose with voltage of less than 5 mm in all limbleads or 10 mm in all precordial leads and mayoccur in patients who are obese or havehyperthyroidism or pleural or pericardialeffusion. Young women who are thin may havelow voltage QRS complexes as a normalvariant. Air, fat, and fluids all have a dampening effect on the QRS complex.Pericardia effusion produces a triad of signs that include low voltage QRS,tachycardia, and electrical alternans (alternate beat variation).Pacemaker-induced QRS complexes are often bizarre in appearance, 0.12second in duration and preceded by a pacemaker spike. When a pacemakeris utilized, no SA impulses go through to the ventricles. If, however, ademand pacemaker is in place and only triggers when the heart rate falls,then the patient’s EKG may not be distinguishable from those without apacemaker except for paced beats.Step 6: Assess ST segmentThe ST segment is an isoelectric periodduring which there is no electrical activity.The ST segment should be even with thebaseline and curve into the T wave. Theduration is 0.005 to 0.15 second (3.75 smallsquares).
Discussion:The point where the ST segment starts is the J (junction) point and is usedalong with the base isoelectric line (PR) to measure the degree ofdisplacement when determining whether there is deviation (elevation,depression) of the ST segment. The ST segment may alter with a number ofdifferent conditions, so it should be carefully assessed. Deviations can occurwith acute cardiac myocardial ischemia.ST-elevation MI (STEMI) is a severe heart attack in which 100% occlusionoccurs in one of the major coronary arteries. With acute transmural injury,such as may occur with an acute anterior MI, the ST segment usually has aconvex upward or straightened appearance rather than concaveST elevation may also be seen with Prinzmetal’s angina, exercise-relatedtransmural ischemia, and ventricular aneurysm after MI with pericarditis, aconcave upwards elevation is found in most leads (except aVR). PR segmentdepression may also occur in conjunction with the ST elevation if there isatrial injury. Other causes of ST elevation include left ventricularhypertrophy and LBBB.The S-T segment may be slightly elevated or high as a normal variant in theprecordial leads V2-V6, so the patient’s symptoms and laboratory findingsmust be assessed as well.
It’s important to realize that non-cardiac conditions, such as increased ICP,stroke, peritonitis, spinal cord injury and pulmonary embolism as well as
An electrocardiogram (EKG, ECG) is a record of the electrical activity of the heart. While the EKG cannot provide information about the mechanical functioning of the heart, it can demonstrate the rate and rhythm and abnormalities in conduction. Additionally,