Transcription
University of the PhilippinesOpen UniversityFundamentals ofPredictive AnalyticsA Business Analytics CourseDr. Eugene Rex JalaoDr. Melinda LumantaMs. Louise Antonette VillanuevaAsst. Prof. Reinald Adrian PugoyAsst. Prof. Mar CruzCourse Writers
University of the PhilippinesOPEN UNIVERSITYCOMMISSION ON HIGHER EDUCATIONUniversity of the PhilippinesOPEN UNIVERSITYFundamentals of Predictive Analytics1
UNIVERSITY OF THE PHILIPPINES OPEN UNIVERSITYFundamentals of Predictive AnalyticsA Business Analytics CourseWelcome, dear students! This course will help you traverse the world of predictiveanalytics. In predictive analytics (also sometimes called data mining), useful patterns canbe extracted from data available which can, in turn, be utilized to predict the future.Moreover, predictive analytics draws ideas from various fields such as machine learning,pattern recognition, statistics, and database systems.Before taking this course, you should have already completed the Fundamentals ofDescriptive Analytics course. And, one more thing! This very document is your courseguide. Kindly read this carefully before embarking on your journey to learn theFundamentals of Predictive Analytics.COURSE OBJECTIVESAt the end of the course, you should be able to:1. Discuss key concepts, frameworks, and algorithms in predictive analytics.2. Identify appropriate predictive analytics/data mining methodologies for differentbusiness problems.3. Utilize appropriate predictive analytics/data mining methodologies to build andvalidate models.4. Evaluate the performance of the predictive model.COURSE OUTLINEMODULE 1: Introduction to Predictive Analytics1. Definition of Predictive Analytics and Data Mining2. Predictive Analytics FrameworkMODULE2: Data Preprocessing1. Definition of Data Preprocessing2. Tasks of Data PreprocessingMODULE 3: Supervised Learning1. Classification MethodologiesFundamentals of Predictive Analytics2
2. Regression Methodologies3. Evaluation and DeploymentMODULE 4: Unsupervised Learning1. Association Rule Mining2. Sequential Pattern Mining3. Clustering4. Text Mining5. Social Media Sentiment AnalysisCOURSE MATERIALSThe course learning package consists of the items listed below. These will be madeavailable for access and download.1. Course Guide2. Study Guides3. Video Lectures/Resources4. Other Digital ReferencesSTUDY SCHEDULEWeekNo.Topic1-2Course Overview;Module 1: Introduction toPredictive AnalyticsActivities Read the Course Guide.Introduce yourself via the SelfIntroduction forum.Go through the Module 1 Study Guide.Watch the following video resources:ooo2-3Module 2: DataPreprocessing Participate in Discussion Forum 1. Go through the Module 2 Study Guide.Watch the following video resources:oFundamentals of Predictive AnalyticsIntroduction to Predictive Analytics (ERLJalao)Supervised Learning vs UnsupervisedLearning (RADL Pugoy)Tools of Data Mining (ERL Jalao)Data Preprocessing (ERL Jalao)3
ooooo4-7Module 3: SupervisedLearning (Classification) Participate in Discussion Forum 2. Go through the Module 3 Study Guide(pp. 1-3).Watch the following video resources: ooooooooo8-9Module 3: SupervisedLearning (Regression)Submit Assignment 1. Go through the Module 3 Study Guide(pp. 3-5).Watch the following video resources:oooooModule 4: UnsupervisedLearningRegression (ERL Jalao)Regression Model Evaluation (ERL Jalao)Indicator Variables (ERL Jalao)Multicollinearity (ERL Jalao)Logistic Regression (ERL Jalao) Submit Assignment 2. Go through the Module 4 Study Guide.Watch the following video resources:oooooo Fundamentals of Predictive AnalyticsClassification (ERL Jalao)Naive Bayes (ERL Jalao)Decision Trees (ERL Jalao)Nearest Neighbours (ERL Jalao)Artificial Neural Networks (ERL Jalao)Support Vector Machines (ERL Jalao)Ensembles (ERL Jalao)Random Forests (ERL Jalao)Model Evaluation (ERL Jalao) 10-12Data Integration (ERL Jalao)Data Transformation (ERL Jalao)Data Encoding (ERL Jalao)Data Cleaning (ERL Jalao)Data Reduction and Manipulation (ERLJalao)Association Rule Mining (ERL Jalao)Sequential Pattern Mining (ERL Jalao)K-Means Clustering (ERL Jalao)Hierarchical Clustering (ERL. Jalao)Text Mining (ERL Jalao)Social Media Sentiment Analysis (ERLJalao)Submit Assignment 3.4
13-14Review and IntegrationParticipate in Discussion Forum 3.15Final ExamAccomplish the Final Exam.COURSE REQUIREMENTSTo earn a digital certificate of accomplishment, you need to satisfactorily complete thefollowing:1. Three (3) discussion forums (20%)Discussion forums or DFs are venues for you to share your thoughts andlearnings and show comprehension of the subject matter at hand. Guidequestions shall be posted for each DF. Each of you is expected to provideinsightful answers, with properly cited references.2.Three (3) assignments (60%)The goal of the assignments is for you to actually apply learned methodologiesand principles to the problem or issue at hand. An assignment may be a positionpaper, modelling exercise, or programming assignment.3.One (1) final exam (20%)The final exam shall serve as your summative assessment, i.e, to evaluateeverything that you have learned all throughout this course.Fundamentals of Predictive Analytics5
MODULE 1: INTRODUCTION TO PREDICTIVE ANALYTICSIntroductionThis is the first module in the course. As such, it gives an overview of what the studentswill be learning in this course as a whole, i.e., predictive analytics. A brief overview onthe principles pertaining to predictive analytics are defined and discussed.Learning ObjectivesAfter working on this module, you should be able to:1. Define what predictive analytics is.2. Discuss the fundamental ideas, concepts, and techniques associated withpredictive analytics.3. Describe the Predictive Analytics Framework.1.1.What is predictive analytics?Predictive analytics (also sometimes called data mining) is the non-trivial extraction ofimplicit, previously unknown, and potentially useful information from the data. In otherwords, useful patterns are extracted from the data, and we hope that these patterns willbe repeated in the future. Another definition of data mining is that it is the explorationand analysis of a large quantity of data to discover meaningful patterns by automatic orsemi-automatic means. Data mining is all about explaining the past to predict the future.Predictive analytics draws ideas from various fields such as machine learning, patternrecognition, statistics, and database systems.Fundamentals of Predictive Analytics6
Learning Resources Video on “Introduction to Predictive Analytics” by Dr. Eugene Rex Jalao.Video on “Predictive Analytics” by Mr. Dominic Ligot.Discussion Forum 1Discuss the potential applications of predictive analytics/data mining in your field of work.1.2.Supervised Learning vs Unsupervised LearningBefore proceeding to the latter parts of the course, it is important to differentiatesupervised learning and unsupervised learning. Supervised learning refers to the task ofinferring a function from supervised (or labeled) training data. Each example in thetraining data is a pair, consisting of the input object and its corresponding label. On theother hand, unsupervised learning pertains to the problem of trying find hiddenstructures in unlabeled data. Since the examples are unlabeled, it can be morechallenging to find and evaluate a potential solution.Learning ResourcesVideo on “Supervised Learning vs Unsupervised Learning” by Asst. Prof.Reinald Adrian PugoyStudy Questions1. How does the DBMS perform the functionalities listed in this module?2. How do the different components of a database system relate to one another?Fundamentals of Predictive Analytics7
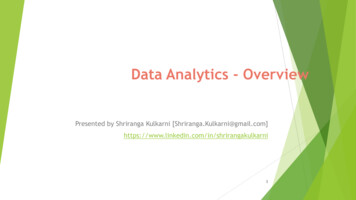
1.3.Tools of Data MiningData mining tools are software usually downloaded or bought from third-party providers.An example of this tool is R, an open-source software that is considered to be the mostutilized tool for data mining and predictive analytics. Other tools include SPSS, RapidMiner, SAS, Excel, and Python, with Python coming closer to R nowadays. Furthermore,it is important to take note that no tool solves all predictive analytics problems. In otherwords, solutions for such problems cannot be implemented by just using a singlesoftware. For this reason, a majority of companies worldwide use both free/open-sourcesoftware and commercial software.Learning ResourcesVideo on “Tools of Data Mining” by Dr. Eugene Rex Jalao.1.4.The Predictive Analytics FrameworkCRISP-DM, which stands for Cross-Industry Standard Process for Data Mining, is a nonproprietary framework that allows us to implement predictive analytics solutions. It is anecessary standard process that ensures that data mining is reliable and can be easilyrepeated by people with little to no data mining background. It also demonstrates thematurity of data mining and reduces dependency on experts. Furthermore, the CRISPDM Model also serves as an aid to project planning and management, and it is alsoconsidered a “comfort factors” for new adopters.The CRISP-DM Model involves several phases. These are:1. Business Understanding - The focus is on understanding the project objectivesand requirements from a business perspective, then converting this knowledgeinto a data mining problem definition and a preliminary plan designed to achievethe objectives.Fundamentals of Predictive Analytics8
2. Data Understanding - It starts with an initial data collection and familiarization.Data quality problems are identified to discover first insights into the data and todetect interesting subsets.3. Data Preparation - This covers all pre-processing activities to construct the finaldataset from the raw data. This process then allows the data to fit into the modelthat will be used to solve a particular problem.4. Modeling - This phase defines the modeling techniques, applications, andparameters to calibrate specific models to solve the problem.5. Evaluation - It identifies and verifies whether the output of the model generatedhas solved the problem. Otherwise, if the model fails to solve, there is a need togo back to the previous phases as the model has to be redefined.6. Deployment - After validating the model, it is then deployed so that the end-usersof the organization will be able to finally utilized and reap the benefits of the datamining solution.Figure 1. Generic tasks and output of the CRISP-DM Model.Learning ResourcesVideo on “CRISP-DM (Cross-Industry Standard Process for Data Mining)” by Dr.Eugene Rex Jalao.Fundamentals of Predictive Analytics9
Assignment 0/Discussion Forum 2Apply the CRISP-DM on the case study to be given by your professor/faculty-in-charge.Share your experience by posting it in our discussion forum."Study QuestionWhy is important for managers to know how to entity relationship diagrams aredesigned?Fundamentals of Predictive Analytics10
MODULE 2: DATA PRE-PROCESSINGIntroductionThis module intends to:1. Introduce basic concepts in data pre-processing; and2. Introduce methods of data pre-processing.2.1.Basic Concepts in Data Pre-processingData preprocessing is an important step in data analytics. It aims at assessing andimproving the quality of data for secondary statistical analysis. With this, the data isbetter understood and the data analysis is performed more accurately and efficiently.Learning ObjectivesAfter studying the basic concepts in data preprocessing, you should be able to:1. Explain what data preprocessing is and why it is important in data analytics; and2. Describe different forms of data preprocessing.A. What is Data Pre-Processing?Data in the real world tend to be incomplete, noisy, and inconsistent. “Dirty” data canlead to errors in parameter estimation and incorrect analysis leading users to draw falseconclusions. Quality decisions must be based in quality data; hence, unclean data maycause incorrect or even misleading statistical results and predictive analysis. Datapreprocessing is a data mining technique that involves transforming raw or source datainto an understandable format for further processing.Fundamentals of Predictive Analytics11
B. Tasks for Data Pre-processingSeveral distinct steps are involved in preprocessing data. Here are the general stepstaken to pre-process data: Data cleaningo This step deals with missing data, noise, outliers, and duplicate orincorrect records while minimizing introduction of bias into the database.o Data is cleansed through processes such as filling in missing values,smoothing the noisy data, or resolving the inconsistencies in the data.Data integrationo Extracted raw data can come from heterogeneous sources or be inseparate datasets. This step reorganizes the various raw datasets into asingle dataset that contain all the information required for the desiredstatistical analyses.o Involves integration of multiple databases, data cubes, or files.o Data with different representations are put together and conflicts withinthe data are resolved.Data transformationFundamentals of Predictive Analytics12
o This step translates and/or scales variables stored in a variety of formatsor units in the raw data into formats or units that are more useful for thestatistical methods that the researcher wants to use.o Data is normalized, aggregated and generalized.Data reductiono After the dataset has been integrated and transformed, this step removesredundant records and variables, as well as reorganizes the data in anefficient and “tidy” manner for analysis.o Pertains to obtaining reduced representation in volume but produces thesame or similar analytical results.o This step aims to present a reduced representation of the data in a datawarehouse.Pre-processing is sometimes iterative and may involve repeating this series of steps untilthe data are satisfactorily organized for the purpose of statistical analysis. Duringpreprocessing, one needs to take care not to accidentally introduce bias by modifyingthe dataset in ways that will impact the outcome of statistical analyses. Similarly, wemust avoid reaching statistically significant results through “trial and error” analyses ondifferently pre-processed versions of a dataset.Learning ResourcesDr. Eugene Rex Jalao’s video on Data PreprocessingActivity 2-1Watch:Dr. Eugene Rex Jalao’s video on Data Preprocessing.Methods of Data Pre-processingData preprocessing consists of series of steps to transform data extracted from differentdata sources into a “clean” data prior to statistical analysis. Data pre-processing includesdata cleaning, data integration, data transformation, and data reduction.Fundamentals of Predictive Analytics13
Learning ObjectivesAfter studying the methods of data processing, you should be able to:1. Understand the different methods of data preprocessing; and2. Differentiate the different techniques of data preprocessing.A. Data IntegrationData integration is the process of combining data derived from various data sources(such as databases, flat files, etc.) into a consistent dataset. In data integration, datafrom the different sources, as well as the metadata - the data about this data - fromdifferent sources are integrated to come up with a single data store. There are a numberof issues to consider during data integration related mostly to possible differentstandards among data sources. These issues could be entity identification problem, datavalue conflicts, and redundant data. Careful integration of the data from multiple sourcesmay help reduce or avoid redundancies and inconsistencies and improve data miningspeed and quality of sources.Four Types of Data Integration Methodologies1. Inner Join - creates a new result table by combining column values of two tables(A and B) based upon the join-predicate.2. Left Join - returns all the values from an inner join plus all values in the left tablethat do not match to the right table, including rows with NULL (empty) values inthe link column.3. Right Join - returns all the values from the right table and matched values fromthe left table (NULL in the case of no matching join predicate).4. Outer Join - the union of all the left join and right join values.Fundamentals of Predictive Analytics14
Learning ResourcesDr. Eugene Rex Jalao’s video on Data IntegrationActivity 2-1Watch:Dr. Jalao’s video on Data Integration.Fundamentals of Predictive Analytics15
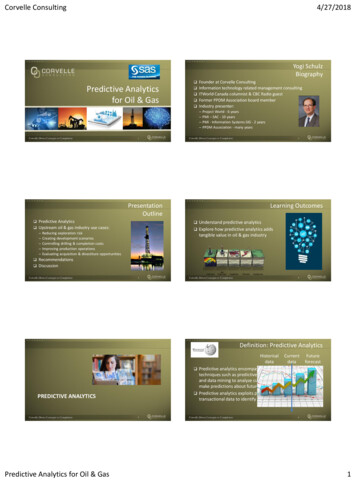
Study Questions1. How are the alternative data warehousing architectures different from the usualarchitecture?2. Discuss the advantages and disadvantages of the different alternative datawarehousing architectures.B. Data TransformationData transformation is a process of transforming data from one format to another. It aimsto transform the data values into a format, scale or unit that is more suitable for analysis.Data transformation is an important step in data preprocessing and a prerequisite fordoing predictive analytic solutions.Here are a few common possible options for data transformation:1) Normalization - a way to scale specific variable to fall within a small specific rangea) min-max normalization - transforming values to a new scale such that allattributes fall between a standardized format.b.) Z-score standardization - transforming a numerical variable to a standardnormal distributionFundamentals of Predictive Analytics16
2.)Encoding and Binninga) Binning - the process of transforming numerical variables into categoricalcounterparts.i) Equal-width (distance) partitioning - divides the range into N intervals of equalsize, thus forming a uniform grid.ii.) Equal-depth (frequency) partitioning Divides the range into N intervals, each containingapproximately the same number of samples.Fundamentals of Predictive Analytics17
b.) Encoding - the process of transforming categorical values to binary ornumerical counterparts, e.g. treat male or female for gender to 1 or 0.Data encoding is needed because some data mining methodologies,such as Linear Regression, require all data to be numerical.i.)Binary Encoding (Unsupervised) Transformation of categorical variables by taking thevalues 0 or 1 to indicate the absence or presence of eachcategory. If the categorical variable has k categories, we would needto create k binary variables.ii.)Class-based Encoding (Supervised) Discrete ClassFundamentals of Predictive Analytics18
Replace the categorical variable with just one new numericalvariable and replace each category of the categorical variablewith its corresponding probability of the class variable.Continuous ClassReplace the categorical variable with just one new numericalvariable and replace each category of the categorical variable withits corresponding average of the class variable.Fundamentals of Predictive Analytics19
Learning ResourcesDr. Eugene Rex Jalao’s video on Data TransformationDr. Eugene Rex Jalao’s video on Data EncodingC. Data CleaningAll data sources potentially include errors and missing values – data cleaning addressesthese anomalies. Data cleaning is the process of altering data in a given storageresource to make sure that it is accurate and correct. Data cleaning routines attempts tofill in missing values, smooth out noise while identifying outliers, and correctinconsistencies in the data, as well as resolve redundancy caused by data integration.Fundamentals of Predictive Analytics20
Data Cleaning Tasks:a) Fill in missing valuesSolutions for handling missing data:i. Ignore the tupleii. Fill in the missing value manuallyiii. Data Imputation- Use a global constant to fill in the missing value- Use the attribute mean to fill in the missing value- Use the attribute mean for all samples belonging to thesame classb) Cleaning noisy dataSolutions for cleaning noisy data:i. Binning - transforming numerical values into categoricalcomponentsii. Clustering - grouping data into corresponding cluster and use thecluster average to represent a valueiii. Regression - utilizing a simple regression line to estimate a veryerratic data setiv. Combined computer and human inspection - detecting suspiciousvalues and checking it by human interventionsc) Identifying outliersSolutions for identifying outliers:i. Box plotActivity 2-2Watch:Dr. Jalao’s video on Data Cleaning.D. Data Reduction and ManipulationData reduction is a process of obtaining a reduced representation of the data set that ismuch smaller in volume but yet produce the same (or almost the same) analyticalresults. The need for data reduction emerged from the fact that some database/datawarehouse may store terabytes of data, and complex data analysis/mining may take avery long time to run on the complete data set.Fundamentals of Predictive Analytics21
Data Reduction Strategies:a.Sampling - utilizing a smaller representative or sample from the big data set orpopulation that will generalize the entire population.i.Types of Sampling1. Simple Random Sampling - there is an equal probability ofselecting any particular item.2. Sampling without replacement - as each item is selected, it isremoved from the population3. Sampling with replacement - objects are not removed from thepopulation as they are selected for the sample4. Stratified sampling - split the data into several partitions, thendraw random samples from each partition.b. Feature Subset Selection - reduces the dimensionality of data by eliminatingredundant and irrelevant features.i.Feature Subset Selection Techniques1. Brute-force approach - try all possible feature subsets as input todata mining algorithm2. Embedded approaches - feature selection occurs naturally as partof the data mining algorithm3. Filter approaches - features are selected before data miningalgorithm is run4. Wrapper approaches - use the data mining algorithm as a blackbox to find the best subset or attributesc. Feature Creation - creating new attributes that can capture the importantinformation in a data set much more efficiently than the original attributes.i.Feature Creation Methodologies1. Feature Extraction2. Mapping Data to New Space3. Feature ConstructionLearning ResourcesDr. Eugene Rex Jalao’s video on Data Reduction and Manipulation.Fundamentals of Predictive Analytics22
Activity 2-3Watch:Dr. Jalao’s video on Data Reduction and ManipulationOther References Used for Module 2:A Comprehensive Approach Towards Data Preprocessing Techniques & AssociationRules Jasdeep Singh Malik, Prachi Goyal, 3 Mr.Akhilesh K Sharma 3 AssistantProfessor, IES-IPS Academy, Rajendra Nagar Indore – 452012 , India. Available at ceedings/papers/Group3/INDIACom10 279 Paper%20(2).pdfSon NH (2006) Data mining course—data cleaning and data preprocessing. WarsawUniversity. Available at URL http://www.mimuw.edu.pl/ son/datamining/DM/4preprocess.pdfMalley B., Ramazzotti D., Wu J.T. (2016) Data Pre-processing. In: Secondary Analysisof Electronic Health Records. Springer, Cham. Available at -3-319-43742-2 12#Sec2Fundamentals of Predictive Analytics23
MODULE 3: SUPERVISED LEARNINGIntroductionIn Module 1, you already have encountered the definition of supervised learning. Thistime, Module 3 discusses supervised learning in greater detail. Specifically, supervisedlearning methodologies can be categorized into two: classification, the prediction of aclass or category from several predictor variables; and regression, the prediction ofnumerical value from one or more predictors. This module also tackles how regressionand classification may be evaluated.Learning ObjectivesAfter working on this module, you should be able to: Differentiate classification from regression. Identify and discuss appropriate supervised learning methodologies for variousscenarios and business problems. Build and validate prediction models by utilizing supervised learningmethodologies. Evaluate the performance of the prediction model.3.1.ClassificationGiven a collection of records, let us say that we have multiple predictor variables (x , x ,x ) and one categorical response (y). Here, we intend to find a model for predicting theclass variable from multiple predictor variables. This is the essence of classification; acategorical response is predicted from multiple predictor variables. In classification,historical data are used to build a model and the goal is to predict previously unseenrecords. There are several classification algorithms and some of these are listed below:12pZeroRThe simplest classification methodology which relies on the target and ignores allpredictors.OneRSimple yet accurate classification algorithm that generates one rule for each predictor inthe data.Fundamentals of Predictive Analytics24
Naïve-BayesA frequency-based classifier that uses a probabilistic framework and conditionalprobability to classify data.Decision TreeIt builds classification models in the form of a tree structure that represents rules that canbe easily understood.Nearest NeighboursAn intuitive method that classified unlabeled data based on their similarity with sampleexamples in the training set. It utilizes distance as a similarity measure in makingpredictions.Artificial Neural Network (ANN)A network of perceptrons or nodes that mimic a biological network of neurons in thebrain.Support Vector Machine (SVM)It performs classification by finding a plane that maximizes the margin between the twoclasses.EnsembleThis predicts the class of previously unseen records by aggregating predictions made bymultiple classifiers.Random ForestsA relatively modern algorithm that is essentially an ensemble of decision trees.Learning Resources Video onVideo onVideo onVideo onVideo onVideo onVideo onVideo on“Classification” by Dr. Eugene Rex Jalao.“Naive Bayes” by Dr. Eugene Rex Jalao“Decision Trees” by Dr. Eugene Rex Jalao“Nearest Neighbours” by Dr. Eugene Rex Jalao“Artificial Neural Networks” by Dr. Eugene Rex Jalao“Support Vector Machines” by Dr. Eugene Rex Jalao“Ensembles” by Dr. Eugene Rex Jalao“Random Forests” by Dr. Eugene Rex JalaoFundamentals of Predictive Analytics25
3.1.1. Classification Model EvaluationWe will not know how well the model performs unless model evaluation comes into thepicture. Model evaluation is a methodology used to find the model that represents thedata and how well the chosen model will work in the future. Listed below are questionsnecessary to be answered in model evaluation:1. How do we evaluate the performance of a classification model? Appropriatemetrics have to be defined.2. How do we obtain reliable estimates of these errors? The methods forperformance evaluation, and the concepts of overfitting and underfitting have tobe considered.3. How do we compare the relative performance among competing models?Thus, if there are multiple prediction models or algorithms, how are these modelscompared? Which one among them will be chosen to deploy in business?Learning ResourcesVideo on “Model Evaluation” by Dr. Eugene Rex Jalao.Assignment 1Your faculty-in-charge will give you your assignment on Classification Methodologies.3.2.RegressionRegression is a data mining task of predicting the target’s value, i.e., the numericalvariable (y), by building a model based on one or more predictors, which can benumerical and categorical variables.There are many applications of regression such as data description, parameterestimation, prediction/estimation, and control. In this regard, regression analysis,arguably the most widely used (and misused) statistical technique, is utilized. Multiplelinear regression (MLR) is a method used to model the linear relationship between atarget variable and more than one predictor variables.Fundamentals of Predictive Analytics26
Learning ResourcesVideo on “Regression” by Dr. Eugene Rex Jalao.3.2.1. Regression Model EvaluationIn regression, we predict actual values that are numerical in nature. Considering this,how do we know whether the predictions are accurate or whether the regression modelis valid? Listed below are questions to be considered in evaluating a regression model.1. Is at least one of the predictors useful in the predicting the response? If this is notthe case, we cannot predict Y in the first place because none of the predictorsare useful.2. How well does the model fit the data? Is it a good fit?3. Given a set of predictor values, what is the prediction’s response value?4. Are there any outliers that might influence the coefficients?5. Do all of the predictors help explain Y or is only a subset of the predictors useful?Learning ResourcesVideo on “Regression Model Evaluation” by Dr. Eugene Rex Jalao.3.2.2. Indicator VariablesQualitative variables do not have a scale measurement. In this regard, indicatorvariables, also known as dummy variables, are used to model qualitative variables inregression. Indicator variables assigns levels to qualitative variables/categories so thatregression analysis can be performed on them.Learning ResourcesVideo on “Indicator Variables” by Dr. Eugene Rex Jalao.Fundamentals of Predictive Analytics27
3.2.3. MulticollinearityMulticollinearity is the inflation of coefficient estimates due to interdependent regression.This implies that if the regressors (or the predictor variables) are dependent with eachother (i.e. correlation among x , x , x ), then the problem of multicollinearity exists in thefinal regression model. The said problem does not exist if all regressors are completelyindependent with each other; however, this is a rare occurrence in regression analysis.Usually, there is interdependence among predictor variables to a certain extent.123The effect of strong multicollinearity is that it can result in large variances andcovariances for the least square estimates of the coefficients. Large variances impliesunstable predictions, and coefficient estimates would be very sensitive to minor changesin the regression model. Thus, the question now is how is multicollinearity detected? Wewant procedures to correct identify the presence of multicol
1. Discuss key concepts, frameworks, and algorithms in predictive analytics. 2. Identify appropriate predictive analytics/data mining methodologies for different business problems. 3. Utilize appropriate predictive analytics/data mining methodologies to build and validate models. 4. Evaluate the performance of the predictive model. COURSE OUTLINE