Transcription
Warehouse Cost EstimationTim BijlORTEC-ConsultingAugust, 2016
Warehouse cost estimationDate: August 16, 2016ByTim BijlS1135538t.bijl@student.utwente.nlSupervision University of TwenteDepartment Industrial Engineering and Business Information SystemsDr. P.C. (Peter) SchuurIr. H. (Henk) KroonSupervision ORTEC-ConsultingDepartment Supply Chain Strategy & ExcellenceMsc. W. (Wim) KuijstenMsc. F. (Frans) v. HeldenFaculty & Educational programFaculty of Behavioural, Management and Social SciencesMaster: Industrial Engineering and ManagementTrack: Production and Logistics Managementi
VOCABULARYAbbreviationABCAIMMSAutomation levelCost driverEstimatorExtended tivity based costingOptimization softwareThe level of automation within a warehouseAn entity that drives/influences the costsIndependent variableConceptual regression equationInterior point optimizer, solver for nonlinear optimization problemsMixed integer nonlinear problemORTEC Supply Chain Design; a tool designed to perform supply chainstudies at ORTECDependent variableRoot mean square errorii
MANAGEMENT SUMMARYORTEC-Consulting helps customers manage their supply chains, by mapping all the locations, flowsand subsequent costs and uses this as input for supply chain studies. This information is all taken intoaccount in ORTEC Supply Chain Design (OSCD), a tool especially designed for this kind of studies.Within OSCD the goal is to optimize the design of the supply chain, for different scenarios set by theuser. A possible scenario is adding warehouses to the supply chain of a customer. In order to modelan additional warehouse, it is essential to know how the costs can be determined. At this moment,no standard procedure is available to assess the periodic costs of a warehouse. Therefore, ORTECformulated the following problem statement:“In order to make good cost estimations for newly built warehouses or depots, build a generic, userfriendly tool that can quickly and accurately estimate the periodic costs of a warehouse”, with:---Generic: Regardless of sector and the availability of data, the tool must be able to do accurateestimations. Basic cost and operational data, such as the total costs and the amount ofproducts stored in or passing through a warehouse per period, can be expected from allcustomers.Accurately: Given the situation (the availability of data), the tool must use the mostappropriate method to provide a reasonable estimation. The goal, as set by ORTEC, is toperform cost estimations with a maximum deviation of 10% in 90% of the cases.Tool: The desired platform for this tool is AIMMS. The tool must be designed in such way itcan later be implemented within OSCD.Quickly: As part of an OSCD-study the tool must be fast, preferably providing an estimationwithin the order of seconds.Costs: The total periodic operating costs of a warehouse.In this research, first the main high-level cost drivers of a warehouse are defined. From literature,interviews and analysis of a customer-case the following cost drivers are defined:-ThroughputBuilding areaLabourAutomation levelCountry and regionof which throughput is presumably the most powerful driver. After having analyzed what kind of datais provided by the customer for a typical supply chain study, it seems that especially throughput andthe country a warehouse is in are to be expected as input.Several cost estimation methods have been evaluated mainly based on speed, accuracy and the dataavailable. After evaluating, several forms of parametric estimation have been selected to apply in acase-study: simple linear regression, multi-regression, nonlinear regression and a conceptualextended regression equation. Of these methods, the nonlinear and the simple linear regression arebased on throughput as single estimator for the total costs. The multi-regression method is appliedbased on two estimators, namely throughput and the building area. The conceptual extendedregression method was set-up in such a way it can be applied using the country, the area, theautomation level and the throughput of a warehouse as estimators. Since not all these elements wereavailable for the case-study, only throughput and the country of the warehouse were taken in toaccount in the equation.iii
In addition to the parametric estimation methods, activity based costing is also selected as a costestimation method. This method is applied in two ways. The first application is the assignment of allcosts to the throughput, resulting in an average cost per unit. The second application is similar, butnow the average cost per unit is defined per country.All the cost estimation methods have been implemented in AIMMS and the optimization engine wasused to define the slope and intercept of the different regression methods. The clustering ofobservations is also done by optimizing a mathematical model. The analysis, as well as the actual costestimation is all built-in in AIMMS.The best performing method is nonlinear regression, with throughput as independent variable andan exponent of approximately 0.7. Other strong results are reported for extended regression, basedon throughput and the country, and multi-regression based on both throughput and building area.This high-level approach resulted in meeting all the requirements, except for accuracy. The nonlinearmodel reports to estimate the costs of a warehouse within 10% deviation in 39% of the cases. 90%estimation accuracy is only acquired if 40% deviation is allowed (96%). Therefore, the followingrecommendations are formulated:--Gather datasets from customers with more cost drivers available and preferably moreobservations. In this way, the analysis can be more thorough and more sophisticated costestimation models can be developed and evaluated. This will likely increase the accuracy ofthe estimations.Collect multiple datasets of different customers within different industries. This research isbased on one individual client, so it would be interesting to see if the same conclusions canbe drawn over a combined dataset containing multiple clients and industries. In this waygeneral rules can be developed. Other methods, like machine learning could also be applicableto these larger datasets.Further research is required for the following topics:-More datasets with more cost drivers must be collected in order to develop more accuratecost estimation models.Combined datasets from different customers and sectors could provide general rules that areapplicable to every customer in every sector.A distinction can be made between several cost entries and the factors that drive these.Investigating this may lead to more accurate cost estimations.Find a good balance between the gathering of data and the power of the estimations.iv
PREFACEAfter having many great years as a student at the University of Twente, I hereby present my masterthesis. With this thesis I complete my master program Industrial Engineering and Management withas specialization Production & Logistics Management. The research described in this report is executedat ORTEC-Consulting in Zoetermeer, where I also worked part-time as student assistant.I would like to thank all the people I enjoyed my time with in Enschede: my roommates at‘Studentenhuis Fortes’, my sorority Pineut and all other people I met and spent time with.Furthermore, I would like to thank my supervisors at ORTEC, Wim and Frans, and all other people whohelped me and provided feedback or relevant insights. I appreciate the time Wim spent supervisingme and the freedom he gave to do my research.I enjoyed my time at ORTEC very much and I also learned a lot from the people of my team. I reallyliked working with the people at ORTEC, during my thesis and other projects I was involved in.I would also like to thank Peter Schuur, my supervisor of the University of Twente, for his contributionto my research and his positive way to look at things. Also thanks to my second supervisor, HenkKroon, for his support and critical reviews.I would like to thank all the people who made time to support me or help me by reviewing my thesisreport.A special thanks to my parents, who supported me my entire (extensive) study in both Amsterdamand Enschede.Den Haag, October 1st, 2016Tim Bijlv
TABLE OF CONTENTSVocabulary . iiManagement summary. iiiPreface . vTable of Contents . viList of figures . ixList of tables . ix1Introduction and problem description . 11.1ORTEC & ORTEC-Consulting . 11.2Business context . 11.3Problem description . 21.4Problem statement & scope . 21.5Research questions . 21.6Deliverables. 31.7Running example . 31.7.1Customer characteristics. 41.7.2Business request . 41.82Relevant cost drivers . 72.1Typical warehouse costs . 72.2Cost drivers from literature . 82.3Cost drivers from interviews . 92.4Cost drivers from case study . 102.4.1Raw data . 102.4.2Normalized data . 112.4.3Clustering . 122.534Report outline . 5Conclusion . 14Data availability. 153.1Typical input for supply chain studies . 153.2Data request. 153.3Data provided by customers . 163.4Conclusion . 16Cost estimation methods . 174.1Overview methods . 174.2Parametric estimating . 18vi
4.2.1Simple linear regression . 184.2.2Multiple linear regression . 204.2.3Nonlinear regression . 214.2.4Clustering . 224.2.5Machine learning . 234.2.6Activity based costing . 244.3Engineering build-up . 254.3.15CCET . 254.4Analogy . 254.5Expert opinion . 254.6Summary cost estimation methods . 264.7Method comparison and choice . 264.8Conclusion . 28Approach & mathematical formulation . 295.1Simple linear regression & multi-regression. 295.1.1Sets and indices. 295.1.2Parameters . 295.1.3Variables. 295.1.4Problem statement . 295.1.5Problem classification . 305.2Extended regression . 305.2.1Sets and indices. 315.2.2Parameters . 315.2.3Variables. 315.2.4Problem statement . 315.2.5Problem classification . 325.3Nonlinear regression . 325.3.1Sets and indices. 325.3.2Parameters . 325.3.3Variables. 325.3.4Problem statement . 325.3.5Problem classification . 325.4Clustering . 325.4.1Sets and indices. 335.4.2Parameters . 335.4.3Variables. 33vii
5.4.4Problem statement . 335.4.5Problem classification . 335.55.5.1Sets and indices. 335.5.2Parameters . 345.5.3Problem statement . 345.5.4Problem classification . 345.6678ABC . 33Conclusion . 34Case study . 356.1Set-up case study . 356.2Testing procedure . 356.3Results . 366.4Results with respect to goal ORTEC . 376.5Conclusion . 38Implementation . 397.1Implementation . 397.2User interface. 397.3Performance . 407.4Conclusion . 40Conclusions & Discussion . 418.1Conclusion . 418.2Recommendations . 438.3Discussion. 438.4Future research . 44Bibliography . 45Appendix A: Opening page . 47Appendix B: Clustering . 47Appendix C: Estimation page . 48viii
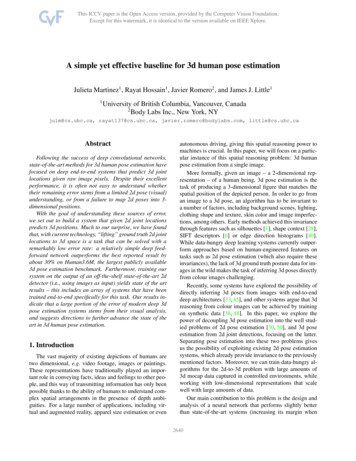
LIST OF FIGURESFigure 1.2-1: Visualization of OSCD. 1Figure 1.7-1: Current (blue) and proposed (green) locations of southern warehouses of the packagingdistributor . 4Figure 2.1-1: Simple warehouse cost-tree (from Richards, 2010) . 8Figure 2.2-1: Stepwise linear warehousing cost function (From Goh et al. 2001) . 8Figure 2.3-1: Inter-relationships of cost drivers based on interviews . 10Figure 2.4-1: Scatterplot of throughput versus total costs (implemented in AIMMS) . 10Figure 2.4-2: Scatterplot of building area versus total costs (implemented in AIMMS) . 11Figure 2.4-3: Number of clusters versus explained variance for Customer 2. 12Figure 2.4-4: Division of the countries of origin of the observations over three clusters . 13Figure 4.2-1: Regression line of building area versus the total costs (implemented in AIMMS) . 19Figure 4.2-2: Nonlinear regression line of throughput versus the total costs (implemented in AIMMS). 21Figure 4.2-3: Clustering procedure (from Xu, 2005) . 22Figure 4.2-4: Traditional data analysis versus algorithmic modeling (From Breiman, 2001) . 23Figure 4.2-5:Example of how a decision tree for cost estimation may look like . 24Figure 4.7-1: Performance matrix of different estimation methods . 28Figure 5.2-1: Cost drivers of labour costs . 30Figure 5.2-2: Cost drivers of building area costs . 30Figure 6.4-1: Accuracy per method. 38LIST OF TABLESTable 2.4-1: Strongest results found within the provided data-set. 11Table 2.4-2: Strongest results found within the provided data-set. 11Table 2.4-3: Strongest results found within the provided normalized data-sets . 12Table 2.4-4: Average values per cluster, with 2 clusters . 13Table 2.4-5: Average values per cluster, with 3 clusters . 13Table 3.3-1: Elements available within data-sets analyzed . 16Table 4.1-1: Three cost estimation methods compared (from Leonard, 2009) . 17Table 4.2-1: Regression equation based on building area . 20Table 4.2-2: Regression equation based on throughput and building area . 20Table 4.2-3: Regression equation based on throughput . 21Table 4.4-1: Example of the analogy cost estimating method (from Leonard, 2009) . 25Table 4.7-1: Different estimation methods with their score per criterion . 27Table 6.1-1: Independent variables present within the dataset of Customer 2. 35Table 6.2-1: Estimation methods and used predictors . 35Table 6.2-2: Number of observations per country used for the test . 36Table 6.3-1: Results of the cross-validation, expressed in RMSE . 36Table 6.3-2: Average equation of the three most accurate cost estimation methods . 37ix
x
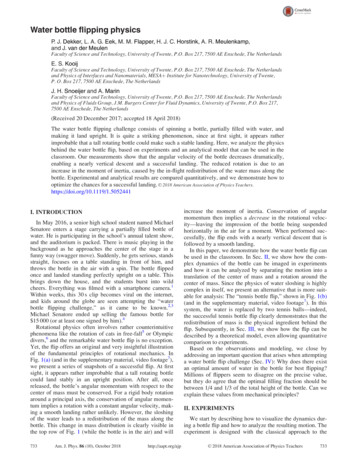
1 INTRODUCTION AND PROBLEM DESCRIPTIONIn the context of my Master’s thesis I performed this research at ORTEC-Consulting in Zoetermeer,thereby finishing the master track Production & Logistics Management at the University of Twente.In this first chapter, the company ORTEC is described as well as the need for this research.Furthermore, the main goal as well as the research questions that result in achieving the research goalare set out.1.1 ORTEC & ORTEC-CONSULTINGORTEC is founded in 1981 by five econometrics students from the Erasmus University in Rotterdam.The founders believed the mathematical theories and algorithms they worked on could be practicallyapplied to improve business performance. Today, ORTEC is serving clients in almost every industryand has 15 offices located across 4 continents with around 900 employees, of which most are highlyeducated with a quantitative background. The ORTEC headquarters is situated in Zoetermeer, a cityin the west of the Netherlands, and hosts about 400 employees.ORTEC-Consulting is one of the three components that form ORTEC, next to Products and Living Data.The headquarters in Zoetermeer hosts about 130 consulting employees and is active in many fields.Large customers are in oil & gas, aviation and consumer packaged goods and the gross of the projectsis on a tactical or strategical level. Almost all solutions provided by ORTEC-Consulting arequantitatively based, which distinguishes ORTEC from its competition.1.2 BUSINESS CONTEXTSupply chain studies are one of the main activities within ORTEC Consulting. Within these studies,customers request insight in their supply chain and strategic (semi-) optimal choices are to be madewith respect to production and stock levels, routing, opening and/or closing locations. For thispurpose, ORTEC designed its own tool, ORTEC Supply Chain Design (OSCD), to perform these kind ofstudies. An example of how the outcome of an OSCD study can be visualized can be seen in Figure 1.21. OSCD is implemented in AIMMS, a software system designed for modeling and solving large-scaleoptimization and scheduling-type problems, in which these kind of optimization problems can easilybe modelled.Figure 1.2-1: Visualization of OSCD1
1.3 PROBLEM DESCRIPTIONThe focus of this research is at opening and/or closing warehouses, a part of the study normally carriedout with Greenfield analysis, also integrated in OSCD. In these kind of studies, it is essential to gatheras much information as possible. Supply, demand, capacities, coordinates and costs are all taken intoaccount in balance equations within the mathematical model which will be eventually optimized.Different scenarios are set up, including choices about closing and opening different warehouselocations, in order to evaluate the financial consequences of different strategies. An important partwithin these studies is estimating the periodic operational costs of a new warehouse, because it has amajor impact on the outcome of the different scenarios. If the estimation is poor and not wellfounded, the quality of the solution is likely to be poor as well.In the current situation the costs are in many cases estimated by doing a side-study for a given set ofpotential locations, based on characteristics of already existing warehouses and their cost-structure.There is no standard procedure for this cost estimation and it is case-dependent which approach ischosen for. Fact is that the current approach is time-consuming, not standardized and performance isnot guaranteed.1.4 PROBLEM STATEMENT & SCOPETo fill the gap between the current and the desired situation, this research aims for providing anaccurate cost estim
an additional warehouse, it is essential to know how the costs can be determined. At this moment, no standard procedure is available to assess the periodic costs of a warehouse. Therefore, ORTEC formulated the following problem statement: “In order to make good cost estimations for