Transcription
Magnetic Resonance Materials in Physics, Biology and Medicine (2021) 24-1RESEARCH ARTICLEWhole‑brain 3D MR fingerprinting brain imaging: clinical validationand feasibility to patients with meningiomaThomaz R. Mostardeiro1Aiming Lu1· Ananya Panda1 · Robert J. Witte1 · Norbert G. Campeau1 · Kiaran P. McGee1 · Yi Sui1 ·Received: 18 December 2020 / Revised: 29 March 2021 / Accepted: 19 April 2021 / Published online: 4 May 2021 The Author(s) 2021AbstractPurpose MR fingerprinting (MRF) is a MR technique that allows assessment of tissue relaxation times. The purpose of thisstudy is to evaluate the clinical application of this technique in patients with meningioma.Materials and methods A whole-brain 3D isotropic 1mm3 acquisition under a 3.0T field strength was used to obtain MRF T1 and T 2-based relaxometry values in 4:38 s. The accuracy of values was quantified by scanning a quantitative MR relaxometry phantom. In vivo evaluation was performed by applying the sequence to 20 subjects with 25 meningiomas. Regionsof interest included the meningioma, caudate head, centrum semiovale, contralateral white matter and thalamus. For bothphantom and subjects, mean values of both T 1 and T 2 estimates were obtained. Statistical significance of differences in meanvalues between the meningioma and other brain structures was tested using a Friedman’s ANOVA test.Results MR fingerprinting phantom data demonstrated a linear relationship between measured and reference relaxometry estimates for both T 1 (r2 0.99) and T2 (r2 0.97). MRF T1 relaxation times were longer in meningioma (mean SD1429 202 ms) compared to thalamus (mean SD 1054 58 ms; p 0.004), centrum semiovale (mean SD 825 42 ms;p 0.001) and contralateral white matter (mean SD 799 40 ms; p 0.001). MRF T2 relaxation times were longer formeningioma (mean SD 69 27 ms) as compared to thalamus (mean SD 27 3 ms; p 0.001), caudate head (mean SD39 5 ms; p 0.001) and contralateral white matter (mean SD 35 4 ms; p 0.001)Conclusions Phantom measurements indicate that the proposed 3D-MRF sequence relaxometry estimations are valid andreproducible. For in vivo, entire brain coverage was obtained in clinically feasible time and allows quantitative assessmentof meningioma in clinical practice.Keywords Whole-brain MR fingerprinting · Meningioma · Relaxometry · 3D isotropicIntroductionMagnetic resonance fingerprinting (MRF) is a novel MRacquisition method for quantitative assessment of tissuemagnetic properties such as T1, T2 and proton density [1–3].Introduced in 2013, MRF involves acquiring either a twoor three-dimensional dataset typically using non-Cartesiank-space encoding sampling scheme such as a spiral trajectory[2, 4, 5]. Unlike conventional acquisitions which commonlyrequire establishment of a steady state of the magnetizationbefore spatial encoding, a MRF pulse sequence modifies* Thomaz R. nt of Radiology, Mayo Clinic, Rochester, MN,USAacquisition parameters, including the radiofrequency flipangle, the pulse repetition rate (TR) and echo time (TE),over a time interval while continuously acquiring data [6–8].For a given voxel in the reconstructed MR images and giventhat the acquisition parameters are known, a simulated orequivalent MR signal time course can be generated for agiven set of relaxometry values [9–11]. For each voxel, thesignal evolution obtained is compared with a collection ofsimulated signal evolutions (or fingerprints). The best matchfor the voxel fingerprint is selected from this collection (thedictionary) through a pattern matching process. Processingof all voxels in this manner results in the generation of quantitative spatial relaxometry maps [10, 11], thereby providinga method to assess the underlying magnetic properties of thetissue in both normal and disease states [11–14].13Vol.:(0123456789)
698Magnetic Resonance Materials in Physics, Biology and Medicine (2021) 34:697–706Phantom experiments have validated the accuracy andprecision of MRF relaxometry estimates [8, 11, 14–16usinga quantitative relaxometry phantom developed jointly by theNational Institute of Science and Technology (NIST) andthe International Society of Magnetic Resonance in Medicine (ISMRM) [15] as well as agarose gel [12, 17, 18] andT1MES [19] phantoms. Also, under in-vivo neuroimaging,MRF relaxometry has been demonstrated to be repeatableand reproducible across multiple scanners [20] and fieldstrengths [21]. Clinically it has also been demonstrated that2D-MRF-based relaxometry can identify abnormalitiesthat are poorly visualized using conventional MR imagingin patients with epilepsy [7, 22]. In addition, slice selective2D-MRF has been proposed for differentiating intra-parenchymal brain tumors, such as: high-grade gliomas [23, 24](World Health Organization grades III and IV), low-gradegliomas [23, 24] (World Health Organization grades I andII) and metastases [23]. Given the mentioned investigationsin neuroimaging [22–24] studied only selected 2D-MRFslices of the brain, 3D-MRF has been proposed [5, 25–27]to allow a fast whole-brain coverage in a Radiation Oncology setting [25] and in patients with Parkinson Disease [28].These studies [25, 28] demonstrated that a fast entire braincoverage was feasible with high resolution, pointing a majoradvantage of a 3D-MRF acquisition for clinical applications.Meningioma are classified by the World Health Organization into three grades: grade I (benign), grade II (atypical meningioma), and grade III (anaplastic or malignantmeningioma) [29], accounting for 13–26% of intracranialtumors with the vast majority (85%) being benign [29, 30].Quantitative imaging techniques have been proposed for tissue characterization in meningioma, such as ADC values[31–33] and MR elastrography [34]. This pilot investigationhas two goals. First, it aims to further validate the relaxometry estimations from a whole-brain 3D-MRF [9] acquisition through a NIST/ISMRM phantom experiment. Second,it aims to evaluate the clinical feasibility of this sequenceinto a clinical cenario by providing further insight for relaxometry properties in charaterization of meningiomas andselected brain structures.MethodsImage acquisition and reconstructionAll exams were acquired on two 3T clinical MR scanners(Discovery MR750 and Discovery MR750W, GE Healthcare, Waukesha, WI) using an eight channel receive-onlyRF head coil. MRF data acquisition was performed usinga three-dimensional steady state free precession sequencewith a novel multi‐axis spiral trajectory and slab excitation [9]. Adiabatic inversion pulses were used before each13acquisition. A ramp flip angle schedule was used rangingfrom 0.778 to 70 . The sequence details can be found in [9].A volumetric k-space data set consisting of 256 256 256samples and a FOV of 25.6 25.6 25.6 c m3 resulted inreconstructed relaxometry maps with 1 mm isotropic resolution. The total acquisition time for the whole brain was 4:38(minutes: seconds). The T 1 for the dictionary ranged from10 to 3000 ms and T2 from 10 ms up to 2000 ms. Each T1and T2 dictionary step range follow the exponential natureof T1 and T2 relaxation curves. For example, 10:5:100means step size 5 range from 10 to 100 ms. As such, a fewexamples for T1 curve steps are 10:5:100, 110:10:1000,1050:50:2000, 2100:100:3000 and for T 2 10:1:100,105:5:500, 525:25:1000, 1100:100:2000. Fingerprint reconstruction and dictionary matching were performed offlinein Matlab (Mathworks, Natick, Massachusetts) on a Linuxworkstation equipped with two 8‐core Intel Xeon Gold6244 central processing unit @ 3.60 GHz, 376 GB systemmemory, and a NVIDIA Tesla V100 graphical processingunit. The reconstruction pipeline has been described elsewhere [35]. Briefly, the undersampled data were anti-aliasedwith a k-space-weighted view-sharing algorithm and [36,37] then the view-shared data were compressed with singular value decomposition algorithm and finally the first 15singular value decompensation coefficients of the temporalsignals were kept for parametric maps reconstruction. GPUgridding and fast Fourier transform were performed on thecompressed non-Cartesian k-space data. T1, T2 and protondensity maps were computed via dictionary matching on thegeneral processing unit and interpolated to 512 512 512image matrix for display. The computation time was approximately 10 min for each dataset.Phantom validationTo evaluate the accuracy and reproducibility of the MRFbased relaxometry maps, a quantitative MR relaxometryphantom developed jointly by the NIST and ISMRM [38]was scanned 7 times over the course of 30 min. This phantom has compartments containing solutions with a widerange of T1 and T2 values [15]. MRF-based T1 and T2 valueswere compared with the calibrated nominal values providedwith the phantom.Patient studiesAn institutional review board approved study was used toacquire MRF data in patients scheduled for a diagnosticbrain MR examination. The MRF sequence was added tothe clinical protocol and acquired prior to the administrationof a gadolinium-based contrast agent to assess the nativerelaxometry of the in-vivo brain.
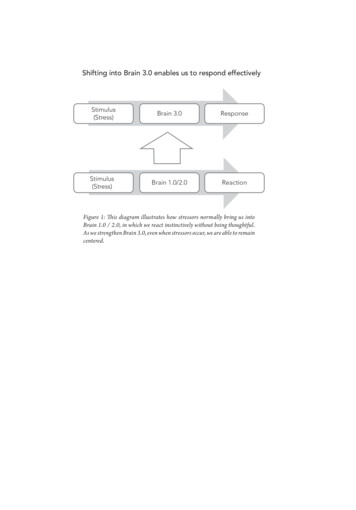
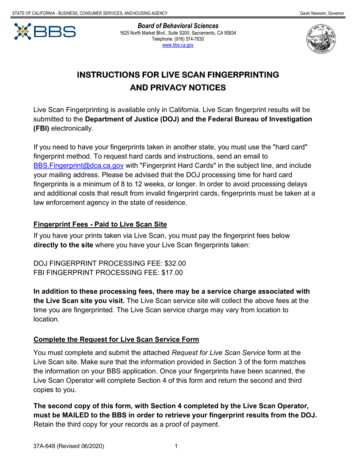
Magnetic Resonance Materials in Physics, Biology and Medicine (2021) 34:697–706Only patients with biopsy-proven or imaging diagnosisof meningioma identified on prior diagnostic MRI examinations were included. Radiation induced meningioma (RIM)were included but those that were treated with gammaknife stereotactic radiosurgery were excluded. Subject agesranged from 18- to 76-years old. A total of 22 patients wererecruited with two being excluded from the statistical analysis. The first patient was excluded due to the small size ofthe mass and the effect of partial volume averaging (Fig. 1)on relaxometry values while the second was excluded dueto concerns about being a potential extradural metastasisinstead of meningioma on expert neuroradiology re-review.The final population comprised twenty patients; four patientshad multiple tumors thus totaling 25 meningiomas. Seventeen tumors were non-treated meningiomas (NTM), fourpartially resected meningiomas (PRM) and four prior brainradiation-induced meningiomas (RIM). Pathology was available for nine meningiomas (3 Grade I; 6 Grade II) in different groups: two RIM, three NTM and all four PRM. ForNTM with biopsy results available, the MRF scan was donebefore biopsy to avoid tract changes. PRM were includedonly if the residual tumor was clearly defined without anydescribed operative change.MRF image analysisTo estimate in-vivo brain relaxometry values, regions ofinterest (ROI) were drawn directly over T1 MRF relaxometry maps using the ITK-SNAP software Version 3.8[39]. ROIs were then copied to MRF T 2 maps. Clinicalpre- and post-contrast MRI images were used as referencefor all 15 study patients. ROIs were drawn to include themeningioma as well as normal structures that included699the centrum semiovale (CS), thalamus, contralateral whitematter (CWM) and caudate head (CH). The rationale inselecting normal brain structures that are both on deepgray matter and white matter is to compare how the MRFnumbers we described on those structures are in accordance to more established literature descriptions on relaxometry in these same structures. All ROI were reviewedby board-certified neuroradiologists prior to finalization.Figure 2 illustrates ROIs used to quantify these regions. Ifthe meningioma crossed the midline, then the CWM ROIin the hemisphere opposite to the epicenter of the lesionwas chosen. In those patients who had more than one meningioma, the location of the CWM ROI was chosen in thehemisphere opposite the largest lesion.Statistical analysisTo assess the precision and accuracy of MRF-basedphantom relaxometry values, a linear regression analysis(Microsoft Excel 2010, Microsoft Corporation, Redmond,WA) was performed on the MRF phantom data. Repeatability was calculated by measuring the standard deviationof the phantom values over the seven repeat acquisitionsobtained over the course of the 30-min imaging session.The means of the MRF-based T 1 and T 2 values for meningioma and normal brain structures were compared usinga nonparametric Friedman’s Test ANOVA (OriginPro2020b, Northampton, MA) that included a post-hoc Dunn’sanalysis to determine statistical significance between ROI.In patients with multiple tumors, each meningioma waspaired multiple times with normal brain structures. A pvalue 0.05 was used for statistical significance.Fig. 1 Anatomic and MRFdata of subject excluded due topartial volume effects. a MRF T1-relaxometry map shows asmall dural-based right parietalmeningioma overlying the rightoperculum with the lowest T1value (793 ms). This was alsothe smallest lesion (0.9 cm) inthis study. b Axial spin echopost-gadolinium T1WI showstypical homogeneous enhancement and extradural location ofmeningioma13
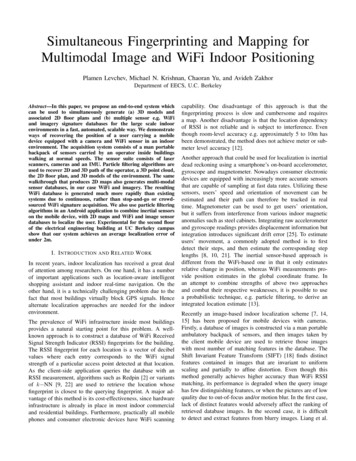
700Magnetic Resonance Materials in Physics, Biology and Medicine (2021) 34:697–706Fig. 2 MRF-derived T1relaxation maps from the samesubject. a Depicts ROI drawings in the (1) meningioma and(2) contralateral white matter(CWM). b Illustrates the ROIsused to encompass the caudatehead (CH) (3) and thalamus (4).The grayscale is calibrated inmilliseconds (ms), shown to theright of the respective relaxationmapsResultsPhantomMRF-based T1 and T2 relaxation times of the NIST phantom in the T1 array layer are shown in Fig. 3. Figure 3a,b depict T 1 and T2 relaxation maps through the center ofthe phantom identifying the 14 inserts used to estimate therespective relaxometry values. The standard deviation alongthe mean for seven MRF measurements as a function of T1and T2 relaxation times was calculated for each vial andranged from 0.4 to 6.8 ms and 0.4 to 12.1 ms for T 1 and T 2,respectively. Figures 3(C) show the mean measured versusreference relaxometry values for T 1 and T 2 up to 1600 ms(D) and 200 ms (E). While both T 1 and T 2 MRF-basedrelaxometry were highly linear correlated ( T1: r2 0.99; T2: r2 0.99 15–200 ms; T2: r2 0.97 15 ms–1600 ms),there was a higher agreement for T1 compared to T2 valuesand is reflected in the mean absolute percentage error forMRF-based relaxometry which was 11% for T 1 and 27%for T2. The mean absolute percentage error was lower (3%for T1 and 14% for T2) for the clinically relevant relaxationtimes from all the regions analyzed in this study (T1 range500–2000 ms and T2 range 15–200 ms).In vivoEleven of the 20 patients (mean age of 59 13 years(mean SD) were female. The median time between initialdiagnosis to MRF imaging was 13 months (0–198 months).For patients with multiple meningiomas (n 4), a singlepatient had three lesions (2 RIM, 1 PRM) while the remaining three had two lesions each (two patients had two NTM;another patient; two RIM). Grade I meningioma (n 6) had amean T1 SD and T2 SD of 1436 72 ms and 65 34 ms,13respectively, while Grade II (n 3) had a mean T 1 and T2of 1599 388 and 90 ms 53. Representative MRF mapsobtained from one patient are shown in Fig. 4. Figure 5shows the box and whisker plots for differences in T 1 and T 2relaxation times between meningioma and normal structures.Table 1 lists the statistical analysis of MRF-based relaxometry data for all patients. Mean T 1 relaxation times weresignificantly longer for meningioma when compared to thethalamus (p 0.001), CS (p 0.001) and CWM (p 0.001).Deep gray matter showed longer T 1 relaxation comparedto white matter, as represented by the CH versus the CS(p 0.001) and CWM (p 0.001) and the thalamus compared to CWM (p 0.001). All other statistical comparisonsbetween anatomical structures were not significant. Mean T2 relaxation of meningioma times were longer than thethalamus (p 0.001), CH (p 0.001), CWM (p 0.001). T2relaxation times of the CS was significantly longer than thethalamus (p 0.001). All other pair-wise comparisons for T 2were not statistically significant.DiscussionMRF allows accurate and time-efficient quantitative mapping of MR tissue relaxometry values across various organsystems [11, 14]. In neuroimaging, MRF has been used forevaluation of intracranial tumors [23, 24, 40] and epilepsy[7, 22, 41]. To our knowledge, this is the first study to reporton the use of this technique in a whole-brain 3D schemecovering the entire brain in patients with meningioma underroutine clinical imaging conditions. Using the interleavedMRF spiral acquisition, isotropic coverage of the wholebrain at a resolution of 1 mm3 per voxel was achieved in lessthan 5 min of acquisition time (4:38 min: seconds). Validation was obtained using a standardized phantom where
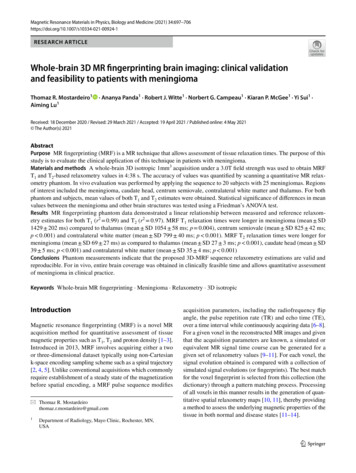
Magnetic Resonance Materials in Physics, Biology and Medicine (2021) 34:697–706701Fig. 3 Phantom validation. a, b T1 relaxation maps A and T 2 relaxation maps B for the phantom’s inserts from one acquisition in the T1array layer. c, d Scatter plots of MRF-based relaxation times (y-axis)versus nominal relaxation times (x-axis) for T 1 C and in T 2 up to1600 ms D and 200 ms E show linear strong correlation for MRF-based relaxation times compared to nominal relaxation times for bothT1 and T2, with underestimation for both properties at higher rangesof T1 and T 2. The error bars represent the mean standard deviationwithin the regions of interest within each phantom’s insertthree-dimensional MRF-based relaxometry values were linearly correlated with their stated reference values (r2 0.99for T1 and T2) over the range of clinically relevant T1 and T2relaxometry values.In the phantom data presented perfect agreementbetween the calculated and stated relaxometry values wasnot achieved across the range of T1 and T2 values tested. 1 estiThis difference was more evident in T 2 compared to Tmates and most prominent at the longest T 2 value (1500 ms)(Fig. 3c–e). Within the context of this study, the impact ofthese variations is minimal as the in-vivo brain tissue estimates are characterized by T2 values of less than 200 ms at3T [42] and, therefore, expected to be accurately determinedusing the proposed MRF technique. Furthermore, the relaxometry range at 3T described for peritumoral white matter (including edema), glioblastoma multiforme, low-gradegliomas and metastatic disease is bellow 200 ms [23, 24].While similar conclusions cannot be made with regards toMRF-based estimates of CSF, which is known to have a T 2values of the order of 1000–2000 ms at 3T [43], estimates ofCSF were not made and therefore do not impact the resultsof this study.There are a few potential reasons for the deviationbetween the measured and nominal relaxation times forMRF-based T 2 values. First, the pulse sequence usedemploys a spoiled gradient echo acquisition scheme resulting in a highly T 1-weighted MR signal [2, 9]. Second, thesequence does not employ any additional T2 preparationpulses to provide greater T2 weighting thereby being lesssensitive to tissues with long T 2 relaxation times. Third, thesequence does not account for effects such as magnetizationtransfer, diffusion and field inhomogeneities which can affectrelaxometry estimates [9, 44].MRF T1 and T2 relaxation values of the selected normalbrain structures in this study are in agreement with previously published results derived from methods using a 2Dacquisition [20, 42]. Badve et al. [42] investigated MRFbased relaxation in white matter structures from selected 4–513
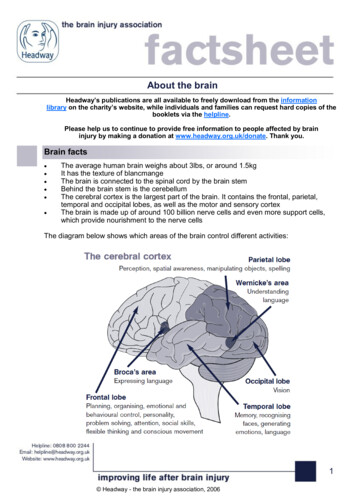
702Magnetic Resonance Materials in Physics, Biology and Medicine (2021) 34:697–706Fig. 4 MRF relaxometry maps on axial a, b, coronal c, d, sagittal e, f and T1WI post gadolinium g in a pathology proven atypicalmeningioma (Grade II). MRF-derived T1-relaxometry (a, c, e) and T2-relaxometry (b, d, f) maps show large inter-hemispheric meningi- 2 relaxation times of 2020 ms and 158 ms respecoma with T1 and Ttively. c Axial post-gadolinium T 1WI shows the non-homogenousenhancement and higher internal cystic component with resultantlonger relaxation times both on T 1 and T2brain slices, showing increased WM relaxation with aging.The relaxation range in the WM (700–1000 ms, 50–30 ms; T1, T2) was similar to our results. Korzdorfer et at [20] studied a 2D-MRF acquisition with seven slices and differentfield strengths (1.5 T and 3T) in selected brain structures,identifying a longer relaxation for the thalamus and caudate (1200–1400 ms, 40–50 ms; T 1, T2) compared to WM,also consistent with the findings of this investigation. Thenovelty of our study is the introduction of a whole-brain3D-MRF acquisition that is able to describe similar resultsobtained from other studies but with an isotropic 1 mm3resolution allowing the reconstruction of a 512 axial, coronalor sagittal slices. Therefore, the entire brain can be depicted.Importantly, this study was performed on a scanner from adifferent manufacturer with an acquisition time that is evenshorter than those mentioned studies (acquisition length wasbetween 5 [20] and 10 min [45]). The reduced acquisitiontime allows the proposed sequence to attain robust clinical feasibility and shows that MRF-based relaxation may bemanufacturer agnostic.The use of MRF-based T 1 and T 2 relaxometry representsan evolution of the concept of relaxometry as a biomarker ofdisease in the diagnosis and staging of intracranial masses[24, 42]. As early as 1980s, investigators described usingtwo different spin echo and one inversion recovery pulsesequences to compute relaxation values of meningioma [46,47]. The study by Komiyama et al. [46] indicated that T1and T2 values were greater for meningioma compared toanatomical structures due to higher water content, a findingconsistent with the results reported in this work. Similarly,MRF-based relaxometry values for intra-parenchymal braintumors have been reported to be greater than normal tissue13
Magnetic Resonance Materials in Physics, Biology and Medicine (2021) 34:697–706Fig. 5 Box and whisker plots for differences in T1 (a) and T2 (b)relaxation times between meningiomas and normal brain structures.The longitudinal lines depict the ranges, the light gray box the second quartile, the dark gray the third quartile and the solid horizontal line the median. For the meningiomas, the 25th percentile ( T1; T2: 1335 ms; 51 ms), median (T1;T2: 1416 ms; 65 ms), 75 percentileTable 1 T1 and T2 MRF-basedrelaxometry values for allpatientsMeningioma (n 25)Thalamus (n 20)CH (n 20)CS (n 20)CWM (n 20)703 (T1;T2: 1493 ms; 81 ms) were higher compared to all the anatomical structures. The different groups of meningiomas showed similar T1 and T 2 relaxation times. PRM partially resected meningioma, RIMradiation induced meningioma, CH caudate head, CS centrum semiovale, CWM contralateral white matter. *p 0.05 connotes statisticalsignificanceT1 mean (ms) SD T11 (ms) pT2 mean (ms) SD T21 (ms) .001*0.19 0.001* 0.001*273554Reference 0.001* 0.001*0.15 0.001*CS centrum semiovale, CH caudate head, CWM contralateral white matter*p 0.05 connotes statistical significance; values on bold are considered statistically significantaStandard deviation along the mean T1 and T2 among patients[23]. However, the advantage of MRF-based estimates isreduced acquisition time when compared to conventional T1and T2 mapping techniques, simultaneous multi-parameterrelaxometry mapping, improved accuracy, repeatability andreproducibility based on phantom experiments [15] and invivo studies [20]. It is therefore feasible that MRF couldbe used as a clinical tool to rapidly and accurately quantifyrelaxation times as a biomarker of disease for meningiomasas well as other intracranial brain masses [23, 24, 40].Quantitative MRI acquisitions other than MRF havebeen proposed to further elucidate the histological featuresof meningiomas, such as MR elastography and its basedstiffness estimates [34] as a possible presurgical planningtool [48]. In addition, ADC values acquired from DWI havebeen shown to correlate with aggressiveness of meningiomawith lower ADC values indicating more aggressive meningioma [31, 32]. Recently, Zhang et al. correlated longerMRF-based relaxations with softer meningioma consistencyafter surgical resection, although the stiffness evaluationin this work was subjective [49]. In this case, MRF-basedrelaxometry depicts quantitative information of meningiomastiffness, but importantly it may be capable of differentiatingmeningioma based on grade. Peritumoral edema is a featurethat may indicate more invasive meningioma [50], which inturn could led to a longer relaxation as analogous to previously published MRF-based correlation of increasing brainglioma tumor grade with prolongation of relaxation times[23, 24]. However, the use of MRF-based relaxation forpredicting meningioma grade needs a much larger numberof comparisons to design a statistically meaningful analysis13
704Magnetic Resonance Materials in Physics, Biology and Medicine (2021) 34:697–706than performed in this investigation, and given only threemeningiomas were Grade II, we were not able to performany statistical test for testing differences between Grade Iand Grade II tumors. Importantly, surgical and treatmentplanning of meningioma are influenced by their histologicalgrade [30–32, 48, 51] and if MRF could distinguish this, itcould have major clinical applications.There are several limitations of this study. The samplesize was small and was not powered to detect differencesbetween different types of meningioma. While statisticalsignificance was detected between meningioma and brainstructures, a larger sample size would likely provide a powered study to further evaluate these differences. Second, thediagnosis of meningioma was based on imaging findings andonly nine lesions had histologic confirmation. Ideally, complete classification of meningioma would require histological analysis, radiation status and tumor growth so as-to moreaccurately correlate with MRF-based relaxometry values.ConclusionsWhole-brain 3D-MR fingerprinting relaxometry estimateshave strong linear relationship with nominal values underexperimental phantom studies for the expected in-vivo brainrelaxometry values. Importantly, the short acquisition allowsMR fingerprinting to be feasible in a clinical setting whererelaxometry properties in meningiomas can be characterized using a high spatial resolution of 1mm3 and potentiallyshortening MRI time when surveillance of those tumorsis warranted. Although this analysis was not empoweredenough to assess the potential role of MRF-based relaxometry as biomarker of tumor grade, the promising features wedescribed with MR fingerprinting may guide investigationswith larger samples.Author contributions Conceptualization: TRM; AP; KPM; RJW;NGC. Methodology: TRM; AP; KPM; RJW. Formal analysis and investigation: TRM; AP. Writing—original draft preparation: TRM; KPM.Writing—review and editing: KPM; RJW; NGC; AL; YS.Funding This research was institutionally funded by the Center of Individualized Medicine at the Mayo Clinic in Rochester, MN.DeclarationsEthical approval This research was approved by the Mayo Clinic Institutional review board and all patients were consented.Conflict of Interest The authors have no conflict of interest to disclose.Open Access This article is licensed under a Creative CommonsAttribution 4.0 International License, which permits use, sharing,13adaptation, distribution and reproduction in any medium or format,as long as you give appropriate credit to the original author(s) and thesource, provide a link to the Creative Commons licence, and indicateif changes were made. The images or other third party material in thisarticle are included in the article’s Creative Commons licence, unlessindicated otherwise in a credit line to the material. If material is notincluded in the article’s Creative Commons licence and your intendeduse is not permitted by statutory regulation or exceeds the permitteduse, you will need to obtain permission directly from the copyrightholder. To view a copy of this licence, visit http:// creat iveco mmons. org/ licen ses/ by/4. 0/.References1. Panda A, Mehta BB, Coppo S, Jiang Y, Ma D, Seiberlich N, Griswold MA, Gulani V (2017) Magnetic resonance fingerprinting—an overview. Curr Opin Biomed Eng 3:56–66. https:// doi. org/ 10. 1016/j. cobme. 2017. 11. 0012. Jiang Y, Ma D, Seiberlich N, Gulani V, Griswold MA (2015)MR fingerprinting using fast imaging with steady state precession(FISP) with spiral readout. Magn Reson Med 74(6):1621–1631.https:// doi. org/ 10. 1002/ mrm. 255593. Ma D, Gulani V, Seiberlich N, Liu K, Sunshine JL, Duerk JL,Griswold MA (2013) Magnetic resonance fingerprinting. Nature495(7440):187–192. https:// doi. org/ 10. 1038/ natur e119714. Gómez PA, Molina-Romero M, Buonincontri G, Menzel MI,Menze BH (2019) Designing contrasts for rapid, simultaneousparameter quantification and flow visualization with quantitativetransient-state imaging. Sci Rep 9(1):8468. https:// doi. org/ 10. 1038/ s41598- 019- 44832-w5. Kurzawski JW, Cencini M, Peretti L, Gómez PA, Schulte RF,Donatelli G, Cosottini M, Cecchi P, Costagli M, Retico A, TosettiM, Buonincontri G (2020) Retrospective rigid motion correctionof three-dimensional magnetic resonance fingerprinting of thehuman brain. Magn Reson Med 84(5):2606–2615. https:// doi. org/ 10. 1002/ mrm. 283016. Ma D, Jiang Y, Chen Y, McGivney D, Mehta B, Gulani V, Griswold M (2018) Fast 3D magnetic resonance fingerprinting fora whole-brain coverage. Magn Reson Med 79(4):2190–2197.https:// doi. org/ 10. 1002/ mrm. 268867. Ma D, Jones SE, Deshmane A, Sakaie K, Pierre EY, Larvie M,McGivney D, Blümcke I, Krishnan B, Lowe M, Gulani V, NajmI, Griswold MA, Wang ZI (2019) Development of high-resolution3D MR fingerprinting for detection and characterization of epileptic lesions. J
An institutional review board approved study was used to acquire MRF data in patients scheduled for a diagnostic brain MR examination. The MRF sequence was added to the clinical protocol and acquired prior to the administration of a gadolinium-based contrast agent to assess the native relaxometry of the in-vivo brain.