Transcription
Technical AnalysisPDF generated using the open source mwlib toolkit. See http://code.pediapress.com/ for more information.PDF generated at: Wed, 02 Feb 2011 16:50:34 UTC
ContentsArticlesTechnical analysisCONCEPTS111Support and resistance11Trend line (technical analysis)15Breakout (technical analysis)16Market trend16Dead cat bounce21Elliott wave principle22Fibonacci retracement29Pivot point31Dow Theory34CHARTS37Candlestick chart37Open-high-low-close chart39Line chart40Point and figure chart42Kagi chart45PATTERNS: Chart Pattern47Chart pattern47Head and shoulders (chart pattern)48Cup and handle50Double top and double bottom51Triple top and triple bottom52Broadening top54Price channels55Wedge pattern56Triangle (chart pattern)58Flag and pennant patterns60The Island Reversal63Gap (chart pattern)64PATTERNS: Candlestick pattern68
Candlestick pattern68Doji89Hammer (candlestick pattern)92Hanging man (candlestick pattern)93Inverted hammer94Shooting star (candlestick pattern)94Marubozu95Spinning top (candlestick pattern)96Three white soldiers97Three Black Crows98Morning star (candlestick pattern)99Hikkake PatternINDICATORS: Trend100102Average Directional Index102Ichimoku Kinkō Hyō103MACD104Mass index108Moving average109Parabolic SAR115Trix (technical analysis)116Vortex Indicator118Know Sure Thing (KST) Oscillator121INDICATORS: Momentum124Momentum (finance)124Relative Strength Index125Stochastic oscillator128Williams %R131INDICATORS: Volume132Volume (finance)132Accumulation/distribution index133Money Flow Index134On-balance volume135Volume Price Trend136Force Index137Negative volume index137
Ease of movementINDICATORS: Volatility140141Volatility (finance)141Average True Range144Bollinger Bands145Donchian channel149Standard deviation149INDICATORS: Other162Advance decline line162Commodity Channel Index163Coppock curve165Keltner channel166McClellan Oscillator167Ulcer Index168Ultimate Oscillator170ReferencesArticle Sources and Contributors172Image Sources, Licenses and Contributors176Article LicensesLicense179
Technical analysisTechnical analysisIn finance, technical analysis is a security analysis discipline for forecasting the direction of prices through thestudy of past market data, primarily price and volume.[1] Behavioral economics and quantitative analysis incorporatesubstantial aspects of technical analysis,[2] which being an aspect of active management stands in contradiction tomuch of modern portfolio theory. According to the weak-form efficient-market hypothesis, such forecasting methodsare valueless, since prices follow a random walk or are otherwise essentially unpredictable.HistoryThe principles of technical analysis derive from the observation of financial markets over hundreds of years.[3] Theoldest known hints of technical analysis appear in Joseph de la Vega's accounts of the Dutch markets in the 17thcentury. In Asia, the oldest example of technical analysis is thought to be a method developed by Homma Munehisaduring early 18th century which evolved into the use of candlestick techniques, and is today a main charting tool.[4][5]In the 1920s and 1930s Richard W. Schabacker published several books which continued the work of Dow andWilliam Peter Hamilton in his books Stock Market Theory and Practice and Technical Market Analysis. At the endof his life he was joined by his brother in law, Robert D. Edwards who finished his last book. In 1948 Edwards andJohn Magee published Technical Analysis of Stock Trends which is widely considered to be one of the seminalworks of the discipline. It is exclusively concerned with trend analysis and chart patterns and remains in use to thepresent. It is now in its 9th edition. As is obvious, early technical analysis was almost exclusively the analysis ofcharts, because the processing power of computers was not available for statistical analysis. Charles Dow reportedlyoriginated a form of chart analysis used by technicians—point and figure analysis.Dow Theory is based on the collected writings of Dow Jones co-founder and editor Charles Dow, and inspired theuse and development of modern technical analysis from the end of the 19th century. Other pioneers of analysistechniques include Ralph Nelson Elliott, William Delbert Gann and Richard Wyckoff who developed theirrespective techniques in the early 20th century.Many more technical tools and theories have been developed and enhanced in recent decades, with an increasingemphasis on computer-assisted techniques.General descriptionWhile fundamental analysts examine earnings, dividends, new products, research and the like, technical analystsexamine what investors fear or think about those developments and whether or not investors have the wherewithal toback up their opinions; these two concepts are called psych (psychology) and supply/demand. Technicians employmany techniques, one of which is the use of charts. Using charts, technical analysts seek to identify price patternsand market trends in financial markets and attempt to exploit those patterns.[6] Technicians use various methods andtools, the study of price charts is but one.Supply/demand indicators monitor investors' liquidity; margin levels, short interest, cash in brokerage accounts, etc.,in an attempt to determine whether they have any money left. Other indicators monitor the state of psych - areinvestors bullish or bearish? - and are they willing to spend money to back up their beliefs. A spent-out bull cannotmove the market higher, and a well heeled bear won't!; investors need to know which they are facing. In the end,stock prices are only what investors think; therefore determining what they think is every bit as critical as anearnings estimate.Technicians using charts search for archetypal price chart patterns, such as the well-known head and shoulders ordouble top/bottom reversal patterns, study technical indicators, moving averages, and look for forms such as lines ofsupport, resistance, channels, and more obscure formations such as flags, pennants, balance days and cup and handlepatterns.1
Technical analysisTechnical analysts also widely use market indicators of many sorts, some of which are mathematical transformationsof price, often including up and down volume, advance/decline data and other inputs. These indicators are used tohelp access whether an asset is trending, and if it is, its probability of its direction and of continuation. Techniciansalso look for relationships between price/volume indices and market indicators. Examples include the relativestrength index, and MACD. Other avenues of study include correlations between changes in options (impliedvolatility) and put/call ratios with price. Also important are sentiment indicators such as Put/Call ratios, bull/bearratios, short interest and Implied Volatility, etc.There are many techniques in technical analysis. Adherents of different techniques (for example, candlestickcharting, Dow Theory, and Elliott wave theory) may ignore the other approaches, yet many traders combineelements from more than one technique. Some technical analysts use subjective judgment to decide which pattern(s)a particular instrument reflects at a given time, and what the interpretation of that pattern should be. Others employ astrictly mechanical or systematic approach to pattern identification and interpretation.Technical analysis is frequently contrasted with fundamental analysis, the study of economic factors that influencethe way investors price financial markets. Technical analysis holds that prices already reflect all such trends beforeinvestors are aware of them. Uncovering those trends is what technical indicators are designed to do, imperfect asthey may be. Fundamental indicators are subject to the same limitations, naturally. Some traders use technical orfundamental analysis exclusively, while others use both types to make trading decisions which conceivably is themost rational approach.Users of technical analysis are often called technicians or market technicians. Some prefer the term technical marketanalyst or simply market analyst. An older term, chartist, is sometimes used, but as the discipline has expanded andmodernized, the use of the term chartist has become less popular, as it is only one aspect of technical analysis.CharacteristicsTechnical analysis employs models and trading rules based on price and volume transformations, such as the relativestrength index, moving averages, regressions, inter-market and intra-market price correlations, cycles or, classically,through recognition of chart patterns.Technical analysis stands in contrast to the fundamental analysis approach to security and stock analysis. Technicalanalysis analyses price, volume and other market information, whereas fundamental analysis looks at the actual factsof the company, market, currency or commodity. Most large brokerage, trading group, or financial institution willtypically have both a technical analysis and fundamental analysis team.Technical analysis is widely used among traders and financial professionals, and is very often used by active daytraders, market makers, and pit traders. In the 1960s and 1970s it was widely dismissed by academics. In a recentreview, Irwin and Park[7] reported that 56 of 95 modern studies found it produces positive results, but noted thatmany of the positive results were rendered dubious by issues such as data snooping so that the evidence in support oftechnical analysis was inconclusive; it is still considered by many academics to be pseudoscience.[8] Academics suchas Eugene Fama say the evidence for technical analysis is sparse and is inconsistent with the weak form of theefficient-market hypothesis.[9] [10] Users hold that even if technical analysis cannot predict the future, it helps toidentify trading opportunities.[11]In the foreign exchange markets, its use may be more widespread than fundamental analysis.[12] [13] This does notmean technical analysis is more applicable to foreign markets, but that technical analysis is more recognized there asto its efficacy there than elsewhere. While some isolated studies have indicated that technical trading rules mightlead to consistent returns in the period prior to 1987,[14] [15] [16] [17] most academic work has focused on the nature ofthe anomalous position of the foreign exchange market.[18] It is speculated that this anomaly is due to central bankintervention, which obviously technical analysis is not designed to predict.[19] Recent research suggests thatcombining various trading signals into a Combined Signal Approach may be able to increase profitability and reducedependence on any single rule.[20]2
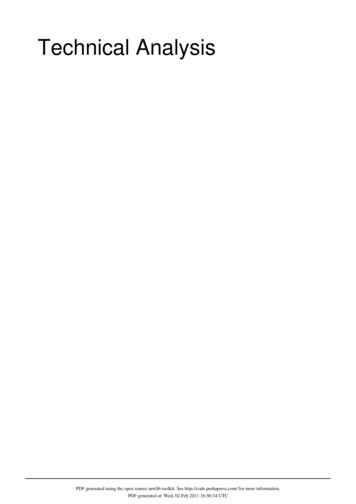
Technical analysis3PrinciplesTechnicians say that a market's price reflects all relevant information,so their analysis looks at the history of a security's trading patternrather than external drivers such as economic, fundamental and newsevents. Price action also tends to repeat itself because investorscollectively tend toward patterned behavior – hence technicians' focuson identifiable trends and conditions.Market action discounts everythingStock chart showing levels of support (4,5,6, 7,and 8) and resistance (1, 2, and 3); levels ofresistance tend to become levels of support andvice versa.Based on the premise that all relevant information is already reflectedby prices, technical analysts believe it is important to understand whatinvestors think of that information, known and perceived; studies such as by Cutler, Poterba, and Summers titled"What Moves Stock Prices?" do not cover this aspect of investing.Prices move in trendsTechnical analysts believe that prices trend directionally, i.e., up, down, or sideways (flat) or some combination. Thebasic definition of a price trend was originally put forward by Dow Theory.[6]An example of a security that had an apparent trend is AOL from November 2001 through August 2002. A technicalanalyst or trend follower recognizing this trend would look for opportunities to sell this security. AOL consistentlymoves downward in price. Each time the stock rose, sellers would enter the market and sell the stock; hence the"zig-zag" movement in the price. The series of "lower highs" and "lower lows" is a tell tale sign of a stock in a downtrend.[21] In other words, each time the stock moved lower, it fell below its previous relative low price. Each time thestock moved higher, it could not reach the level of its previous relative high price.Note that the sequence of lower lows and lower highs did not begin until August. Then AOL makes a low price thatdoesn't pierce the relative low set earlier in the month. Later in the same month, the stock makes a relative high equalto the most recent relative high. In this a technician sees strong indications that the down trend is at least pausing andpossibly ending, and would likely stop actively selling the stock at that point.History tends to repeat itselfTechnical analysts believe that investors collectively repeat the behavior of the investors that preceded them."Everyone wants in on the next Microsoft," "If this stock ever gets to 50 again, I will buy it," "This company'stechnology will revolutionize its industry, therefore this stock will skyrocket" – these are all examples of investorsentiment repeating itself. To a technician, the emotions in the market may be irrational, but they exist. Becauseinvestor behavior repeats itself so often, technicians believe that recognizable (and predictable) price patterns willdevelop on a chart.[6]Technical analysis is not limited to charting, but it always considers price trends. For example, many techniciansmonitor surveys of investor sentiment. These surveys gauge the attitude of market participants, specifically whetherthey are bearish or bullish. Technicians use these surveys to help determine whether a trend will continue or if areversal could develop; they are most likely to anticipate a change when the surveys report extreme investorsentiment. Su
Market trend 16 Dead cat bounce 21 Elliott wave principle 22 Fibonacci retracement 29 Pivot point 31 Dow Theory 34 CHARTS 37 Candlestick chart 37 Open-high-low-close chart 39 Line chart 40 Point and figure chart 42 Kagi chart 45 PATTERNS: Chart Pattern 47 Chart pattern 47 Head and shoulders (chart pattern) 48 Cup and handle 50 Double top and double bottom 51 Triple top and triple bottom 52 .