Transcription
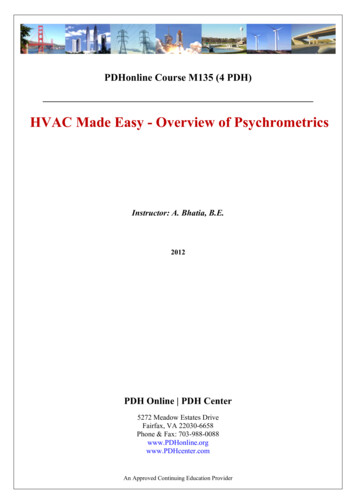
PDHonline Course M135 (4 PDH)HVAC Made Easy - Overview of PsychrometricsInstructor: A. Bhatia, B.E.2012PDH Online PDH Center5272 Meadow Estates DriveFairfax, VA 22030-6658Phone & Fax: 703-988-0088www.PDHonline.orgwww.PDHcenter.comAn Approved Continuing Education Provider
www.PDHcenter.comPDH Course M135www.PDHonline.orgHVAC made easy- Overview of PsychrometricsCourse ContentIntroductionPsychrometrics (derived from the Greek: psukhros cold) is study of air-water vapormixtures at different conditions. To quote the 1989 ASHRAE Handbook of Fundamentals,"Psychrometrics deals with the thermodynamic properties of moist air and uses theseproperties to analyze conditions and processes involving moist air." Take a note; it is notthe same as psychometric, which your spell checker may offer you as an alternative!While the study of pure psychrometrics involves a number of different aspects, we shallrestrict this course to the application of psychrometrics for use on human comfort in theair-conditioning system. In air-conditioning system, we use psychrometric properties forenvironment control.Human comfortThe common notion is that as long as cooling or heating (in winters) takes place, theenvironmental conditions are comfortable or the air conditioning is effective. Over aperiod of time, experience as well as research has shown that there is much more tohuman comfort than just temperature. There are four major factors that determine comfort Air temperature (dry bulb temperature or DBT) Humidity (relative humidity RH) Air movement (velocity fpm or m/s) Internal Quality of Air1. Air temperature (DBT)The dry-bulb temperature is the temperature of the air around us and is the mostimportant of all of the above factors. The human body's primary response is towardsthe changes in temperatures and it is this temperature that we attempt to keep withincomfort conditions while designing structures for habitation.2. Humidity (RH %)The atmosphere always contains moisture in the form of water vapor. The maximumamount of water vapor that may be contained in the air depends on the temperature;1
www.PDHcenter.comPDH Course M135www.PDHonline.org‘higher the temperature of the air, the more water vapor may be contained’. At hightemperatures and high moisture contents extreme discomfort is experienced as theevaporation of moisture from the body into the atmosphere by the process of perspirationbecomes difficult. Saturated air at 100% prevents any evaporative cooling.3. Air movement (v)The air movement can produce different thermal effects at different air temperatures,in the following two ways: It increases convective heat loss, as long as the temperature of the moving air isless than the skin temperature. It provides cooling through evaporation at low humidity levels and at higherhumidity’s above 85%, air movement cannot help add vapor to the already highlysaturated air.'Pleasant' ranges of air movements induce skin evaporation, more significantly inmedium (40%-50%) humidity’s.4. Air qualityThe air quality is important. In order to control the air purity the air supply to the spaceis filtered. The degree of filtration will depend on specified requirements for theenvironment within the room.In addition to the dust control, the air-quality demands precise temperature and RHlevels. Too low RH irritates respiratory organs and dust populations increase rapidlyat RH levels above 50% and fungal amplifications might occur above 65% RH.Standard is 30% to 60%.Other factors that influence comfort that are subjective, non-quantifiable individual factorsinclude the metabolic rate of an individual, type of physical activity, clothing, body build,conditions of health, acclimatization to new environments, food and drink etc. Generallyspeaking, the thermal comfort is associated with the metabolism rate of an individual thatled to the production of heat.Comfort zone2
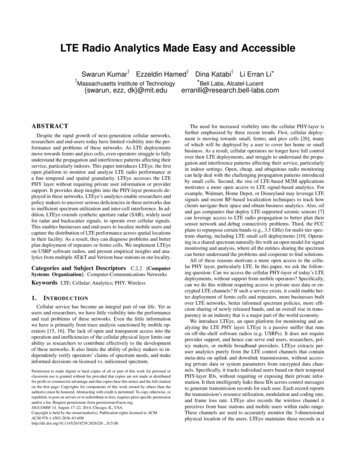
www.PDHcenter.comPDH Course M135www.PDHonline.orgIt is an area plotted on the psychrometric chart that pertains to those conditions of drybulb temperature, wet-bulb temperature, wind speeds etc. in which most people wearingspecified cloths and involved in specific activity will feel comfortable, i.e., neither too coldnor too warm. The comfort range of temperature varies between 70 to 76 F dry bulbtemperatures and 45 - 65% relative humidity. This applies mainly to summer airconditioning. During cold winters the comfort condition would be in the range of 65 to68 F dry bulb temperature and relative humidity of a minimum of 30%.Studies of personal comfort have shown that relative humidity ranges between 30% and65% can be considered 'comfortable' depending on activity. However, from the standpointof indoor air quality, upper ranges should be maintained below 50% (dust mitepopulations increase rapidly at relative humidity levels above 50% and fungalamplification occurs above 65%). Below 30% respiratory irritation occurs or static electriccurrents is a concern.Figure Showing Psychrometric Chart Climate Classification3
www.PDHcenter.comABCPDH Course M135www.PDHonline.orgof PsychrometricsThe most common traditional way to evaluate air properties is with the use of apsychrometric chart showing thermodynamic properties of air at a sea level barometricpressure of 29.921 inches of mercury. To a novice, psychrometric chart seems a dizzyingmaze of lines and curves going every which way. This appearance stems from the factthat a psychrometric chart conveys an amazing amount of information about air. For anygiven point on a psych chart, one can read the dry and wet bulb temperatures, relativehumidity, humidity ratio, enthalpy, and specific volume. Once a few fundamental thingsare understood, it is not really that difficult to understand the psychrometric chart.Dry bulb temperature: The temperature of air as registered by an ordinary thermometerWet bulb temperature: The temperature registered by a thermometer whose bulb iscovered by a wetted wick and exposed to a current of rapidly moving airDew point temperature: The temperature at which condensation of moisture begins whenthe air is cooled.Relative humidity: RH is an expression of the moisture content of a given atmosphere asa percentage of the saturation humidity at the same temperature.Absolute humidity or moisture content: The weight of water vapor in grains or pounds ofmoisture per pound of dry air or grams of water vapor per kg of air, i.e. g/kg. It is alsoknown as moisture content or humidity ratio.Saturation Humidity: Air at a given temperature can support only a certain amount ofmoisture and no more. This is referred to as the saturation humidity.Enthalpy: A thermal property indicating the quantity of heat in the air above an arbitrarydatum, in Btu per pound of dry air. The datum for dry air is 0 deg F and, for the moisturecontent 32 deg F water.Enthalpy deviation: Enthalpy indicated above, for any given condition is the enthalpy ofsaturation. It should be corrected by the enthalpy deviation due to the air not being in thesaturated state. Enthalpy deviation is in Btu per pound of dry air. Enthalpy deviation is4
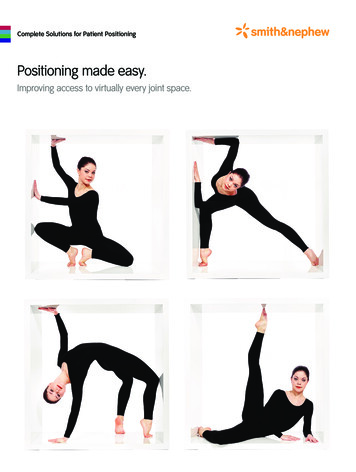
www.PDHcenter.comPDH Course M135www.PDHonline.orgapplied where extreme accuracy is required; however, on normal air conditioningestimates it is omitted.Specific volume: The cubic feet of the mixture per pound of dry air or cubic meter of the3mixture per kg of dry air represented in m /kg. It is the reciprocal of densitySensible heat: is the heat content causing an increase in dry-bulb temperature.Latent heat: is the heat content due to the presence of water vapour in the atmosphere. Itis the heat, which was required to evaporate the given amount of moisture.Total heat: is the sum of sensible and latent heat.Sensible heat factor: The ratio of sensible to total heat.The dry-bulb, wet-bulb, and dew point temperatures and the relative humidity are sorelated that, if two properties are known, all other properties may then be determined.Psychometrics ChartA psychrometric chart presents physical and thermal properties of moist air in a graphicalform. Calculations of air properties otherwise are not very straightforward. Many differentequations are often needed to obtain one single point. Standard psychrometric charts aretherefore welcome tools to perform psychrometric analysis.Psychrometric properties are dependent on the atmospheric pressure, so theirdetermination at different elevations is filled with errors that may be considerable athigher altitudes. Psychrometric charts developed for specific atmospheric conditionseliminate errors but lack general applicability. The computer programs to handle thesetasks greatly help reduce errors and allow fast and reliable psychrometric calculations forany given atmospheric pressure.Psychrometric charts are printed mostly for sea level atmospheric pressure. Sinceovirtually all psychrometric air processes involving HVAC design occur within a 30 F ando120 F range, most psychrometric charts only show this range as a practical measure.Psychrometric properties are also available as data tables, equations, and slide rulers.5
www.PDHcenter.comPDH Course M135www.PDHonline.orgFigure below is a psychrometric chart in customary units, which describes the importantmoist air properties: dry-bulb and wet-bulb temperatures, relative humidity, humidity ratio,specific volume, dew point or saturation temperature, and enthalpy.6
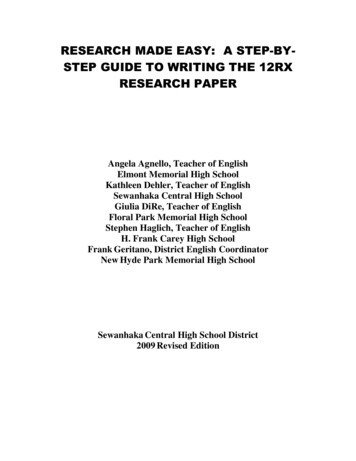
www.PDHcenter.comPDH Course M135www.PDHonline.orgPsychometrics ExplanationA psychrometric chart contains a lot of information packed in an odd-shaped graph.The psychrometric chart highlights seven properties of air:1. Dry Bulb Temperature (DBT)2. Wet Bulb Temperature (WBT)3. Saturation Temperature4. Relative Humidity5. Humidity Ratio6. Volume7. EnthalpyAt first glance, the chart appears complex; however, separating the various lines andscales on the chart simplifies understanding their location, meaning and use.Before we go further, we need to pause and review the definitions of these 7 terms pieceby piece on the psychrometric chart.Psychrometric Chart BoundariesThe horizontal X-axis denotes dry bulbtemperature (DBT) scale. Vertical linesindicate constant dry bulb temperature.DBT is the air temperature measured in C or F and determined by an ordinaryglass thermometer. It is called "dry-bulb"since the sensing tip of the thermometeris dry (see "wet bulb temperature" forcomparison). Since this temperature is socommonly used, it can be assumed thattemperatures are dry-bulb temperaturesunless otherwise designated.Dry bulb temperature linesY-axis indicates humidity ratio orabsolute humidity, which is the weightof the water, contained in the air per unitof dry air. This is often expressed aspounds of moisture per pound of dry airor (g/Kg). Since the humidity ratio of7
www.PDHcenter.comPDH Course M135www.PDHonline.orgmoist air is not dependent ontemperature, as is relative humidity, it iseasier to use in calculations. Humidityratio is found on the vertical, y-axis withlines of constant humidity ratio runninghorizontally across the chart.Curved boundary represents saturatedair line or dew point temperature line.Saturation line is a temperature conditionat which water will begin to condense outof moist air. Given air at a certain drybulb temperature and relative humidity, ifthe temperature is allowed to decrease,the air is no longer able to hold as muchmoisture. When air is cooled, the relativehumidity increases until saturation isreached and condensation occurs.Condensation occurs on surfaces, whichare at or below the dew-pointtemperature. Dew-point temperature isdetermined by moving from a state pointSaturation Line, Absolute Humidity andhorizontally to the left along lines ofDry bulb temperature linesconstant humidity ratio until the upper,curved, saturation temperature boundaryis reached.Let’s study this a little further Relative humidity (RH) : The termrelative humidity is simply a ratio betweenthe actual moisture content of the aircompared with the moisture content of theair required for saturation at the sametemperature, i.e. at 100% relative humidity(also known as saturation point).In practice, relative humidity indicates the8
www.PDHcenter.comPDH Course M135www.PDHonline.orgmoisture level of the air compared to theair moisture-holding capacity.RH 100 x AH/SH (%)The curved lines running from the bottomleft and sweeping up through to the topright of the chart represent lines ofconstant relative humidity. The line for100 percent relative humidity, orsaturation, is the upper, left boundary ofthe chart.Relative humidity is a relative measure,Relative Humidity Linesbecause the moisture-holding capacity ofair increases as air is warmed.Wet-bulb temperature (WBT) isdetermined when air is circulated past awetted sensor tip. It represents thetemperature at which water evaporatesand brings the air to saturation. Inherentin this definition is an assumption that noheat is lost or gained by the air.This is different from dewpointtemperature where a decrease intemperature, or heat loss, decreases themoisture holding capacity of the air, andhence, water condenses.The 'status point' is determined at theintersection of the vertical DBT line andthe sloping WBT line of theWet Bulb Temperature Linespsychrometric chart.When the air is fully saturated, the DBTand WBT readings are identical andthere is no evaporation.Determination of wet-bulb temperatureon this psychrometric chart follows linesof constant enthalpy but values are readoff the upper, curved, saturation9
www.PDHcenter.comPDH Course M135www.PDHonline.orgtemperature boundary.Wet-bulb temperature represents howmuch moisture the air can evaporate.Specific volume indicates the spaceoccupied by air. It is the reciprocal ofdensity and is expressed as a volume per33unit weight in ft / lb or m /kg (density isweight per unit volume). Warm air is lessdense than cool air, which causeswarmed air to rise. This phenomenon isknown as thermal buoyancy. B
To quote the 1989 ASHRAE Handbook of Fundamentals, . psychrometric chart showing thermodynamic properties of air at a sea level barometric pressure of 29.921 inches of mercury. To a novice, psychrometric chart seems a dizzying maze of lines and curves going every which way. This appearance stems from the fact that a psychrometric chart conveys an amazing amount of