Transcription
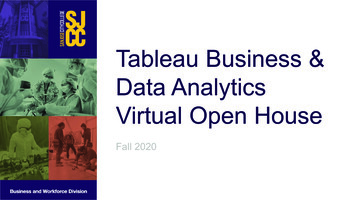
Tableau Business &Data AnalyticsVirtual Open HouseFall 2020
Welcome RemarksDr. Lena Tran,VP of Strategic Partnerships and Workforce InnovationFaculty:Sanjay Dorairaj
ClassesFALL 2020 CIS 120: Fundamentals ofBusiness & Data Analytics9/28-11/6 (6 weeks) CIS 122: SQL for DataAnalytics11/9-12/17 (6 weeks) NOTE: Courses are onlineSPRING 2021 CIS 123: Data Visualizationwith Tableau(Est. 1/25/21-3/19/21) CIS 124: Utilizing Statistics forData Analytics(Est. 3/22/21-5/21/21)
Businessand DataAnalyticsProgramGoals– Provide aspiring students within theSan Jose community to learn andachieve mastery in the field of DataScience.– Bridge the San Jose community withjob opportunities in Data Science, oneof the fastest-growth tech occupationsin the present decade.
–How wedo this?–Partnering with a premium institution to delivercontent that is relevant, reputable and that resonateswith the types of challenges that companies facetoday.Key dimensions for skills development Develop a strong understanding of Analytics ina business context. Identify the role and structure of relationaldatabases as they apply to Data Analytics. Create compelling data visualizations usingTableau in the context of business and dataanalytics. Develop Statistics techniques and skills toperform data analysis on real-world data usingtools such as Google Sheets and Python.
Delivery FormatCIS-120Business & Data AnalyticsCIS-123Data VisualizationCIS-122SQL for Data AnalyticsFALL SEMESTER (2020)CIS-124Statistics for DataAnalyticsSPRING SEMESTER 2021
COURSE DETAILSCIS 120 – Fundamental of Business & Data AnalyticsCIS 122 – SQL for Data AnalyticsCIS 123 – Visualization with TableauCIS124 – Utilizing Statistics for Data Analytics
CIS-120Fundamentalsof Business &Data AnalyticsDevelop students’ understanding of analytics inthe context of a business and to provide aframework for students to apply topics such as:––––––– Framing a business problemStakeholder analysisData wrangling using Google SheetsData visualizationsDescriptive statisticsExploratory data analysisData storytelling in businessStudents will learn how to clean, visualize,analyze, and communicate data insights tostakeholders.Culminates in a hands-on final project in whichstudents will perform an end-to-end exploratorydata analysis (EDA) using real industry data.
CIS-122SQL forDataAnalytics Students will be introduced to Structured QueryLanguage (SQL) and will learn to– Identify the role and structure of relationaldatabases as they apply to data analytics,– Apply the Structured Query Language(SQL) in MySQL for data manipulationlanguage (DML),– Apply the Structured Query Language(SQL) in MySQL for data definitionlanguage (DDL),– Apply normal forms (1NF, 2NF, & 3NF) fordatabase normalization.
CIS-123DataVisualizationwith Tableau Explore the role and application of datavisualization in the data analysis process usingTableau.Create and design – Both static and dynamic tables– Data visualizations, dashboards– Stories while incorporating visual designbest practices to better communicateinsights to intended audience– Such as business stakeholders.Students will also connect multiple externaldata sources (e.g., Text Files, Excel, SQLdatabases) to Tableau and optimize large datato efficiently wrangle and analyze real-industrydata.Focused on project-based learning andprepares students for the skills identified in theTableau Desktop Specialist certification.
CIS-124UtilizingStatistics forDataAnalytics This course is the fourth in the fourpart series focused on business / dataanalytics, and aimed at communitycollege students who have little or nobackground in business or analytics.The first three courses in the seriesare not necessarily prerequisites forthis course, but a basic familiarity withdata and spreadsheets is assumed.The course is focused on projectbased learning using Google Sheetsand Python to apply basic statisticaltechniques to data.
Finances & Apprenticeships Specific Scholarships are not available at this time Financial Aid, Jaguar Commitment, etc. areavailable to those who qualify Apprenticeship is getting approved through theDepartment of Apprenticeship Standards Once apprenticeships approved, we will be able toretroactively cover Tableau Business & DataAnalytics course tuitions
Apprenticeship Cont. 2000 hours (approximately 1 year) Minimum salary with potential raises Customized training and regular evaluations byemployer On form, indicate your interest. We will update youwith paperwork and additional information onceapprenticeship is approved by the state. Interview & hiring process with employer
SJCC Services Virtual Library Services,including e-books Textbook loan program Laptop loan program 24-Hour Online Tutoring Student Accessibility Services Academic & Mental HealthCounseling Services Food distribution available.Summer dates: 2nd & 4thWednesdays each month.Time: 10am-12pmLocation: By parking ng/
Career Education Services 3 Designated CE Counselors. Your POC: Julie.Nguyen@sjcc.edu Future Skills & Employment Center (virtual services still available)– Virtual Job Fair (September 15th 11AM-1PM)(www.sjcc.edu/home/job-fairs)– Virtual Mock Interviews (www.sjcc.edu/home/ce-job-resources)– “Your Future” Friday workshops (www.sjcc.edu/home/ce-job-resources) SJCC Job Board, College Central Network FREE LinkedIn Learning (www.sjcc.edu/home/linkedin) Career Closet (open once campus opens)
Enrollment Process Apply to SJCC if you are not a student Complete this form:https://forms.gle/YHWRSzum4vKXcUpFA SJCC will enroll you in the appropriatecourse(s) Attend class online via Canvas & Zoom
ond@sjcc.edu
with Tableau Explore the role and application of data visualization in the data analysis process using Tableau. Create and design – Both static and dynamic tables – Data visualizations, dashboards – Stories while incorporating visual design best prac
