Transcription
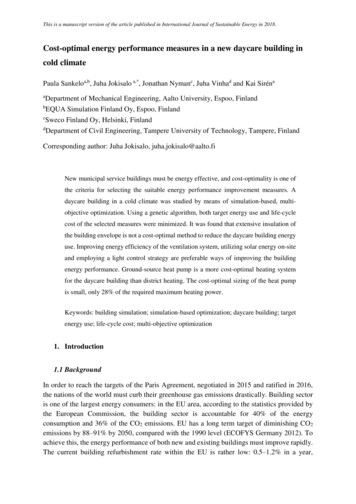
This is a manuscript version of the article published in International Journal of Sustainable Energy in 2018.Cost-optimal energy performance measures in a new daycare building incold climatePaula Sankeloa,b, Juha Jokisalo a,*, Jonathan Nymanc, Juha Vinhad and Kai SirénaaDepartment of Mechanical Engineering, Aalto University, Espoo, FinlandEQUA Simulation Finland Oy, Espoo, FinlandcSweco Finland Oy, Helsinki, FinlanddDepartment of Civil Engineering, Tampere University of Technology, Tampere, FinlandbCorresponding author: Juha Jokisalo, juha.jokisalo@aalto.fiNew municipal service buildings must be energy effective, and cost-optimality is one ofthe criteria for selecting the suitable energy performance improvement measures. Adaycare building in a cold climate was studied by means of simulation-based, multiobjective optimization. Using a genetic algorithm, both target energy use and life-cyclecost of the selected measures were minimized. It was found that extensive insulation ofthe building envelope is not a cost-optimal method to reduce the daycare building energyuse. Improving energy efficiency of the ventilation system, utilizing solar energy on-siteand employing a light control strategy are preferable ways of improving the buildingenergy performance. Ground-source heat pump is a more cost-optimal heating systemfor the daycare building than district heating. The cost-optimal sizing of the heat pumpis small, only 28% of the required maximum heating power.Keywords: building simulation; simulation-based optimization; daycare building; targetenergy use; life-cycle cost; multi-objective optimization1. Introduction1.1 BackgroundIn order to reach the targets of the Paris Agreement, negotiated in 2015 and ratified in 2016,the nations of the world must curb their greenhouse gas emissions drastically. Building sectoris one of the largest energy consumers: in the EU area, according to the statistics provided bythe European Commission, the building sector is accountable for 40% of the energyconsumption and 36% of the CO2 emissions. EU has a long term target of diminishing CO2emissions by 88–91% by 2050, compared with the 1990 level (ECOFYS Germany 2012). Toachieve this, the energy performance of both new and existing buildings must improve rapidly.The current building refurbishment rate within the EU is rather low: 0.5–1.2% in a year,
This is a manuscript version of the article published in International Journal of Sustainable Energy in 2018.depending on the region (Cubi, Ortiz, and Salom 2014). The refurbishment rate includes allrefurbishments, even those that do not include energy saving measures. This underlines thepressure of improving the energy efficiency of the newly erected buildings in an ambitiousmanner.The recast of the Energy Performance of Buildings Directive (EPBD) is one of the keyEU policy instruments regarding the emission goals in the building sector (EPBD recast 2010).The EPBD recast states that all new buildings must be nearly zero energy buildings (nZEB) by2021, and new public buildings must comply with the nearly zero energy requirements alreadyby 2019. “Nearly zero energy building” is defined in the directive as a building with a veryhigh energy performance, with the remaining enery needs covered by renewable energyproduction to a significant extent (EPBD recast 2010).The quantitative criteria for nearly zero energy buildings are defined by each memberstate in their national building code. An assessment of the still-ongoing implementation processis provided by D’Agostino (2015). The Finnish nZEB criteria are also in process of beingimplemented, and are expected to be finalized during the year 2017.The construction of all new municipal buildings in the EU will be directly affected bythe forthcoming nZEB regulations, and studies in the energy performance of municipalbuildings are of immediate importance. The EPBD also states that cost-optimal energyperformance measures should be selected, and therefore the cost-optimality of the solutionsshould be considered alongside the building energy performance. However, the cost-optimalityof the available energy saving measures depends on the municipal building type. Municipalitieshave public buildings with varying functions, such as school and daycare buildings,administrative buildings, assisted housing buildings, museums, et cetera. Conclusions drawnfrom studies of, for example, administrative buildings (see e.g. García-Sanz-Calcedo andLópez-Rodríguez 2017) or museum buildings (see e.g. Zannis et al. 2006) cannot be directlyapplied for educational buildings such as schools and daycare buildings, because of thedifferent building usage profiles. Energy use benchmarking in especially in municipal servicebuildings has been discussed by e.g. Cipriano, Carbonell, and Cipriano (2009).This study at hand presents a case of a new Finnish municipal daycare building and itsenergy performance, where cost-optimality is also an optimization target besides the buildingenergy use. Its objective is to assist in choosing energy saving measures for new municipaldaycare buildings in Northern European climates. The study was performed as a part of aFinnish research project “Comprehensive development of nearly zero-energy municipalservice buildings” (COMBI).1.2 Previous researchEnergy consumption of Finnish daycare buildings has been reported by Sekki, Airaksinen, andSaari (2015) and Sekki et al. (2016). In the existing daycare buildings, both heating andelectricity consumption vary significantly: there can be a tenfold difference in the electricityand heat consumption between the most energy-efficient and the poorest performing buildings.Lately several energy-efficient daycare buildings have been erected in Finland. The casebuilding of this study, Luhtaa daycare, is one of them.2
This is a manuscript version of the article published in International Journal of Sustainable Energy in 2018.The design of highly energy-efficient daycare buildings, either new or newly renovated,has been examined in a number of previous international studies, but not in the specific case ofFinnish daycare buildings. Furthermore, in the previous studies concerning daycare buildings,the building energy performance has been quantified with the help of building simulations, butsimulation-based optimization has not been applied to find the overall best solutions.Hammad, Ebaid, and Al-Hyari (2014) have studied a daycare energy retrofit in theclimate of Amman, Jordania. They examined energy efficiency improvements includingenergy-efficient lighting, improved thermal insulation, solar water heating system,photovoltaic (PV) panels and heat recovery from ventilation. These measures were evaluatedand ranked, based on the energy saving potential and the financial payback period. It was foundthat in the climate of Jordania, installing own solar energy production was preferable toimproving the thermal insulation of the building. However, simulation-based optimization wasnot applied to examine the interconnections between the selected measures. Although someoptions were found to be more cost-effective than others, it is not certain that the optimalcombination of all energy saving measures was found.Another daycare retrofit study was performed by Causone et al. (2015). Their targetbuilding was a daycare in Italy, and the aim of the retrofit design was to reach a zero energybuilding (ZEB) level, while maintaining good indoor climate conditions. Chosen energyperformance improvement measures included solar screens, own solar PV production, LEDlamps, improved thermal insulation and ventilation strategy. The amount of solar PV wasallowed to increase, until an annual net zero primary energy balance was reached. Thesuitability of the potential measures was estimated by simulating the building energyperformance in various pre-chosen scenarios; thus the interplay between the individualmeasurements was accounted for to an extent, but again the overall optimal solution was notguaranteed.A case of designing a new energy-efficient daycare building is reported by Arumägiand Kalamees (2016). A target of reaching either ZEB or nZEB level was chosen as the basisof the architectural design. Different energy efficiency measures were modelled with a numberof simulation cases, but not as a simulation-based optimization problem. It was demonstratedthat a daycare building can reach the Estonian ZEB level only by very careful and detailedbuilding energy system design, and with application of solar PV.Simulation-based optimization has been applied in previous studies concerning variousother building types. Niemelä, Kosonen, and Jokisalo (2016) have used simulation-basedoptimization to identify energy-efficient and cost-optimal renovation measures for a universitycampus building in a cold climate. Niemelä, Kosonen, and Jokisalo (2017a, 2017b) have alsoapplied the method for apartment buildings in cold climate. Delgarm et al. (2016) have usedsimulation-based optimization to optimize the energy performance of an office building in theclimate of Iran. Carlucci et al. (2015) have utilized simulation-based optimization to design anearly zero energy detached house in Southern Italian climate. In all these studies the selectedoptimization algorithm is a Non-dominated Sorting Genetic Algorithm II (NSGA-II), which iswell suited for such complex multi-objective optimization tasks (Deb et al. 2002), and alsoutilized in this study.3
This is a manuscript version of the article published in International Journal of Sustainable Energy in 2018.To the authors’ knowledge, there is no prior study where simulation-based, multipleobjective optimization has been applied in a case of a new daycare building in a cold climate.Especially in the EU, where new public and municipal buildings must be nearly zero energybuildings from the year 2019, such studies are valuable in identifying the cost-effective andenergy-efficient building solutions in the European climates. Results pertaining to a buildingin a Finnish climate will assist in choosing suitable solutions in the Northern Europeancountries with a similar climate.2. Methods and data2.1 Case study building descriptionThe case study building is Luhtaa daycare centre located in Tampere, Finland (61º30’ N, 23º52’E) (see Figure 1). Erected in 2012, Luhtaa daycare is one of the low energy pilot buildings ofTampere city, and it was the first Finnish daycare building to reach the passive buildingstandards. The building has a net floor area of 1438 m2 and provides care for 120 children(Sankelo 2016.). In this study, the existing building is simulated with the help of a simulationmodel, in order to explore various building system and structural solutions: both those thatwere actually implemented in the Luhtaa daycare, and those that were not.Luhtaa daycare building has a wood frame construction. The total thickness of the wallsis 500 mm, incorporating 400 mm of mineral wool insulation. The U-value targets for thebuilding envelope were 0.09 W/m2K for the external walls, 0.06 W/m2K for the roof and 0.07W/m2K for the base floor. The windows have a U-value of 0.66 W/m2K, and passive methodsare applied for solar shading. Heat recovery from the ventilation exhaust air has a temperatureefficiency of 60–80 %, depending on the air handling unit (AHU). 56 TopSun TS-S390 solarpanels are installed on the south-west facing roof section, each with a nominal power of 390Wp, totalling 22 kWp of own solar PVgeneration. (Nyman 2016, Sankelo 2016.)Luhtaa daycare is connected to the local district heating (DH) network, with connectiondimensioned at 102kW. District heating network provides heating for spaces, ventilation anddomestic hot water (DWH). Heat is distributed via water-based floor heating on the groundfloor, as well as radiators in the basement and ventilation system. The heating set-pointtemperature is 21 C, and dimensioning temperatures of the floor heating and radiators are35/30 C. Supply air temperature is controlled as a function of return air temperature, withmaximum supply air temperature of 24 C. Dimensioning of floor heating and radiator heatingcapacities in the building model was performed according to the Tampere design temperatureof -29 C. (Nyman 2016, Sankelo 2016.)The building basement houses three centralized AHUs, providing a constant air volume(CAV) ventilation system with a schedule control. One AHU is designated for the kitchen only,and provides also cooling for the kitchen. The main AHUs are all equipped with a heat recoveryunit (HRU). There are also separate exhausts in the toilet areas, with no heat recovery installed.In reality only the kitchen space is cooled, but while modelling the building, it was found thatthe maximum indoor temperature target of 25 C was violated. In order for the simulations topreserve the maximum indoor temperature of 25 C, which is recommended by Finland’s4
This is a manuscript version of the article published in International Journal of Sustainable Energy in 2018.national building code (Ministry of the Environment, 2012a), the building model was equippedwith supply air cooling in the AHUs.In a previous study, the daycare building was simulated with several possible heatingsolutions (district heating, pellet boiler, air-to-water heat pump, ground source heat pump), inorder to determine the cost-optimal heating option (Nyman 2016). When the heating systemwas considered alone, without altering the building structure or other building systems, groundsource heat pump (GSHP) was found to be the cost-optimal heating solution. In this study, bothdistrict heating and ground-source heat pump solutions are considered as separate optimizationcases, and finally compared with each other. This reveals whether GSHP is still the more costoptimal solution, when other building systems and structures can be modified as well.The suitability of building energy performance improvements depends closely on thebuilding usage profiles. The usage profiles used in the study are described in detail by Nyman(2016). The used occupancy profile is based on survey data collected from the actual buildingusers (Figure 2). DHW consumption profile in the building models is based on the measuredDHW consumption of the building which is 188 dm3/m2,a at annual level. The fixed DHWconsumption (53 dm3/h) during the weekdays is used in the simulation while there is no DHWconsumption during the unoccupied days (during the weekends and from late June to earlyAugust).Figure 1. Luhtaa daycare centre (upper) and its floor plan (lower).5
This is a manuscript version of the article published in International Journal of Sustainable Energy in 2018.Figure 2. The occupancy profile of Luhtaa daycare centre.2.2 Weather dataFinland is divided into four climate zones (I–IV) according to the Finnish building code forbuilding energy performance calculation (Ministry of the Environment 2012b). According tothis classification, the case study building in Tampere is located in zone I, which is thesouthernmost climate zone in Finland.The hourly test reference year (TRY) used in this study represents the current climaticconditions of the climate zone I, and is described in Kalamees et al. (2012). The TRY wasdeveloped based on weather data measured at the weather station of Helsinki-Vantaa airportby the Finnish Meteorological Institute. The annual average temperature of the used weatherdata is 5.4 C, and the average degree day number is 3952 Kd at indoor temperature of17.0 C.2.3 Simulation-based optimizationSimulation-based optimization is gaining popularity as a method in building energyperformance analysis. Buildings are complex systems, often with zones intended for differentusages, incorporating an assortment of technologies, and subject to varying weather conditions.In a simulation-based optimization problem, the decision variables are passed on to the buildingsimulation model, which in turn returns the desired end results to the optimization engine. Witha suitable optimization algorithm, the optimal combinations of decision variables solutions arefound reasonably quickly, even when the number of possible combinations reaches millions.For a review on simulation-based building performance optimization see e.g. Nguyen, Reiter,and Rigo (2014).6
This is a manuscript version of the article published in International Journal of Sustainable Energy in 2018.In this study, the building simulations are performed with a simulation software IDAIndoor Climate and Energy (IDA ICE) version 4.7 (Sahlin et al. 2004). IDA ICE has beenvalidated in several studies (Travesi et al. 2001, Achermann and Zweifel 2003, Loutzenhiser,Manz, and Maxwell 2007, Equa Simulation AB 2010). In this optimization task IDA ICE isused in tandem with Multi-Objective Building Optimization Tool (MOBO) version beta 0.3b(Palonen, Hamdy, and Hasan 2013).The optimization algorithm chosen for the task is the genetic algorithm Pareto-archive NSGAII. NSGA-II is shown to be a computationally fast algorithm in multi-objective optimizationproblems (Deb et al. 2002), and is therefore well suited for simulation-based buildingperformance optimization. In the optimization tasks performed for this study, the geneticalgorithm was applied with a population of 12–16 members, and left to run for a duration of64–100 generations, totalling 769–1600 simulations. Based on initial testing, this amount ofsimulations was deemed sufficient for establishing the Pareto front of optimal solutions.2.4 Definition of the optimization casesThe multi-objective optimization case takes the form:Minimize(Target energy use and LCC)whereTarget energy use is defined for the two separate optimization cases:District heating (DH) caseTarget energy use Qlighting Qcooling Qequipment QAHU QDHwhereQlightingDelivered electricity consumed by lightingQcoolingDelivered electricity consumed by coolingQequipmentDelivered electricity consumed by equipmentQAHUDelivered electricity consumed by ventilationQDHDistrict heat delivered to the h/m2a]Ground source heat pump (GSHP) caseTarget energy use Qlighting Qcooling Qequipment QAHU QGSHP Qauxiliary(2)whereQlightingDelivered electricity consumed by lighting[kWh/m2a]QcoolingDelivered electricity consumed by cooling[kWh/m2a]QequipmentDelivered electricity consumed by equipment[kWh/m2a]QAHUDelivered electricity consumed by ventilation[kWh/m2a]QGSHPDelivered electricity consumed by GSHP[kWh/m2a]QauxiliaryDelivered electricity consumed by auxiliary heating[kWh/m2a]Target energy use is a target level, which is set for actual energy consumption at design stageof a building. Note that target energy use is defined here as the electricity and heat delivered tothe building from the ambient electrical grid or district heating network. The portion of the7
This is a manuscript version of the article published in International Journal of Sustainable Energy in 2018.demand that is covered by on-site generation is not included in target energy use: having owngeneration diminishes the need for energy delivered from the outside. It should also be notedthat excess electricity sold to the grid does not lower the target energy use of the building:excess PV production in the summer cannot be used to counterbalance building electricity useat other times. This is in accordance with the legislation draft for the upcoming Finnish nZEBregulations.Net present value of life-cycle cost is defined as:LCC Itot Mtot Rtot – Restot Edelivered,tot – Esold,tot(3)where Itot Mtot Rtot Restot Edelivered, tot Esold,tot[ ][ ][ ][ ][ ][ ]Investment costsMaintenance costsReplacement costsResidual value of the investments after a lifetime of 20 yearsCost of delivered energy (electricity heat) for 20 yearsProfit from selling the excess energy (solar electricity)LCC also includes the investment, maintenance, replacement and residual costs of the mainheating systems (DH and GSHP), because in this manner the overall life-cycle costs of the twosystems can be compared with each other. However, LCC does not represent all the costsincurring from the building construction. For example, the poorest building envelope insulationis considered a zero-cost option, whereas better insulation incurs costs. In this way, the LCCdefined here is not a definite price tag for erecting a specific type of building, but rather anindicator for assessing and comparing the cost-optimality of the specific energy-savingmeasures examined here.2.5 Building system and structural solutionsThe following building systems and structural solutions were investigated in this study, andthus selected as decision variables in the optimization cases: Solar PV panel installation Solar thermal collection installation (incl. hot water storage tank) Sizing of the ground source heat pump (in the GSHP optimization case) External wall, external roof and base floor insulation levels Window type selection Effectiveness of heat recovery from the main AHUs Installation of heat recovery units (HRUs) in the toilet separate exhausts Installation of variable air volume (VAV) ventilation system with CO2 control Installation of light control strategy (constant, daylight and occupancy control)8
This is a manuscript version of the article published in International Journal of Sustainable Energy in 2018.All decision variables are listed in Table 1 and described more closely below. The buildingarchitecture itself is not altered in the simulations, because the investigation on the architecturaldesign is not within the scope of this research.With the chosen decision variables, the total number of possible combinations is 1.7million in the district heating case, and nearly 156 million in the ground source heat pump case.With such a vast number of possible combinations, a parametric study would not suffice to findthe globally optimal solutions.Table 1. Decision variables for the optimization cases, corresponding to the buildingperformance improvement options.Decision variablesMaximumvalue600Variable typeSolar panel area [m2]Minimumvalue1.6Solar thermal collector area1 [m2]0/624Continuous172Continuous3 options (0.17, 0.14, 0.08)0.170.08DiscreteBase floor U-value [W/m2K], 2 options0.160.10DiscreteRoof U-value [W/m2K], 2 options0.090.07DiscreteWindow U-value [W/m2K], 6 options1.00.5DiscreteVentilation heat recovery efficiency [%]6080Discreteseparate exhausts [%]060DiscreteVentilation control strategy (CO2 control)Not installedInstalledDiscreteNot installedInstalledDiscreteContinuousGround source heat pump capacity [kW](only in the GSHP encyinLight control strategy (occupancy, daylightand constant light control)1Minimum area for solar thermal collectors is 0 m2 in the GSHP case and 6 m2 in the DH case.Solar PV panel installationOwn solar PV generation is already utilized in Luhtaa daycare, which is not a common practicein a Finnish daycare building. In Finland the municipal daycare buildings are generally closedduring mid-summer. Luhtaa daycare is unoccupied for 5 weeks in the summer, from late Juneto early August. The mid-summer closure affects the financial profitability of own PVgeneration, because the most profitable arrangement is to utilize as much as possible of the onsite generation.In the actual daycare building, the panels occupy 143 m2 of the south-west facing partof the roof. In the building simulation, a more advanced solar panel model is used, with9
This is a manuscript version of the article published in International Journal of Sustainable Energy in 2018.efficiency improved from 15.25% to 17.21%. The simulated panel area is allowed to vary from0 m2 to 600 m2, which is roughly realistic within the actual building geometry. The directionof the panels is south-west in the model, as well as in reality. Solar panel pricing is based onAhola (2015), Auvinen et al. (2016), Fraunhofer Institute for Solar Energy Systems ISE (2016)and Sankelo (2016), as well as direct price quotes from the industry.Solar thermal collection installationCurrently solar heat is not utilized in the Luhtaa daycare. In the building model, the area of thesolar thermal harvesting panels was allowed to vary between 6 m2 to 24 m2 in the districtheating case, and between 0 m2 and 24 m2 in the ground-source heat pump case. The areaconstraints were chosen with the help of preliminary simulations. Solar thermal collectorpricing is based on Niemelä (2015), Auvinen et al. (2016) and Nyman (2016), as well as directcommunication with solar thermal panel marketers. The efficiency of solar thermal collectorswas assigned as 0.92 based on solar radiation conversion factor ( 0) of a commercial product.Heat loss coefficients a1 and a2 were 3.35 W/m2K and 0.026 W/m2K2 respectively. Thelongitudinal and tangential incident angle modifiers were 0.93 (at 50 ) for modeling the biaxialbehavior of the collectors.Alongside solar thermal collection, adequate hot water storagemust also be in place. For every 6 m2 of solar thermal panels installed, 300 l of hot water storageis added. In the DH case no previous storage tank exists, and the maximum tank volumeinstalled is 1.2 m3, serving 24 m2 of solar thermal panels. In the GSHP case a 0.4 m3 tank isalready in place, and it can be enlargened up to 1.6 m3 as required. The cost of this is based onprice quotes from hot water storage tank providers.Sizing of the ground source heat pumpThe ground-source heat pump model used in the building simulation is described in detail byNyman (2016). Coefficient of performance (COP) of the studied GSHP is 4.5 at ratingconditions (0/35 C). In this study, the heat pump capacity is allowed to vary from 0 kW to 72kW. The maximum required heating power keeps the indoor temperature at the set point (21 C)during the heating season, even with the poorest insulation options. GSHP system has anelectric boiler as auxiliary heating solution, the cost of which is included in the life-cycle costcalculation. Pricing of the GSHP and the auxiliary heating system is based on Nyman (2016).Building envelope insulation levelsLuhtaa daycare building is in actuality very well insulated. One of the aims of this study is toestablish whether it is cost-efficient to aim at such high insulation levels, or to reduce thebuilding energy consumption with alternative technical and structural solutions. The insulationlevels chosen for the building simulations therefore represent a high grade insulation (externalwall U-value 0.08 W/m2K, external roof U-value 0.07 W/m2K, base floor U-value 0.10W/m2K) and standard insulation levels in accordance with the national building code (wall 0.17W/m2K, external roof 0.09 W/m2K, base floor 0.16 W/m2K). For the external walls, an10
This is a manuscript version of the article published in International Journal of Sustainable Energy in 2018.intermediary option is also provided (U-value 0.14 W/m2K). Pricing for the insulation optionsis based on report from the Ministry of the Environment (2012c) and Reinikainen (2015), aswell as direct contact with the industry. The poorest insulation option is treated as the basecase, and the costs of the insulation improvements are given relative to the zero-cost base case.Window type selectionIn the building simulation model, 6 different window types are allowed, with U-values rangingfrom 0.5 to 1.0 W/m2K. This represents the U-value of the whole window complex (glass frame). No active shading mechanisms, such as automatic or schedule-operated shutters, areconsidered; the building itself is designed to utilize passive solar shading. The window pricesand specifications (U-values, g-values) are acquired directly from a window company. Thedirect and visible solar transmittances of the selected windows are calculated by PilkingtonSpectrum window design tool and taken into account in the study. The window option with thepoorest U-value of 1.0 W/m2K is again considered as the zero-cost base case, and allimprovements carry a life-cycle cost compared with the base case.Effectiveness of heat recoveryTwo methods of improving the ventilation heat recovery are considered. Firstly, heat recoveryof the main air handling units can be carried out by a plate heat exchanger with 60% or by ahygroscopic rotary heat exchanger with 80% temperature efficiency. The minimum allowedexhaust temperatures of these heat exchangers are 1 and -15 C respectively. Heat recoverywith efficiency of 60% is considered a zero-cost option, and only the improved heat recoverycarries a life-cycle cost. Secondly, a HRU can be installed to the separate exhausts, serving thetoilet areas. In the existing daycare building, the toilet separate exhausts do not have any heatrecovery installed; this study helps to assess whether or not this was a wise choice. Pricing ofthe improved heat recovery is based on Reinikainen (2015).Ventilation control strategyIn a daycare building, the occupancy and usage of the zones varies through the day. Thechildren spend time both outside and inside, sometimes playing or resting in their separategroup homerooms, or assembled in the event hall for a common activity. It may be advisableto install CO2 level controller systems into the ventilation, varying the air flows so that the CO2levels are kept at a desired interval. When occupancy is low, air flows need not be as high asat times of high occupancy.Here a CO2 control is simulated with proportional controller driving the air flows,keeping CO2 levels within most occupied zones between 600 and 900 ppm. The ventilationcontrol strategy is applied in all spaces except toilets and the kitchen. Pricing of the CO2 controlstrategy is based on Reinikainen (2015) and direct contacts with the building consultantindustry.Light control strategy11
This is a manuscript version of the article published in International Journal of Sustain
the building envelope is not a cost-optimal method to reduce the daycare building energy use. Improving energy efficiency of the ventilation system, utilizing solar energy on-site and employing a light control strategy are preferable ways of improving the building energy performance. Ground-source heat pump is a more cost-optimal heating system