Transcription
Struct Multidisc OptimDOI 10.1007/s00158-013-1002-xRESEARCH PAPERStructural optimization using graphic staticsLauren L. Beghini · Juan Carrion ·Alessandro Beghini · Arkadiusz Mazurek ·William F. BakerReceived: 24 March 2013 / Revised: 13 September 2013 / Accepted: 13 September 2013 Springer-Verlag Berlin Heidelberg 2013Abstract This paper presents a method for structural optimization of discrete trusses using Graphic Statics. Asopposed to traditional structural optimization techniques,which are typically conducted by manipulating the geometry of the structure (the form diagram), the approachpresented in this paper establishes a Graphic Statics solutionto the problem, where structural optimization is conductedusing design variables in the force domain (force diagram).The proposed approach presents several attractive featurescompared to traditional approaches. Since it is based onreciprocal graphical relationships between form geometry and forces, member stiffnesses need not be calculated.Additionally, by working on the force diagram, equilibriumof the solution is guaranteed, and no additional methodsare required to enforce this condition; for example, thereis no need to triangulate the structure or to add small areamembers. Furthermore, because only solutions that are inequilibrium are permitted, the number of design variablescan be reduced. Also, subject to certain relationships, thelocation of the loads (or reactions) do not need to be seta priori. Through examples, it is shown that the proposedmethodology can readily accommodate different tensile andcompressive stresses for volume optimization problems andthat, through the use of Graphic Statics, other restrictions orconstraints on the member forces can easily be incorporated.J. Carrion · A. Beghini · A. Mazurek · W. F. Baker ( )Skidmore, Owings & Merrill, LLP, 224 S.Michigan Avenue, Chicago, IL 60604, USAe-mail: william.baker@som.comL. L. BeghiniDepartment of Civil and Environmental Engineering,University of Illinois at Urbana-Champaign,205 N. Matthews Ave., Urbana, IL 61801, USAKeywords Structural optimization · Truss optimization ·Reciprocal diagrams · Graphic statics1 IntroductionStructural topology optimization is a powerful and wellestablished technique to determine the optimal geometryto design efficient systems. Optimization has been successfully used in many fields of science, for example, see(Sigmund 2000; Krog et al. 2004; Sutradhar et al. 2010;Altair Engineering Web Page 2013). In structural engineering, as part of the natural design process, we continuouslyseek efficient structures and corresponding methodologiesto find such structures. These resulting structures mustachieve the intended purpose, while typically keeping thecost (and generally the use of natural resources) to aminimum.There are several methods that have been used for structural optimization, and their utilization depends on thespecific project or application considered. These methods include topology optimization, shape optimization, sizeoptimization, and form finding, amongst others. Solutionsto these methods can be determined in closed-form foronly a limited number of cases, e.g., the Michell trusses(Michell 1904). For structures with more complex loadingsand geometries, closed-form solutions are generally not possible; thus, numerical methods must be employed to find theoptimal topologies.1.1 Advantages and shortcomings in structural optimizationSeveral methodologies have been developed to find efficient structures by means of optimization algorithms. The
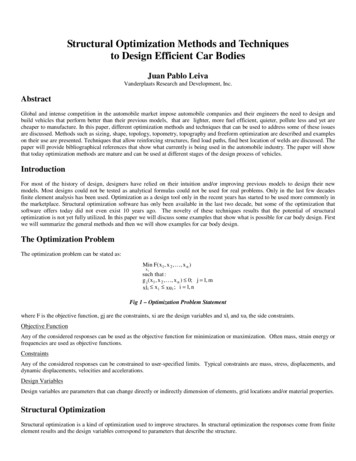
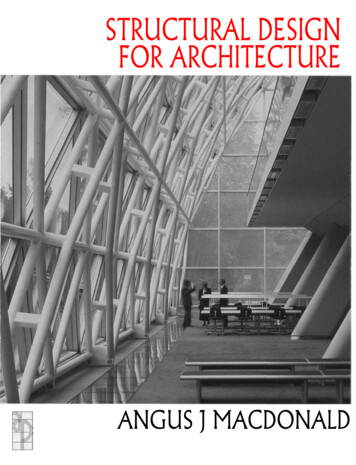
L. L. Beghini et al.following is a brief overview of some of these methods andtheir advantages and shortcomings.One of the most commonly used approaches is topologyoptimization by means of a material distribution problem,which is typically based on the Solid Isotropic Material withPenalization (SIMP) model (Rozvany et al. 1992; Zhou andRozvany 1993; Bendsoe and Sigmund 1999). Using thisapproach, resulting designs can have any size, shape andconnectivity. This solution provides valuable insight aboutthe geometry of the layout of the members of the optimalstructure. However, one of the issues associated with such asolution is its associated discretization. To physically realize the resulting design in projects of an architectural scale,the finite element densities must be discretized into line elements representing beams, columns and braces, as part ofthe design process. This often poses some challenges to thedesigner. Since the precise locations of the nodes can besubject to interpretation, the resulting discrete structure maybe difficult to interpret.Another popular alternative for structural topology optimization is the ground structures approach, which is conducted using discrete members. In these methods, the designproblem typically consists of assuming a base or groundstructure with a given layout of members, where the optimization can be conducted as a sizing problem with thecross-sectional areas as the design variables (Achtziger et al.1992; Ben-Tal and Bendsoe 1993; Oberndorfer et al. 1996;Bendsoe and Sigmund 2002; Sokol 2010; Christensen andKlarbring 2008). In these methods, the final designs arealready discretized but often with thousands of members.Limitations include the inability for the design domain,shape or connectivity of the members to change; however,members may be removed throughout the process as theyattain zero (or very small) areas. One of the major disadvantages associated with these approaches lies in the largenumber of design variables (cross-sectional areas) requiredto solve the problem at hand. Thus, in order to create apractical structure, the structural engineer must interpret astructural layout with a limited number of members.Other truss optimization techniques include optimizingthe structure by changing the position of the elements usingtheir nodal coordinates as design variables, where the element cross-sectional areas can also be included to add orremove material depending on the structural configuration(Hansen and Vanderplaats 1988; Mazurek et al. 2011).In the design of large structures, a limited number ofdiscrete members is typically used. Often these membersare primarily axial force members and have limited flexural stiffness. Unfortunately, many of the existing toolsfor developing optimal topologies either have a very largenumber of elements (ground structures) or have memberswith substantial widths (e.g., density methods). A structurewith a large number of members is generally impracticalbecause of the costs associated with fabrication and architectural constraints. The density methods often result insolutions with wide principal members that have flexural stiffness, which is generally not achievable in largescale structures (Stromberg et al. 2012). Figure 1 showsthe main structural system of the John Hancock Centerbuilding in Chicago, where it can be seen that these members are very narrow relative to the scale of the buildingand therefore have limited flexural stiffness. This figurealso illustrates that large scale braced structures generally have a limited number of axial members. That said,ground structure methods and density methods can provide valuable insight in creating a general arrangement ofelements for use in other optimization techniques such asthose suggested in this paper. As shall be explained below,Graphic Statics provides a useful optimization approach fora given connectivity of elements. The initial connectivitycan be determined first by analyzing the problem throughground structures or density methods and then by interpreting an appropriate element connectivity. Furthermore,in many practical designs, architectural and practical considerations may influence the number of members to beselected.Fig. 1 John Hancock Center in Chicago, IL (notice the small scale ofthe main structural members compared to overall size of the building)
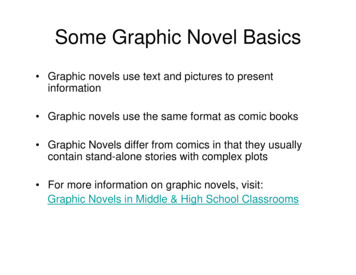
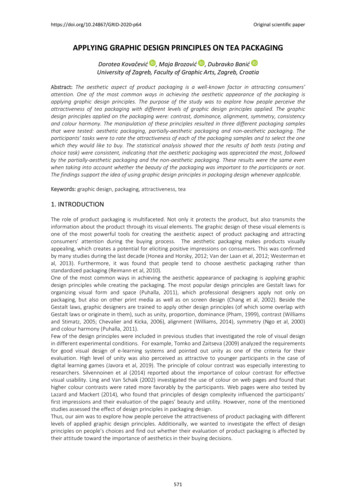
Structural optimization using graphic statics1.2 Motivation for graphic staticsMany optimal design problems, such as a “tied arch”, concern primarily axial member structures, where the naturalflexural stiffness of the arch and/or the deck provides stability to the final structure. When these types of structuresare designed, the arrangement of the axial members (trussmembers) are the primary concern and the structure maynot be fully triangulated, resulting in numerically “unstable”structures that must be triangulated during the optimizationprocess. Optimal structures typically have only the minimum number of elements required to support the appliedloads (i.e. they may not be stable as fully triangulatedtrusses), and they are not always stable under other loadcases. This characteristic often creates problems in stiffness and/or finite element methods used during the solutionof the optimization problem; these structures can become“unstable” resulting in a singular stiffness matrix that cannotbe analyzed (see Fig. 2a).One approach to circumvent this problem is to includeadditional members in the structure, which create a triangulated, and therefore stable, structure. Figure 2a showsa basic sixteen-panel structure, which produces a singularstiffness matrix. To alleviate stability issues, additionalmembers can be added to the structure, as shown inFig. 2b–d.One question arises immediately, does the layout of theseadditional members influence the final solution of the optimization process? In theory, these additional members atthe end of the solution should have zero area, as they areonly required for the method used to determine the solution;however, in finite element methods, members with zero areahave no stiffness, and therefore make the stiffness matrixsingular. To solve this problem, many solutions have beenproposed which require that a minimum element area isdefined, or the elements have to be removed from the solution once their area falls below a certain value. Both of thesemeasures have limitations: for the first one (minimum element area), the value selected has to be small enough notto influence the solution, and large enough not to causenumerical problems during the inversion of the stiffnessmatrix. The second approach, in addition to the problem ofdetermining which value is an adequate threshold for theproblem, is inconvenienced by the fact that a member that isactually part of the optimum solution can be eliminated during the optimization process (for example, based on a localoptimum).Another alternative would be to formulate the topology optimization problem using a stress-based formulation as opposed to a displacement-based one similarly towhat described by Achtziger (1997). Such formulationswould not require the calculation of the stiffness matrixand would circumvent the above mentioned numericalabcdFig. 2 Triangulated structure for conventional structural optimization(additional members shown with dashed lines): a Structure withoutadditional members, b Option 1 for additional members, c Option 2for additional members, and d Option 3 for additional membersproblems. However, a stress-based finite element formulation is not common in engineering practice and the forcediagram of Graphic Statics provides the designer withinsight into the force distribution in the structure.Therefore, the approach to structural optimization proposed in this paper consists of using Graphic Statics todefine the variables of the optimization process. The optimization problem is conducted in the force domain usingthe force diagram, as opposed to previous approaches whichconduct the optimization in the geometry domain using theform diagram. Thus, the optimization variables for the proposed methodology consist of the coordinates of the points(nodes) in the force diagram. As described later in moredetail, the use of Graphic Statics can provide the following
L. L. Beghini et al.advantages for certain types of problems, as compared to thetraditional approach:––––––There is no need to triangulate the domain with members of very small areas, which can create numericaldifficulties.The results are always feasible if the members formclosed polygons in the force domain (i.e. equilibrium isguaranteed).Using Graphic Statics, there is no need to computeor assemble stiffness matrices; only simple graphicalrelationships are needed.Subject to certain relationships, the final location of theloads (or supports) do not need to be specified a prioribut can change as the optimal solution is found.Graphic Statics can readily accommodate different tensile and compressive stresses.The equilibrium constraints in the force diagramreduces the number of design variables required.1.3 Paper scope and organizationThe remainder of this paper is organized as follows: in thenext section, we discuss the history and current state-of-theart techniques in Graphic Statics and structural optimizationof trusses. Then, in Section 3, we introduce the problemstatement and propose a new methodology for optimal trussdesign using Graphic Statics. Finally, we conclude withpractical numerical examples in Section 4 and comment onthe extensions of this work.The so-called ground structures method is commonlyused today, in which the layout of a truss can be foundby creating a set of connections between a fixed set ofnodal points as potential or vanishing structural members(Bendsoe and Sigmund 2002). Though these methods provide valuable insight to the optimal design problem, theyare often limited in the sense that the fixed nodal pointsand solutions are highly dependent on the choice of the initial ground structure. Furthermore, the optimization processtypically consists of a large number of members that cannotbe achieved in a practical structure. Moreover, these problems are typically formulated in terms of any cross-sectionalarea, which may not always be feasible to practicing structural engineers.Continuum methods have been proposed by Bendsoeand Kikuchi (1988), Bendsoe (1989), Zhou and Rozvany(1991), Rozvany et al. (1992), and Bendsoe and Sigmund(2002), in which each finite element can be compared toa “pixel” in a black-white raster of an image. These havebecome highly popular due to the fact that the physical size,shape and connectivity does not need to be specified a priori. However, one of the major disadvantages of continuumtopology optimization using numerical methods lies in theinterpretation of the final results. Often the final design contains thick regions of solid (“black”) material, and therefore,finding the optimal nodal locations is subjective when discretizing the final design into beams and columns. Thesethick regions of material present in such results also giveunrealistic flexural stiffness that may bias the solution.In this work, we use Graphic Statics to formulate analternative methodology to those listed above for practicingengineers, as described in the next section.2 Background2.2 Graphic staticsTopology design of truss structures in the form of grid-likecontinua has been studied extensively in the past, startingwith the ground-breaking paper by Michell (1904) (Bendsoeand Sigmund 2002; Rozvany et al. 1995). In this section,we give a brief overview of existing truss optimization techniques and highlight the advantages and limitations of incorporating Graphic Statics in the classical layout problem.2.1 Structural optimization of trussesThe first fundamental properties of optimal truss-like continua were established starting with Michell’s seminal paper“The Limits of Economy of Material in Frame-structures”(Michell 1904). This was later studied and expanded uponby Prager (1970), Hemp (1973), Rozvany (1976), Prager(1978), and Rozvany (1989), which has become the wellknown modern layout optimization theory. Other contributions to the field were the early numerical methodsdeveloped by Fleron (1964) and Dorn et al. (1964).Maxwell established that for certain trusses, the nodes andpolygons that represent the geometry of the truss have reciprocal polygons and nodes in the force domain (Maxwell1864, 1870). Every node in the geometry domain maps intoa polygon in the force domain, every polygon in the geometry domain maps into a node in the force domain and everyline representing the line of action of each truss membermaps into a reciprocal line in the force domain. The mapping used by Maxwell resulted in the reciprocal lines beingperpendicular to each other. The use of a different mapping (a hyperbola rather than a paraboloid of revolution) byCremona (1872) results in the reciprocal lines being parallel. Because these two figures (the form diagram and theforce diagram) are reciprocal, the mapping can also go fromthe force domain to the geometry (form) domain. The lengthof each of the lines in the force domain are proportionalto the axial force in the reciprocal line representing thetruss member. The creation of a force diagram from a form
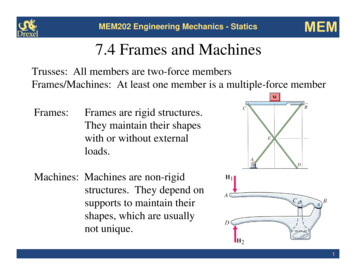
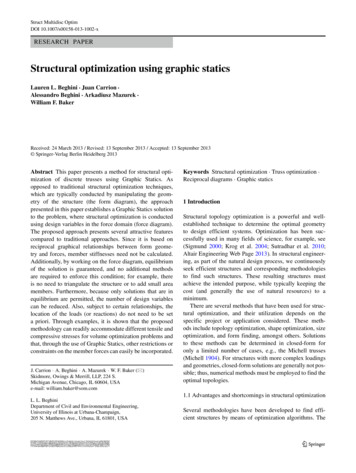
Structural optimization using graphic staticsdiagram (with its external applied forces) is called GraphicStatics. The process of Graphic Statics used to be a standardmethod of analyzing trusses and could be done using simple drafting tools. Graphic Statics is no longer in commonusage for analysis, having been replaced by more mathematical tools, but it still can be used as a design tool and, asdiscussed below, as a tool in creating optimal structures.As discussed in Baker et al. (2013), Graphic Statics provides the information needed for minimizing the load path(or volume) of a truss with specified connectivity. The formdiagram provides the length of each member and the lengthof each line in the force diagram provides the force in eachmember. The reader is referred to Baker et al. (2013) for abrief introduction to Graphic Statics and to textbooks suchas Zalewski and Allen (1998). Because of the reciprocalrelationships observed by Maxwell, only simple graphicaltechniques are needed to determine the length of each member and its axial force; there is no need to compute a stiffnessmatrix or to solve a large system of equations.Figure 3 is used to illustrate the basic principles associated with the solution of a problem using Graphic Staticsfor a six-panel structure. The notation shown here is theinterval notation adapted from Bow (1873), given also inthe textbook by Zalewski and Allen (1998). On the left, theconnectivity, initial geometry and boundary conditions areshown for a given structure, with its corresponding forcediagram on the right. It can be easily seen from these twodiagrams that all of the information is given to describe thetotal load path: the “path” or lengths of the members, Li , aregiven from the form diagram in Fig. 3(left) and the “load”or internal forces in the members, Pi , are shown in the forcediagram in Fig. 3(right). For a detailed description on howto construct the reciprocal diagrams, one can refer to thetextbooks by Wolfe (1921) and Zalewski and Allen (1998).The information about the internal forces can be interpreted from the form and force diagrams as follows: Thecapital letters, A,B,C., are sequentially placed clockwise inthe intervals between external forces (open polygons) in theform diagram and the numbers, 1,2,3,., are placed in theinternal spaces (closed polygons) between members. Eachline in the form diagram is bordered by two polygons. Thus,a member may be called using the corresponding letter ornumber of the adjacent polygons, e.g. B-3 or 6-7, and ajoint called with a series of letters and numbers, e.g. AB-3-2-1-A. Similarly, the external forces are called usingthe adjacent open polygons, for example FAB . The openpolygons denoted by capital letters in the form diagramcorrespond to points (nodes) on the load line of the forcediagram, denoted by the lowercase letters, a,b,c,. Thenumbers denoting the closed polygons in the form diagramalso have corresponding nodes in the force diagram.The axial force in a truss member can then be determined by measuring the length of the reciprocal line in theforce diagram. The relative scale of the force diagram isset by drawing the load line representing the external forcesto a scale. For example, the force in member A-1 in theform diagram of Fig. 3 is proportional to the length of theline between points a and 1 in the corresponding force diagram. Similarly, the force in the member between polygons2 and 3 is proportional to the length of the line betweenpoints 2 and 3 of the force diagram. The remaining forcesin the other members can be computed likewise. Thus, theforces acting on a node in the form diagram correspondto a polygon in the force diagram, where each force is aside of the polygon. For example, at node A-B-3-2-1-A, thepolygon of forces is given by points a-b-3-2-1-a. Readingclockwise around joint A-B-3-2-1-A in the form diagram,we can determine if members A-1 and 2-3 are in tensionor compression. If we read from 1 to a on polygon a-b3-2-1-a, we move from the left to the right, towards thejoint A-B-3-2-1-A of the form diagram. Thus, member A1 is in compression. Likewise, moving from 3 to 2 on theforce polygon goes from the upper left to the lower right,or away from the joint in the form diagram, so member3-2 is in tension. The remaining forces can be interpretedlikewise.Moreover, in Graphic Statics, the member lengths andforces can be determined solely using geometry. These diagrams can be constructed with simple drafting tools (straightedges, triangles, and a scale) or by the use of simple equations for lines and the intersection of lines required to solvea truss.Fig. 3 Reciprocal member(form) and force diagrams forsix-panel ,76cgdFFGe810f
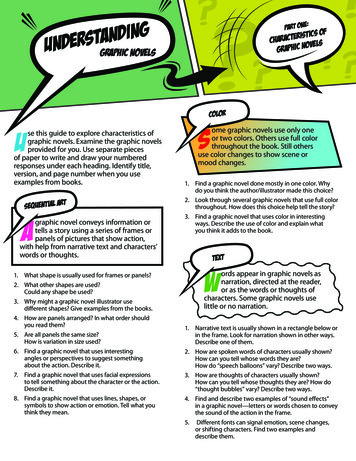
L. L. Beghini et al.2.3 Form-finding using graphic staticsPreviously, the reciprocal form and force diagrams inGraphic Statics have been used for structural design, asdescribed in Chapter 14 of the book by Zalewski and Allen(1998). The methodology for form-finding of trusses graphically solves for the nodal locations that give the desiredforce properties in a structure, such as a constant chordforce truss. For example, consider the simple six-panel trussshown in Fig. 3. If the desired force property is to havea constant force in the bottom chord, the geometry of thetruss is as shown in Fig. 4. This can be accomplished bymanipulating the force diagram so that the lengths of linesg-1, g-2, g-4, g-7, g-9 and g-10 of the force diagram arethe same (representing equal forces), while the points ofapplied loads in the top chord remain equally spaced horizontally. After the force diagram is modified to achieve thedesired properties, one can then work backwards to find thereciprocal form diagram, resulting in the desired geometry.Note that the forces in members 2-3, 4-5, 6-7 and 8-9 arezero because the nodes are overlaid in the force diagramon the right. These members can be eliminated from thestructure if the chords have sufficient strength and flexuralstiffness to satisfy the demand of non-uniform load casesand stability requirements. Several examples of structuresdesigned using Graphic Statics can be found in the literature(Zastavni 2008; Fivet and Zastavni 2012). More recently,the authors applied Graphic Statics and Rankine’s Theoremfor the design of a canopy of a high-rise building (Beghiniet al. 2013) and for the design of the long-span roof trussesof a convention center as indicated in Section 4.5.3 A method for truss optimization using graphic staticsAn alternative to the methods presented in Section 2.1 forminimizing the value of a structure is manipulation of theforce diagram of a Graphic Statics analysis until a minimum total load path is achieved. By manipulating the forcediagram rather than the form diagram (as other methodstypically do) one can always be assured that the resulting solution is in equilibrium, since the force polygons arealways closed. It can also be noted that, because the solutionis automatically constrained to be in equilibrium, there arealso fewer independent variables than if one tried to manipulate the form diagram. This methodology is described infurther detail in this section.3.1 Problem statement and methodologyThe well-known minimum compliance problem for trusstopology optimization for a given volume, V, can be writtenas follows:min FT uu,ts.t.m i 1m ti Ki u Fti Vi 1ti 0, i 1, ., m(1)where F is the global vector of applied forces, u is theglobal vector of nodal displacements, Ki is the element stiffness matrix and ti is the volume of the ith member andm is the total number of members. Classical truss topology optimization methods based on (1), therefore, requirethe assembly of a stiffness matrix associated with a chosenground structure as given below:K (t) m ti Ki(2)i 1One of the major disadvantages of this formulation isthat many optimal designs have a singular stiffness matrixwhen described as part of the full ground structure, so thesolution of the equilibrium equation, K(t)u F, typically becomes computationally difficult. By using GraphicStatics to perform the structural analysis, it is no longer necessary to compute (2) and the singularity issue can easily beFig. 4 Resulting geometry fromform-finding of a constant-forcetruss (Zalewski and Allen 9e10fFEFFDED1FFG
Structural optimization using graphic staticscircumvented. Alternatively, the topology optimizationproblem described by (1) can be formulated using one ofthe dual (stress-based) formulations proposed by Achtziger(1997), which would not require the computation of thestiffness matrix. However, the graphics statics approach ispreferred by the authors because it provides more insight inthe problem since the structural forces are visualized. Thisenables the engineer to easily select specific force-based orstiffness-based design criteria similarly to what described indetails in Beghini et al. (2013) for the design of a canopy.Similar to Hansen and Vanderplaats (1988) and Rahamiet al. (2008), the authors of this work aim to minimizethe total volume, or equivalently the total load path (Bakeret al. 2013), of the structure in terms of the locations of thenodes in the force diagram, x, which can be written as follows (assuming a constant state of stress at the optimumStromberg et al. 2012):min V minxx1 Pi · Liσ(3)where V represents the total volume of the structure, σ is thevalue of stress, Pi is the internal force and Li is the lengthof the ith member, respectively. Equation (3) illustrates oneof the advantages of using graphics statics in the optimization process. The geometry of the structure analyzed andthe areas of the cross sectional members are not independent variables. The length of the members is a function ofthe nodal coordinates in the form diagram and the areasare function of the loads in the members (described by theforce diagram) and the stress level. The reciprocal diagrams(form and force) are related in a way that any geometrychange in the form diagram affects the force diagram and,vice versa, any force change causes a geometry change.Therefore, the optimization can be conducted on either theform or the force diagram. This eliminates the numerical difficulties associated with the treatment of the nodalcoordinates geometry and member areas as independentvariables (Achtziger 1997).Based on (3), the sensitivities of the design variables (i.e.nodal locations) with respect to the objective function canbe approximated using the finite difference method below: VV (x ) V (x) xi xi(4)where x represents the vector of the nodal locations, andx is the vector of nodal locations where the ith variable ismodified as xi xi xi . We note that, in the proposedmethodology, the number of design variables is relativelysmall, making this option computationally feasible.In terms of the optimization algorithm used to update thedesign variables, a large number of algorithms are available, including the optimality criteria (Zhou and Rozvany1991), interior point algorithms, the method of movingasymptotes (Svanberg 1987), branch and bound methods,genetic algorithms, etc. Though any of these methods canbe selected, the user must be careful to avoid local minima in the final solutions. For the optimization algorithmof this work, we employ the Method of Moving Asymptotes (MMA), proposed by Svanberg (1987). The Method ofMoving Asymptotes is particularly suited for the proposedalgorithm provided in the next section due to its flexibility(in terms of type of design variables, constraints, etc.), stability and speed of convergence. Moreover, the method isfairly easy for the engineer to implement and use; educational codes are also available through the author (Svanberg2013).3.2 Graphic statics for truss analysisAn advantage of using Graphic Statics for optimization isthat the number of design variables is reduced; therefore, thecomputational size of the optimization problem is decreasedaccordingly. The complexity of optimization process growsexponentially with the number of variables, therefore, byreducing the number of design variables, the type and size ofproblems that can be solved using computational structuraloptimization can be expanded.In Graphic Statics, the member i with length Li has areciprocal line in the force diagram with length L̂i thatis proportional to the force Pi in the member. Thus, theobjective function can be rewritten as follows:min V minxx1 Li · L̂iσ(5)which is equal to the summation of the products of thelengths of the members in the form diagram and the lengthsof their reciprocal members in the force diagram. This valuecan easily be calculated based solely on the geometry of thetwo diagrams. Therefore, the optimization framework usingGraphic Statics can be summarized as follows:1. Given a specified general geometry and connectivityof a structure (form diagram), draw the corresponding reciprocal force diagram. Determine which nodedegrees of freedom in the force diagram are restrainedby reciprocal relatio
elements for use in other optimization techniques such as those suggested in this paper. As shall be explained below, Graphic Statics provides a useful optimization approach for a given connectivity of elements. The initial connectivity can be determined first by analyzing the problem throug