Transcription
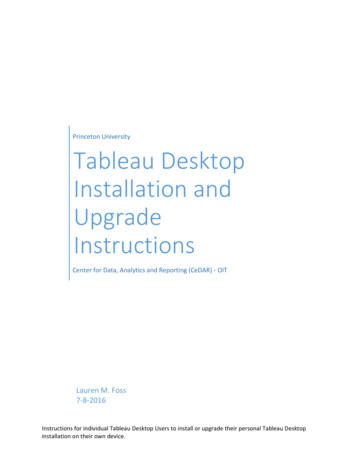
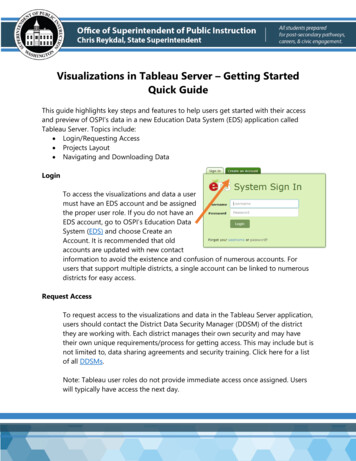
Visualizations in Tableau Server – Getting StartedQuick GuideThis guide highlights key steps and features to help users get started with their accessand preview of OSPI’s data in a new Education Data System (EDS) application calledTableau Server. Topics include: Login/Requesting Access Projects Layout Navigating and Downloading DataLoginTo access the visualizations and data a usermust have an EDS account and be assignedthe proper user role. If you do not have anEDS account, go to OSPI’s Education DataSystem (EDS) and choose Create anAccount. It is recommended that oldaccounts are updated with new contactinformation to avoid the existence and confusion of numerous accounts. Forusers that support multiple districts, a single account can be linked to numerousdistricts for easy access.Request AccessTo request access to the visualizations and data in the Tableau Server application,users should contact the District Data Security Manager (DDSM) of the districtthey are working with. Each district manages their own security and may havetheir own unique requirements/process for getting access. This may include but isnot limited to, data sharing agreements and security training. Click here for a listof all DDSMs.Note: Tableau user roles do not provide immediate access once assigned. Userswill typically have access the next day.
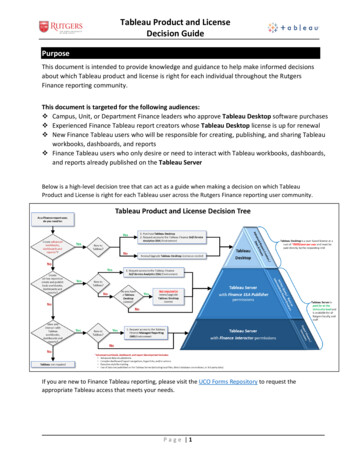
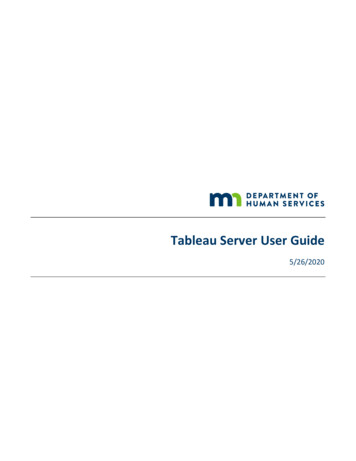
The Tableau Server application contains three security roles with varying levels ofaccess: Tableau SecureDataPortal-Educator Interactor – District or SchoolReports focused around the Educator Equity Data Collection Tool andother Teacher/Staff systems. Tableau Tableau SecureDataPortal-Finance Interactor – District, orSchool Reports focused around school financial information, including butnot limited to School Apportionment & Financial Systems (SAFS). Tableau SecureDataPortal-Student Interactor – District or SchoolReports focused around Comprehensive Education Data and ResearchSystem (CEDARS) and its related sub-systems.Users needing access to the LAP Data Dashboard should request TableauSecureDataPortal – Student Interactor.Navigating to Tableau ServerUpon signing into EDS, users can navigate to theTableau Server by going to “My Applications”. UnderMy Applications, select “Tableau Server”.
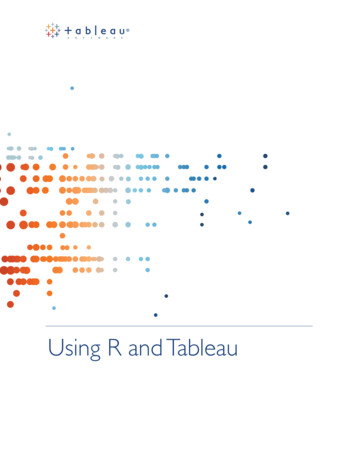
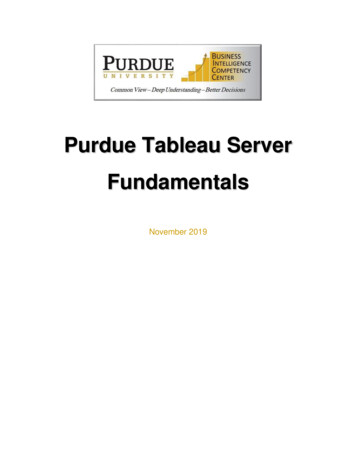
My Account SettingsAccount Settings should notbe managed or changed. This section ishighlighted because it is critical that users do notchange their Tableau passwords for any reason.Each user can manage their EDS password toprotect their access to Tableau Server for previewing.Search ToolThe Search tool is able to findcontent based on text found in theproject name, title, view owner, orother metadata. In the examplebelow, by typing “enroll” the Searchtool was able to recommend variousenrollment reports.Navigation MenuThe Navigation Menu will change based on the user’s location and access. Fromthe Starting Page there are four sections: Projects – Parent folder that contains different bodies of work. Currentlythese are split into three data sets that align with EDS Security Roles:o Educator – Reports focused around the Educator Equity DataCollection Tool and other Teacher/Staff systems.o Finance – Reports focused around school financial information,including but not limited to SAFS.o Student – Reports focused around CEDARS and its related subsystems. Workbooks – Exist within a Project, containing their own Views and DataSources. Views – Reports or data displays.
Data Sources – Records that indicate where the data populating thevarious Views came from and when they were last updated.As the user navigates to a specific View or report, the Navigation Menu changesto display all the views within the Workbook of the selected View. This providesquick access to similar or related data displays.ToolbarThe toolbar appears once the user navigates to a specific View or report. Theseoptions aid the user in sharing and communicating their findings. This sectionhighlights the Share and Download features.DownloadUsers can download their favorite data displaysin the format that best meets their needs. Theavailability of these file formats depend on thedata display. Please see the file formatdefinitions and examples below: Image – This option produces a(.png) photo file. Recommended foradding data displays to documentsor presentations.
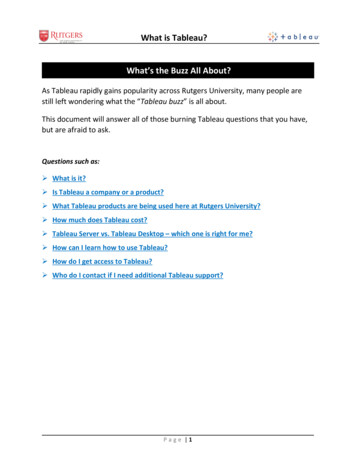
Data – This option produces a Tableau pop-up windowcontaining the raw data. Notice that some of the columns aresuppressed and can be added to this display. Additionally, thisdata can be downloaded to (.csv) text file. These files can belarge and may take some time to download. Crosstab – This option produces a (.csv) text file that can beopened with and saved as an Excel Workbook. Depending onthe Excel version, this file will automatically open through Excel.Recommended: when savingthis file, change the Save Asto an Excel Workbook. PDF – This option produces a (.pdf)file. There are some options for theuser to customize the downloadlayout such as, Scaling, Paper Size,and Orientation. This format isrecommended for printing copies ofthe data display.
Visualizations in Tableau Server – Getting Started Quick Guide This guide highlights key steps and features to help users get started with their access . PDF – This option produces a (.pdf) file. Ther