Transcription
EE412 Spring 2015MOCVD Growth Calibration for GaN LED on SiliconYusi Chen and Jieyang JiaSNF Mentor: Dr. Xiaoqing XuFaculty advisor: Prof. James S. HarrisJune 5th, 2015AbstractGroup-III-nitride materials have received significant research interest in the past decades due tothe application of high-brightness UV/blue/white light LED. Our work is to calibrate the MOCVDgrowth of high quality group-III-nitride (III-N) materials on Si substrate for LED applications. Wefocuses our efforts on investigating the growth and annealing conditions to control the dopingdensity in GaN and AlGaN and the composition in InGaN. We successfully demonstrated n- andp-type GaN grown in the MOCVD system in SNF and high-quality InGaN with indium percentageas high as 45%. Our work provides valuable information to future SNF users who will grow III-Nmaterials for any optoelectronic application.I.MotivationIII-N materials grown by metal-organic-chemical-vapor-deposition (MOCVD) have attractedgreat research attention recently, especially with the three scientists winning Nobel Prize inPhysics in 2014 “for the invention of efficient blue light-emitting diodes, which has enabled brightand energy-saving white light sources” [1]. The III-N based light-emitting-diode (LED)technology has disrupted the lighting industry that had been stable over 100 years. Right now 53.8%of the street lighting is provided by LEDs, and the number is projected to be increased to 93.8%by 2023 [2].1
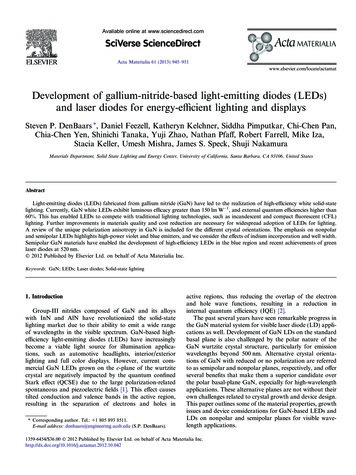
EE412 Spring 2015(a)(b)(c)(d)Figure 1. Applications of III-N MOCVD growth. (a) Blue LED [2]. (b) Nobel Prize in Physics, 2014[1]. (c) High-Electron-Mobility-Transistor (HEMT) [3]. (d) High-efficiency multi-junction solar cells[4].However, due to the lack of suitable homo-substrates, commercially LEDs available are mostlygrown on costly sapphire or SiC substrates. On the other hand, Si substrates are widely used insemiconductor industry, and the usage of Si substrates offers many advantages, including low costand high fabrication flexibility. Nevertheless, in order to grow III-N on Si, a variety of problemsneed to be solved and many researchers have put considerable effort into this field /chemical-vapor-deposition/mocvd/aix-ccs) and it offersa variety of new opportunities for researchers and industry members of SNF who might beinterested in III-N technology. However, since the system is new, not a lot of recipes are availableand many growth conditions need to be calibrated.In this EE412 project, we have successfully calibrated the growth recipes for AlGaN, GaN, andInGaN on Si (111) substrate. We have also used Hall measurement, I-V measurement, scanningelectron microscopy (SEM) and X-ray diffraction (XRD) to characterize the material. After morethan 16 rounds and more than 120 hours of successful MOCVD growth, we are glad to announcehere that the Axitron-CCS III-N MOCVD tool has been successfully brought up for the epi growth2
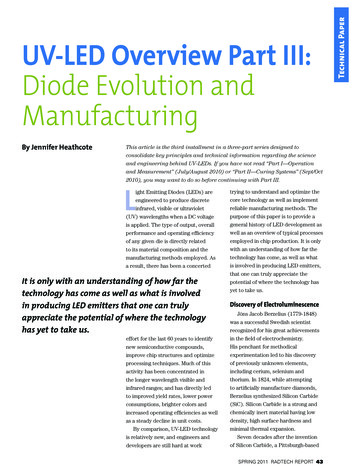
EE412 Spring 2015of material for most optoelectronic applications, as well as other applications such as HEMT andmulti-junction solar cells.II.Methodology and tasksa. Introduction to MOCVD growthMOCVD is the technology behind the multi-billion LED industry, which accommodates for bothhigh crystal quality and high growth rate.The principle of MOCVD growth can be seen from the figure 2(a). MOCVD utilizes metalorganics and hydrides as precursors, and the precursors will react on top of the substrate. Thenradicals are absorbed to the substrate surface where the interface reaction. With the deposition ofthin-film material, the byproducts are then taken away by the carrier gas flow.(a)(b)Figure 2. (a) Principle of MOCVD. (b) Axitron-CCS system in SNF.3
EE412 Spring 2015The Aixtron-CCS, as in figure 2(b), is a dedicated high quality III-N system in SNF. It can holdup to one 4-inch wafer, and also has the flexibility of processing coupon-size samples. It has TMIn,TMGa, TMAl and TEGa as growth precursors, Cp2Mg as p-type dopant and SiH4 as n-type dopant.Using those precursors, starting from (111) 4-inch Si substrate, we are able to grow anAlGaN/GaN/InGaN LED, as shown in figure 3. First, a thin layer of AlN needs to be deposited ondiffusion-level cleaned Si substrate. Then multi-layer of AlxGa1-xN layers need to be grown asbuffer layers to adjust the lattice constant. The composition of AlGaN and thickness of each layerneed to be calibrated carefully, in order to achieve high material quality and low strain. Finally, ap-i-n heterojunction is deposited as the LED device. Therefore, in order to achieve the high qualityLED device on (111) Si substrate, we need to:(1) Develop the buffer growth recipe.(2) Develop doping recipes for n-type and p-type materials.(3) Develop the AlGaN recipe.(4) Develop the InGaN recipe.The buffer layer recipes have been developed by Dr. Xiaoqing Xu. Therefore, in this EE412 project,we mainly focused on (2)-(4).Figure 3. Proposed LED growthb. Doping calibrationi. MOCVD structureIn order to calibrate the doping of GaN and calibrate the composition AlGaN, the followingMOCVD recipe was adopted and developed, as in figure 4. On top of the GaN buffer layer, a4
EE412 Spring 2015thin layer of AlGaN is deposited to calibrate the composition and also to insulate the test layerfrom the buffer layers. Then a layer of doped of GaN is grown to calibrate the doping level.Figure 4. Growth structure for doping calibrationHowever, the major drawback of this growth structure is that it requires long time (8 hours ofgrowth 3 hours of baking) to finish the deposition, as there are multi-layer buffer to grow beforethe actual calibration growth. Therefore, a modified growth strategy is adopted, as in figure 5. First,the buffer layers are grown on a 4-inch Si (111) substrate, which takes around 8 hours. Then thewafer is cut into 6 1/6 4-inch pieces. One important point is that the cut of wafers should beconducted inside the glove box and should use clean tweezers, so as to minimize the potentialpollution. Then the top two layers are grown on the 1/6 4-inch piece, which takes around 6.5 hours.In this way, the average growth is reduced to around 7.8 hours per sample.Figure 5. Modified growth strategy.5
EE412 Spring 2015ii. Hall measurementHall measurement is one of most important characterization methods to measure the dopingdensity and mobility. In this experiment, we use the H-50 setup in room 152, Paul Allen building,as in figure 6.Figure 6. Hall measurement setupThe principle of Hall measurement can be found in [10]. As shown in figure 7(a), voltage is appliedat the x direction of a piece of semiconductor, resulting in a current of I. When the magnetic fieldis applied at the z direction, due to Lorentz force, the motion of charged carriers will be bendedtowards different directions at y axis during transportation. Therefore, different types of chargewill be accumulated at different sides of the semiconductor, resulting in a built-in electrical fieldat the y direction. The voltage related to this electrical field is measured as VH.(a)6
EE412 Spring 2015(b)Figure 7. (a) Illustration of Hall measurement [10]. (b) Van Der Pauw method [10].From hall measurement, we would know Hall coefficient RH as𝑅𝑅𝐻𝐻 1𝑞𝑞𝑞𝑞 𝑉𝑉𝐻𝐻 𝑡𝑡𝐼𝐼𝑥𝑥 𝐵𝐵𝑧𝑧(II.1)And the doping density p is q*RH.For mobility:µ𝑝𝑝 σ𝑅𝑅𝐻𝐻 1 𝑉𝑉𝐻𝐻 𝑡𝑡𝜌𝜌 𝐼𝐼𝑥𝑥 𝐵𝐵𝑧𝑧(II.2)The resistivity of this semiconductor can be measured using Van Der Pauw method, as in figure7(b) [10]. The resistivity is calculated using equation (II.3)(II.3)iii. N-GaNFor N-type GaN, we use SiH4 as dopant, which has been widely used in the MOCVD industry[11-12]. The major parameter to calibrate is the SiH4-to-Ga molar ratio (NSi:NGa). Therefore, wevary the SiH4 flow rate so as to achieve different NSi:NGa, and then we use Hall measurement tomeasure the mobility, resistivity and doping density. The typical trend of dopant concentrationversus SiH4 flow rate from a previous research work can be seen in figure 8 [11].7
EE412 Spring 2015Figure 8. Doping concentration v.s. SiH4 flow rate.iv. P-GaNP-GaN was once considered impossible to get, until three Japanese scientists successfully realizedit in the 1980s, who also won the Nobel Prize due to this contribution. Akasaki and Amano usedthe Low-Energy-Electron-Beam-Irradiation (LEEBI) method to activate the p -dopant, whileNakamura utilized high temperature thermal annealing [1]. In this project, we adopt theNakamura’s method, using Mg as the dopant, which is also the mainstream technology in industry[13-17].Figure 9. (a) Growth window of NMg:NGa. (b) Growth window of growth temperature. (c) Optimizedpost-growth anneal condition.8
EE412 Spring 2015The major challenges of p-GaN growth lie in the three aspects: (1) finding the optimal NMg:NGaratio, (2) finding the best growth temperature and (3) finding the optimal post-growth annealingcondition [13-17]. The difficulty mainly comes from the extremely narrow growth window, ascan be seen from figure 9 [13]. For example, the optimal growth temperature window is only 25C, which is very hard to control.c. Ohmic contact for n-GaN and p-GaNi. N-GaN ohmic contactOhmic contact is also very important for high quality III-N devices. For n-GaN ohmic contact,Hou et. al. has successfully developed a recipe at SNF, using Ti/Al/Pt/Au metal stack depositedusing Innotec [18]. We also adopted this type of contact in our project.ii. P-GaN ohmic contactUnlike n-GaN contact, ohmic contact for p-GaN has never been developed at SNF. Previous workshows that using Ni/Au double layer with 500C 10-20min annealing in N2/O2 ambient shouldgenerate ohmic contact for p-GaN [19-21]. In this process Ni is oxidized to NiOx, which de-pinsthe Fermi level at the p-GaN/metal interface. Also, Oxygen would further activate the Mg dopantin GaN, thus further increase the quality of the contact [19-21]. The result of annealing from aprevious research work can be seen in figure 10. After annealing, the I-V curve is almost linear,which exhibits good ohmic performance.Figure 10. I-V curves of p-GaN contact before and after contact annealing [20].9
EE412 Spring 2015In this project, we also developed the first ohmic contact recipe for p-GaN at SNF.d. InGaN and AlGaN growth calibrationi. InGaNHigh-quality InGaN MOCVD layer is essential for high-performance blue LED, as it forms thelight-emitting quantum wells due to the lower bandgap of InGaN in the visible light region [2224]. In this project, we mainly focus on the investigation of the relation between indiumcomposition and the growth temperature. From [22], the In composition should decrease with theincrease of growth temperature, as shown in figure 11. We used XRD to verify the indiumcomposition and crystal quality.Figure 11. Relation between NIn:NGa, growth temperature and In composition [22].ii. AlGaNDr. Xiaoqing Xu has already successfully developed recipe for AlGaN growth. In this project, weverified the growth thickness of Al0.2Ga0.8N, which may act as the barrier layer for future heterojunction III-N LED device.e. Summary of project tasksi. N-GaN10
EE412 Spring 2015 Investigate relation between doping density and SiH4 flow rate, or Si-to-Ga ratio.ii. P-GaNInvestigate relation between doping density and Mg flow rate, or Mg-to-Ga ratio. Growth temperature. Annealing temperature.iii. InGaN Investigate relation between indium composition and growth temperature Verify crystal qualityiv. AlGaN Verify growth thickness for Al0.2Ga0.8N.III.Experiment Resultsv. n-GaNAs elaborated in the previous section, we focused on experimentally extracting the relationbetween the molar ratio (NSi:NGa) and the electron density in n-GaN.We first grew the test structure as shown in the previous section with different SiH4 flow rates. Allother growth parameters, including the growth temperature, pressure and TMGa flow rate are keptconstant. Next, we cut the grown samples into pieces with proper size and use electron-beamevaporation to coat a Ti (20 nm) /Al (100nm)/Pt(80 nm) contact, followed by a 35 sec rapid thermalannealing (RTA) in N2 at 850C. The samples are then characterized using scanning electronmicroscope (SEM), I-V probe station and the H-50 Hall measurement setup.Figure 12(a) shows a typical SEM image of the cross-section view of a grown sample. It is shownthat the interfaces of the epi-layers are smooth, and the target thickness of n-GaN has been reached.370 nm is the typical thickness of the n-GaN samples.11
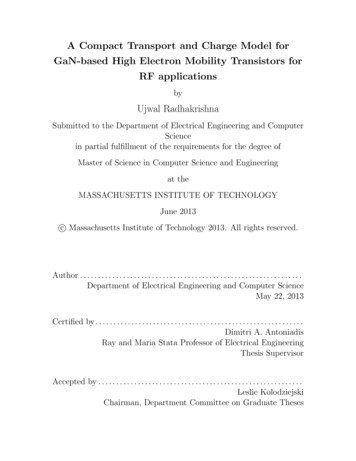
EE412 Spring 2015(a)(b)Figure 12. SEM cross-section image of a MOCVD grown (a) n-GaN (b) p-GaN sample.To ensure good contact quality, we measured the I-V characteristics of the n-GaN film. Each ofthe two diagonal contact pairs was probed. Figure 13 shows the I-V curves of a typical samplebefore and after RTA. It is shown that the thin film has good conductivity and contacts are perfectlyohmic. It is also shown that the RTA process does not significantly affect the contact quality.0.02I (A)0.010-10-50510-0.01-0.02Pair 1, w/o RTAPair 2, w/o RTAV (V)Pair 1, w/ RTAPair 2, w/ RTAFigure 13. I-V curves of an n-GaN sample measured with probes on each of the diagonal contactpairs. Solid lines are result before RTA and dash lines after RTA.We conducted multiple rounds of growth, in which three rounds led to significant experimentresults. Table 1 shows the growth parameters and the Hall measurement result. Figure 14 shows12
EE412 Spring 2015the plots of the mobility, resistivity and carrier density versus NSi:NGa. The listed growthtemperature in table 1 is the temperature set in the recipe, not the actual temperature on the growthsurface during the process, which is approximately 90C-150C lower than the set growthtemperature. Detailed information regarding the relation between set growth temperature andactual growth temperature can be found in [9].Table 1. Growth parameters and Hallmeasurement results for n-GaNFigure 14. Plots of mobility, resistivityand carrier density versus NSi:NGa.We can see that an electron density of 2 1018 𝑐𝑐𝑚𝑚 3has been achieved, which is sufficientfor most optoelectronic applications. The mobility and resistivity values also indicate goodmaterial quality. It also suggests that the carrier density can be well controlled in the 4 1016 2 1018 𝑐𝑐𝑚𝑚 3 range. The trend can be further investigated with additional growthssetting NSi:NGa to be in the range of 2 10 6 2 10 5 .13
EE412 Spring 2015vi. antatomandBis(cyclopentadienyl)magnesium (Cp2Mg) as the doping material. We followed the sameexperiment procedure as described above for the n-GaN except for a few changes: after theMOCVD growth, the samples stayed in the growth chamber for a 20 30 min post-growthannealing to activate the dopant. The metal recipe used to make the contact is Ni (20 nm)/Au(20nm), with a 10 min, 500C RTA in a O2(20%) /N2(80%) atmosphere. We also tried 10-30min bakingat 500C-550C in air using a hot-plate. However, the performance of contact was degraded aftersuch baking, which may be due to the water vapor in the atmosphere.As described in the previous section, p-GaN doping condition is very complicated. There are threemain control variables: the molar ratio NMg:NGa, the growth temperature and the annealingtemperature. Other condition parameters, such as the annealing time, may also have some effectson the result, but are assumed only secondary in our experiments.Figure 15 shows the experiment parameter matrix and the search path for the ideal growth window.As shown in the previous work, p-GaN has a very narrow growth window. Due to the limit of timeand material we were not able to exhaust the matrix, instead we relied on the trend observed in theprevious experiments to determine the condition for the next experiment.Figure 15. Parameter matrix for the p-GaN doping calibration and the growth window search path(orange arrows). Green blocks indicate experiments that had been conducted and the red blockindicates the search destination with the optimal growth condition.14
EE412 Spring 2015Figure 12(b) shows the SEM image of a typical p-GaN sample, which shows the same quality asthe n-GaN. Figure 16 shows the I-V curves of p-GaN samples with/without RTA and with differentcarrier density. The thin film appears to have lower conductivity than n-GaN and the contact is notalways ohmic. It shows that the contact will be ohmic only if the carrier density is sufficiently high,which makes the calibration of low doping very challenging. In addition, as it is observed, RTAappears to improve the contact quality, though further experiment needs to be conducted to findthe optimal RTA recipe.(a)(b)(c)Figure 16. I-V curves of p-GaN sample measured with probes on each of the diagonal contact pairs(denoted by different colors). The samples have different doping and contact annealing conditions: (a)contact not annealed (b) 500C RTA, doping high enough for an ohmic contact (c) 500C RTA, doping nothigh enough for an ohmic contact.Table 2 shows the growth parameters and the Hall measurement result. As the contact for lowdoping samples did not have good quality, some of the data in the table were reasonable estimationbased on limited measurement accuracy. Figure 17 shows the observed trends of the variation ofmobility, resistivity and carrier density to the molar ratio, growth temperature and annealingtemperature. More experiments need to be conducted in order to make the results more accurate.Ga Flow (sccm)13.513.56.7513.513.5513.5Mg Flow E-38.8E-34.4E-31.2E-22.2E-3Growth Temp. (C)1295129512951230123012001200Growth Time (sec)204020404080204020402040204015
EE412 Spring 2015Growth Pressure(mbar)200200200200200400200Annealing Temp (C)7501000750990820990990Annealing Time (sec)Annealing 971.3E 021.5E 031.7E 034.0E 012.3E 021.0E 001.1E 01Thickness (nm)2Mobility (cm /Vs)Resistivity (ohm * cm)-39.4E 14 1.0E 16 4.8E 14 7.8E 15 6.0E 15 1.3E 18 5.3E 19Hole Density (cm )Table 2. Growth parameters and Hall measurement results for p-GaN. Red font indicates data ofreasonable estimation based on limited measurement accuracyFigure 17. Plots of mobility, resistivity and carrier density versus NMg:NGa, growth temperature andannealing temperature. The controlled variables are listed in the x-axis labels.In spite of the great challenges in conducting the calibration, we successfully found a growthwindow which allows us to growth p-GaN with a hole density 1 1018 𝑐𝑐𝑚𝑚 3 , which issufficient for most optoelectronic applications. More investigation on the growth window needs tobe done in order to accurately control the doping of p-GaN.vii. InGaN16
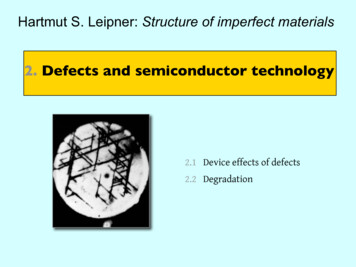
EE412 Spring 2015We conducted two rounds of InGaN growth to verify the crystal quality and indium/galliumcomposition. We grew the samples using the parameters specified in Table 3 and then used SEMand X-ray diffraction (XRD) to characterize the samples. No metal contact is needed. Theindium/gallium composition depends on mainly the growth temperature, so we varied the growthtemperature and investigated the relation between the growth temperature and the indiumpercentage in the alloy.Ga Flow (sccm)4141In Flow 00400NH3 Flow(sccm)Growth Temp(C)Growth Time(sec)GrowthPressure (mbar)Thickness (nm)250170Table 3. Growth parameters for InGaN.Figure 18 shows the SEM images of the two InGaN samples with different growth temperature.Figure 19 shows the XRD spectra of the two InGaN samples. From the XRD results we extractedthe InGaN(0002) peak position at 32.84 degree for the 850C sample and 32.54 degree for the 790Csample, which indicates a indium percentage of 36% for the former and 45% for the latter. Onthe XRD spectrum it can also be seen that the main peak in both (0002) and (0004) directions wereintact, indicating no phase separation. Therefore, we successfully achieved high-quality growth ofInGaN with indium composition as high as 45%, which is remarkable comparing to the resultsfrom previous research work [22-24]. Nevertheless, further calibration is needed for accuratecontrol of InGaN growth.17
EE412 Spring 2015(a)(b)Figure 18. SEM cross-section image of MOCVD grown InGaN under growth temperatures of (a)850C (b) 790C.(a)(b)Figure 18. XRD spectrum of MOCVD grown InGaN under growth temperatures of (a) 850C (b)790C. InGaN peak location are marked.viii. AlGaN18
EE412 Spring 2015Although AlGaN growth calibration is not the focus of this work, we also verified the thickness ofAlGaN growth using certain recipe, as specified in Table 4. The growth condition corresponds toa composition of approximately 20% Al and 80% Ga, from previous calibration result.Al Flow(sccm)Ga Flow(sccm)5.57.6NAl:NGaNH3 Flow(sccm)GrowthTemp (C)GrowthTime (sec)0.10436.70E 021295180Table 4. Growth parameters for AlGaN.GrowthPressure(mbar)100Thickness(nm)23Figure 19 show SEM image of the cross-section view of the AlGaN layer, which is measured tohave a thickness of 23 nm, indicating a growth rate of 1.2 Å/s.Figure 19. SEM cross-section image of a MOCVD grown AlGaN sample, sandwiched between two GaNlayers.ix. Other ContributionFrom this work we also gained a few insight on the growth using the Aix-ccs MOCVD tool andsubsequent processes:a) The tool always needs an 1100C baking step after each growth to maintain good chambercondition. For a growth time of 40 min, 90 min of baking has shown to be sufficient. However,60 min of baking has shown to be slightly insufficient, mild residence was still observed.19
EE412 Spring 2015b) Indium can also be used to make ohmic contact for n-GaN, but was observed to have inferiorquality than Ti/Al/Pt.c) For p-GaN contact, RTA annealing has shown to be effective in improving the contact quality.The RTA recipe has been specified in the previous section. The optimal RTA recipe may needfurther calibration.IV.Summary and future workIn summary, we have successfully calibrated multiple important recipes on the new III-N AxitronCCS MOCVD system for SNF. For the first time, we have achieved n-GaN and p-GaN withcontrollable doping level. In addition, we have also successfully grown AlGaN and InGaN on (111)Si substrate with good crystal quality.We also would like to propose some future work for people who are interested in taking EE412with this III-N MOCVD tool. Those work may include: Calibrate lower doping of p-GaN. More InGaN and AlGaN calibration. LED growth and fabrication.V. AcknowledgementThanks to Xiaoqing for the mentorship, training on the MOCVD system and other help on theproject. Thanks to Prof. Howe, Dr. Mary Tang and other EE412 mentors for their valuable advice. Thanks to Prof. Harris for providing funding for SEM and other characterization tools.20
EE412 Spring 2015References[1] http://www.nobelprize.org/nobel prizes/physics/laureates/2014/[2] eet-lighting-sales-worldwide-by-2023[3] 19/1.html[4] EE216 Lecture notes[5] Dadgar, A., et al. "Thick, crack-free blue light-emitting diodes on Si (111) using lowtemperature AlN interlayers and in situSixNy masking." Applied physics letters 80.20 (2002): 3670[6] Lahreche, H., et al. "Optimisation of AlN and GaN growth by metalorganic vapour-phaseepitaxy (MOVPE) on Si (111)." Journal of crystal growth 217.1 (2000): 13-25.[7] Ishikawa, Hiroyasu, et al. "GaN on Si substrate with AlGaN/AlN intermediate layer." Japanesejournal of applied physics 38.5A (1999): L492.[8] Krost, Alois, and Armin Dadgar. "GaN-based optoelectronics on silicon substrates." MaterialsScience and Engineering: B 93.1 (2002): 77-84.[9] por-deposition/mocvd/aix-ccs[10] Schroder, Dieter K. Semiconductor material and device characterization. John Wiley & Sons,2006.[11] Koide, N., et al. "Doping of GaN with Si and properties of blue m/i/n/n GaN LED with Sidoped n -layer by MOVPE." Journal of crystal growth 115.1 (1991): 639-642.[12] Rowland, L. B., K. Doverspike, and D. K. Gaskill. "Silicon doping of GaN usingdisilane." Applied physics letters 66.12 (1995): 1495-1497.[13] Tokunaga, H., et al. "Growth condition dependence of Mg-doped GaN film grown byhorizontal atmospheric MOCVD system with three layered laminar flow gas injection." Journalof crystal growth 189 (1998): 519-522.[14] Kozodoy, Peter, et al. "Heavy doping effects in Mg-doped GaN." Journal of AppliedPhysics 87.4 (2000): 1832-1835.[15] Götz, W., et al. "Activation of acceptors in Mg‐doped GaN grown by metalorganic chemicalvapor deposition." Applied Physics Letters 68.5 (1996): 667-669.[16] Sheu, Jinn-Kong, and G. C. Chi. "The doping process and dopant characteristics ofGaN." Journal of Physics: Condensed Matter 14.22 (2002): R657.[17] Huang, Jen-Wu, et al. "Electrical characterization of Mg‐doped GaN grown by metalorganicvapor phase epitaxy." Applied physics letters 68.17 (1996): 2392-2394.21
EE412 Spring 2015[18] Hou, Minmin, and Debbie G. Senesky. "Operation of ohmic Ti/Al/Pt/Au multilayer contactsto GaN at 600 C in air." Applied Physics Letters 105.8 (2014): 081905.[19] Qiao, D., et al. "A study of the Au/Ni ohmic contact on p-GaN." Journal of AppliedPhysics 88.7 (2000): 4196-4200.[20] Sheu, J. K., et al. "High-transparency Ni/Au ohmic contact to p-type GaN."Applied physicsletters 74.16 (1999): 2340-2342.[21] Ho, Jin-Kuo, et al. "Low-resistance ohmic contacts to p-type GaN." Applied physicsletters 74.9 (1999): 1275-1277.[22] Matsuoka, T., et al. "Wide-gap semiconductor InGaN and InGaAlN grown byMOVPE." Journal of electronic materials 21.2 (1992): 157-163.[23] Egawa, T., B. Zhang, and H. Ishikawa. "High performance of InGaN LEDs on (111) siliconsubstrates grown by MOCVD." Electron Device Letters, IEEE 26.3 (2005): 169-171.[24] Sheu, Jinn-Kung, et al. "Low-operation voltage of InGaN-GaN light-emitting diodes with Sidoped In/sub 0.3/Ga/sub 0.7/N/GaN short-period superlattice tunneling contact layer." ElectronDevice Letters, IEEE 22.10 (2001): 460-462.22
In this project, we also developed the first ohmic contact recipe for p-GaN at SNF. d. InGaN and AlGaN growth calibration i. InGaN High-quality InGaN MOCVD layer is essential for high-performance blue LED, as it forms the light-emitting quantum wells due to the l