Transcription
Planning Session AgendaJanuary 6, 20229:00 AMNorthern Water and Municipal Subdistrict Planning Session InformationNorthern Water offices are now fully open for business, including Board of Directorsmeetings. Please visit https://www.northernwater.org/covid for updated COVID restrictions.We will continue to live stream our Board meetings via Zoom for the foreseeable future.Public access to the webinar will be in "listen-only" mode. Click the link below to join 2952?pwd VG1UOTgrTWtyWEYzMUNYanlvTDJ1dz09Dial the number below for audio-only access to the meeting:Toll-Free: 877-369-0926Webinar ID: 850 6624 2952Passcode: 846396Public Comment:Members of the public wishing to submit comments on agenda items may do so by visitingour website at https://www.northernwater.org/agendas or by calling 970-292-2517 to leavea voicemail. Comments must be received by 8 a.m. on January 6. Public commentssubmitted by the deadline will be entered into the public record.Members of the public wishing to give oral comments directly to the Board should sign upin person to speak in the boardroom.1.Preliminary Items1.A.Call to Order: Roll Call and Verification of QuorumPresenter: Presenter: Chair ApplegateAction: None1.B.Opportunity for Public CommentPresenter: Presenter: Chair ApplegateAction: None1
Page 22.Planning Session Agenda and Meeting MaterialsJanuary 6, 20221.C.Agenda Modification and Meeting ConsiderationsPresenter: Brad WindAction: None1.D.Recommendation for Executive SessionPresenter: Brad Wind and Chris PiggAction: As NeededDiscussion/Study Items2.A.Colorado River Hydrology Trends and Future PlanningPresenter: Brad Udall, Colorado Water InstituteAction: None2.B.C-BT Return Flow Quantification InitiativeAn executive session is recommended to receive advice from legal counsel asauthorized by §24-6-402(4)(b) on specific legal questions related to C-BTReturn Flow Quantification InitiativePresenter: Nathan BakerAction: NoneResolution D-1328-05-19 Article 19 Status of Project Water Supply2.C.Wildfire Recovery UpdatePresenter: Jonathan Hernandez and Esther VincentAction: None2.D.Grand Lake Adaptive Management UpdatePresenter: Maggie SpanglerAction: None2.E.Innovest Third Quarter Investment Portfolio Update for the Northern WaterDefined Benefit PlanPresenter: Judy SkramAction: NoneNorthern Water Defined Benefit 3rd Quarter 20212
Page 33.4.Planning Session Agenda and Meeting MaterialsJanuary 6, 20222.F.Discussion of Alternate Order for Monthly Board MeetingsPresenter: Brad WindAction: None2.G.Resolution D-XXXX-01-22 for FY 2023 Open-Rate Assessment ForwardGuidancePresenter: Kristyn UnreinAction: NoneResolution D-XXXX-01-22 for FY 2023 Open-Rate Assessment ForwardGuidancePreview of Municipal Subdistrict Agenda Topics for January 13, 2022, BoardMeeting3.A.Resolution D-XXXX-01-22 and MS-XXX-01-22 Allocation of Indirect Costs toWater Activity EnterprisesPresenter: Kristyn UnreinAction: NoneResolution D-XXXX-01-22 and MS-XXX-01-22 Allocation of Indirect Costs toWater Activity Enterprises3.B.Intergovernmental Agreement with Larimer County for Construction ofChimney Hollow Open Space InfrastructurePresenter: Joe DonnellyAction: NoneIGA with Larimer County Contract SummaryIGA with Larimer County - Draft3.C.Colorado River Connectivity Channel Final Design Extension with AECOMPresenter: Kevin LockAction: NoneAECOM Amendment 4 Contract SummaryAECOM Amendment 4 Scope of WorkPreview of Northern Water Agenda Topics for January 13, 2022, Board Meeting4.A.Resolution D-XXXX-01-22 and MS-XXX-01-22 Allocation of Indirect Costs toWater Activity EnterprisesPresenter: Kristyn UnreinAction: NoneResolution D-XXXX-01-22 and MS-XXX-01-22 Allocation of Indirect Costs toWater Activity Enterprises3
Page 44.B.5.Planning Session Agenda and Meeting MaterialsJanuary 6, 2022Consulting Services Agreement with Dewberry for NISP Conveyance DesignPresenter: Stephanie CecilAction: NoneDewberry Contract SummaryDewberry Scope of ServicesDewberry Fee EstimateInformational Items5.A.Board of Directors RoundtablePresenter: Chair ApplegateAction: None5.B.Future Events:January 12 and 13, Four States Irrigation Council Annual Meeting, Fort CollinsJanuary 24 and 25, Colorado Water Conservation Board Meeting, AuroraJanuary 26-28, Colorado Water Congress 2022 Annual Convention, AuroraJanuary 28, 9 a.m., Water Efficiency Stakeholders MeetingFebruary 24 and 25, Family Farm Alliance Annual Conference, NevadaPresenter: Brad Wind and OthersAction: None5.C.6.Other MattersPresenter: Brad WindAction: NoneExecutive SessionMatters that fall within C.R.S. § 24-6-402 (4) (a) through (g) may be discussed¹6.A.Procedures for Executive SessionPresenter: Chris PiggAction: None4
Page 5Planning Session Agenda and Meeting MaterialsJanuary 6, 20221The Executive Session listed above may be cancelled at the discretion of the Board of Directors at thecommencement of, or during, this meeting.5
6
7
8
Q3 2021Portfolio ReviewNorthern Colorado Defined Benefit PlanDelete grey box, thenLOGO GOES HEREGordon Tewell, CFA, CPC, ERPA PrincipalSteven Fraley, MBA, CFA Vice President, DirectorDustin Roberts, MBA, QKA, AIF Vice PresidentReport Prepared by: John Brock9Colorado Arizona California www.innovestinc.com
3Q 2021 in ReviewDedication to Client Hard Work Honesty & IntegrityInnovest Published Richard Todd in the Denver Business Journal Steve Karsh in The ArticulatorCelebrations Innovest launched a new website on Oct 1stService in Our Local Community Brother’s Redevelopment Paint-A-Thon Denver Rescue Mission Project Angel HeartNew professionals at Innovest Brian CurranCareer Progressions Claire DeLine and Eileen Pohs102
Innovest’s History With Northern Colorado Water DB2011 ‐ 2012 2011: Moved custody from Fidelity to CharlesSchwab to reduce custody costs 2011: First quarterly report 2011: Recommended new asset allocation toinclude commodities, REITs, floating rate corporateloans, and low correlated hedge fund of funds 2012: Presented 2012 Capital Markets Outlook aspart of annual asset allocation study Provided quarterly performance reports andResearch Reports each quarter2013 – 2014 Reviewed and updated the Investment PolicyStatement Met with representatives and conducted duediligence from each investment strategy used in theplan Provided searches for best of class funds to fill allasset classes Conducted annual asset allocation study Recommended new asset allocation to increaseexposure toward Commodities, Emerging Marketsand Fixed Income, reduce exposure towardInternational and to eliminate REITs2013‐2014 Continued Added Ironwood Partners and Lighthouse GlobalLong/Short to portfolio Replaced Fidelity Floating Rate with Eaton VanceFloating Rate Replaced Janus Perkins Mid Cap Value separateaccount with Robeco Mid Cap Value separateaccount Presented potential replacement candidates forPIMCO Total Return113
Innovest’s History With Northern Colorado Water DB2015 ‐ 2018 Met West Total Return selected to replace PIMCOTotal Return Credit Suisse Commodity selected to replacePIMCO Commodity Return Provided quarterly performance reports andResearch Reports each quarter Replaced Atlanta Capital with Harbor CapitalAppreciation Replaced Virtus EM with Harding Loevner EM. Replaced the LLCH Basket with ½ Litman Gregoryand ½ John Hancock GARS. Moved into lower cost share class for AmericanFund Europacific Growth. Added Vanguard 500 Index Admiral(VFIAX),Vanguard Extended Market Index Admiral(VEXAX),Voya Small Cap Opportunities(NSPIX) and VanguardDeveloped Markets Index Admiral(VTMGX) Removed Credit Suisse and Oak Ridge Small Cap Changed Harbor Cap. Appreciation Share Class toHNACX Replaced Harbor Int’l value with Causeway Int’lValue (CIVIX) Presented annual asset allocation study2019 Presented fiduciary education Removed John Hancock GARS and replaced withLitman Gregory, effective May 3, 20192020 Schroder Total Return merged into the SchroderCore Bond Fund Removed Voya Small Cap Growth Opportunitiesand replaced with Emerald Growth, effectiveSeptember 18, 2020 Presented Fiduciary education in 3Q202021 Presented annual asset allocation study. Allocationchange to mix 2 made April 2021. Schroder Core Bond Fund replaced with Dodge andCox Income124
Fiduciary Topics & TrendsFiduciary EducationRetirement Plan Fiduciaries Are: Anyone who has responsibility for other people’s money:– Board/Committee members– Investment advisers– Plan sponsor– Trustee(s)– Other individuals involved in operating and exercising discretion in administration of the plan NOT Attorneys, Accountants, Actuaries, Brokers and RecordkeepersBeing a fiduciary is less about your named role and more about the functions you performFiduciary Functions: Selecting/monitoring investments available under plan & the service providers Ensuring that plan fees are reasonable and for necessary services Interpreting plan provisions and application of plan terms Ensuring the plan operates in compliance with applicable rules and regulationsHave reasons for the decisions you make and record those decisions135
Fiduciary Topics & TrendsFiduciary Education1. Duty of Loyalty: Act solely in the best interest of plan participants (and beneficiaries) ERISA Duty of Loyalty: “A fiduciary shall discharge his duties solely in the interest of the participantsand beneficiaries and for the exclusive purpose of providing benefits to participants and theirbeneficiaries ”2. Duty of Prudence: Establish a prudent process for selecting & monitoring investments ERISA Duty of Prudence: “A fiduciary shall discharge his duties with respect to a plan with the care,skill, prudence and diligence that a prudent man acting in a like capacity and familiar with suchmatters would use ”3. Duty to Diversify: ERISA Duty of Diversification: “A fiduciary shall discharge his duties with respect to a plan bydiversifying the investments of the plan so as to minimize the risk of large losses ”4. Duty to Follow Plan Documents: Follow plan documents, unless inconsistent with ERISA ERISA Duty to Follow Plan Documents: “A fiduciary shall discharge his duties with respect to a plan inaccordance with the documents and instruments governing the plan ”* The Employee Retirement Income Security Act of 1974 (ERISA) does not apply to public plans. Public plans are governed by theirstate’s adoption of the Uniform Prudent Investor Act (UPIA), which is modeled after ERISA.146
Fiduciary Topics & TrendsResponsibilities of a Plan FiduciaryOrganize Maintain a formalized committeestructureImplement Conduct regular and consistentcommittee meetings to review: By‐laws or Charter Plan investments Representation acrossemployee base Plan expenses Commitment to be a Fiduciary Implement and maintain anInvestment Policy Statement (IPS) How investments are selectedand monitored, and how feesare monitored Plan service providers Participant education Fiduciary education Plan administration andregulatory updates Benchmark expenses to ensurereasonableness Offer a well‐diversified menu ofprudently selected investmentoptions157Document Document key decisions made: Meeting minutes and decisionsshould be memorialized Plan Sponsor’s budget to payservice fees Review annual plan audit andauditor's report to management Maintain a permanent filecontaining documents presentedand reviewed at each committeemeeting Any material communicationsprovided to the committeeabsent a meeting should also beretained
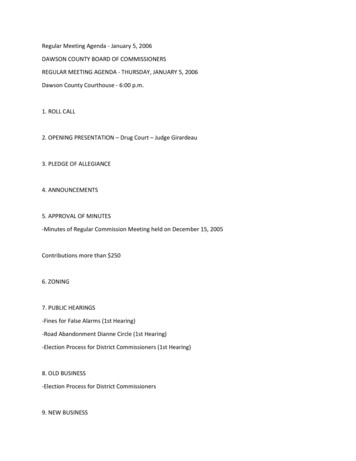
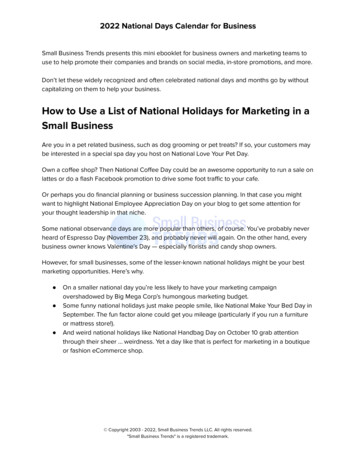
Fiduciary Topics & TrendsWhy Managing Fees MatterEffects of Investment Fees on Accumulation Assuming a 6% Annual Return* 381,339 400,000 300,000 223,248 170,814 148,024 200,000 266,584 180,094 100,000 010 Years15 Years0.50% Fee25 Years1.00% FeeFee Cases 6*Assumes starting balance of 100,000201782020
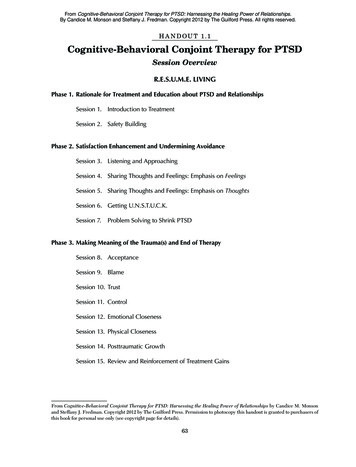
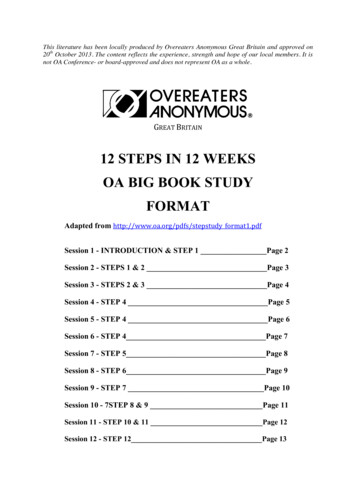
Executive SummarySeptember 30, 2021Performance Over TimeChange in Account ValueLastQuarterYear .706.71-0.586.1416.178.618.106.456.46Northern Colorado Water DB Total FundNorthern CO Water Policy BenchmarkNorthern CO Water Custom Benchmark1357SinceYear Years Years Years InceptionInceptionDate17.10 10.2704/01/2011Risk and Return (Since Inception)Northern Colorado Water DB Total FundS&P 500Russell 20010.0Northern Colorado Water DB Total FundReturn (%)Market ValueAs of09/30/2021Change 43,026,09240,764,553-2,261,538Asset AllocationMarket Value( 0MSCI EAFE5.0MSCI EMBlmbg. Barc. U.S. Aggregate0.0Market ValueAs of07/01/202190 Day U.S. Treasury BillLarge Cap EquityMid Cap EquitySmall Cap EquityInternational EquityEmerging MarketsFixed IncomeFloating Rate Corporate LoansLiquid Low Correlated HedgeLow Correlated HedgeCash & EquivalentsTotal 020.024.0Risk (Standard Deviation %)Cumulative Performance Over Time150%100%50%0%-50 %6/1112/116/1212/126/1312/13Northern Colorado Water DB Total Fund6/1412/146/1512/156/1612/16Northern CO Water Custom Benchmark17Alternative Positions may lag based on the latest available data. Total fund return is reported net of all fees.96/1712/176/1812/186/1912/196/2012/209/21
The 0.00%5.00%0.00%‐5.00%‐10.00%1st Quarter2nd Quarter3rd QuarterUS Large Cap StocksUS Small Cap StocksDeveloped International StocksEmerging Markets StocksCore Fixed IncomeMunicipal Fixed Income18Returns for US Large Cap Stocks S&P 500 TR, US Small Cap Stocks Russell 2000 TR, Developed International Stocks MSCI EAFE NR, Emerging Markets Stocks MSCI EM NR, Core Fixed Income Bloomberg US Agg Bond TR, Municipal Fixed Income Bloomberg Municipal 5yr 4‐6 TR10
Global EconomySources: Charles Schwab, Bloomberg, MacroBond. Data as of 09/30/2021.1911 Although Global and U.S.economic growth rates slowedin the third quarter, they are stillsolidly above trend. The Purchasing Managers Index(PMI) shows the deceleration inglobal and U.S. growth sinceMay – driven largely by theServices sector which washarder hit by the delta variant. Importantly, both U.S. andEurozone, PMI levels remain in“expansion” territory, withreadings above 50. Businessactivity continues to grow, butat a slower rate.
Inflation: Key Trends to Watch The stimulus‐related demandspike, combined with supplyconstraints, has resulted in a surgein consumer prices. We have seen a significantincrease in the number ofcontainer ships delayed outside ofU.S. ports and a continuedshortage in truck drivers. Businesses around the countryhave boosted wages to attractqualified workers, resulting in asteady increase in hourly wages.Source (Top): JPMorgan, Bloomberg. As of 09/23/2021.Source (Bottom): Charles Schwab, MacroBond, Ned Davis Research using monthly data. As of 09/30/2021.2012
US Equities: Do Strong Earnings Justify Valuations?Sources: Charles Schwab, Bloomberg, MacroBond. Data as of 09/30/2021.2113 Stock market valuations inthe U.S. remain high relativeto historical averages. However, strong growth incorporate earnings outpacedthe market in the thirdquarter and brought downforward P/E ratios slightly. From a valuationperspective, internationalequities look attractivecompared to U.S. equities.
Fixed Income: Long‐term Corporate Bond Yields The market believes the Fed will likely raise short‐term interest rates in late 2022 or early 2023. Corporate bond spreads have fallen recently, reflecting the ease of securing financing and policy makers’success with stabilizing financial conditions. Long‐term core bond returns are poised to fall below 3% for the first time in over 50 years.22Sources: BlackRock, Student of the Market. Morningstar. Data as of 09/30/2021. U.S. Bonds represented by the IA SBBI US Gov IT Index from 1/1/26 to 1/3/89 and the Bloomberg U.S. AggBond TR Index from 1/3/1989 to 9/30/2021.14
Global Equities: China’s Impact On Emerging Markets PerformanceChina is Underperforming Other EM Countries23Sources (Top): State Street Global Advisors, Bloomberg. Data as of 09/17/2021.Source (Bottom): WorldBank 2019 Estimates.15 China led the decline in emergingmarkets equities due tounexpected regulatory actionand concerns over the financialstability of its second‐largestproperty developer (Evergrande). China ranks as the world’s secondlargest economy ( 16% of GDP),lagging only the United States,but with higher expected growthrates. While China only makes up justover 4% of the global stockmarket, it represents over 1/3 ofthe Emerging Markets Index, andshould remain an important partof diversified portfolios.
Equity Performance as of September 30, 20213rd Quarter 2021ValueYTD as of September 30, 2021Domestic EquityCoreGrowthValue1 yr Ending September 30, 2021Domestic EquityCoreGrowthValueDomestic Developed International EquityValueCoreGrowth‐1.0%‐0.4%0.1%Emerging Markets‐8.1%Developed International EquityValueCoreGrowth9.6%8.3%6.9%Emerging Markets‐1.2%Developed International EquityValueCoreGrowth30.7%25.7%20.9%Emerging Markets18.2%3 Years Annualized5 Years Annualized10 Years AnnualizedValueDomestic EquityCoreGrowthValueDomestic EquityCoreGrowthValueDomestic mall11.0%13.5%15.3%Small13.2%14.6%15.7%Developed International EquityValueCoreGrowth3.0%7.6%11.9%Emerging Markets8.6%Developed International EquityValueCoreGrowth6.0%8.8%11.4%Emerging Markets9.2%Developed International EquityValueCoreGrowth6.0%8.1%10.1%Emerging Markets6.1%Large Cap Equity S&P 500 TR, S&P 500 Value TR, and S&P 500 Growth TR. Mid Cap Equity Russell Mid Cap TR, Russell Mid Cap Value TR, and Russell Mid Cap Growth TR. Small Cap Equity Russell 2000 TR, Russell2000 Value TR, and Russell 2000 Growth TR. International and EM Equity MSCI EAFE NR, MSCI EAFE Value NR, MSCI EAFE Growth NR, MSCI EM NR. Returns for time periods of 3 years or longer are annualized.2416
Domestic Equity Sector Performance as of September 30, 2021Third Quarter ��5%0.0%‐3.5%‐4%‐3%FinancialsInfo TechnologyEnergy‐2%‐1%0%UtilitiesReal EstateMaterials1%Communication ServicesConsumer DiscretionaryIndustrials2%3%4%Health CareConsumer StaplesOne Year Ending September 30, 1.3%11.0%0.0%10.0%20.0%EnergyIndustrialsConsumer Discretionary30.0%FinancialsInfo TechnologyConsumer Staples40.0%50.0%60.0%Communication ServicesMaterialsUtilities251770.0%Real EstateHealth Care80.0%90.0%
Investment Returns Over TimePeriods EndedSeptember 30, 2021Broad Market IndicesQTDYTDDomestic EquitiesLarge Cap Value Stocks‐0.8Large Cap Core Stocks0.6Large Cap Growth Stocks1.9Mid Cap Value Stocks‐1.0Mid Cap Core Stocks‐0.9Mid Cap Growth Stocks‐0.8Small Cap Value Stocks‐3.0Small Cap Core Stocks‐4.4Small Cap Growth Stocks‐5.7International EquitiesDeveloped International Value Stocks‐1.0Developed International Core Stocks‐0.4Developed International Growth Stocks0.1Emerging Markets Stocks‐8.1Fixed IncomeCore Fixed Income0.10.1Defensive Fixed IncomeMunicipal Fixed Income0.1Defensive Municipal Fixed Income0.0Floating Rate Corporate Loans1.1High Yield Fixed Income0.9Diversifying Asset ClassesLow Correlated Hedge Funds0.8Liquid Low Correlated Hedge Funds‐0.4Commodities6.6Midstream Energy‐1.9Global REITs‐0.36.6Direct Real EstateReinsurance‐0.6Calendar Year ReturnsAnnualized Periods Ended September 30, 2021202020192018201720161 yr3 yrs5 yrs7 yrs10 yrs20 9.92.3‐2.51.6‐9.47.6‐Returns based off the following indices: Large Cap Value Stocks S&P 500 Value TR, Large Cap Core Stocks S&P 500 TR, Large Cap Growth Stocks S&P 500 Growth TR, Mid Cap Value Stocks Russell Mid CapValue TR, Mid Cap Core Stocks Russell Mid Cap TR, Small Cap Value Stocks Russell 2000 Value TR, Small Cap Core Stocks Russell 2000 TR, Small Cap Growth Stocks Russell 2000 Growth TR, DevelopedInternational Value Stocks MSCI EAFE Value NR, Developed International Core Stocks MSCI EAFE NR, Developed International Growth Stocks MSCI EAFE Growth NR, Emerging Markets Stocks MSCI EM NR,Core Fixed Income Bloomberg US Agg Bond TR, Defensive Fixed Income Bloomberg 1‐3 yr US Treasury TR, Municipal Fixed Income Bloomberg Municipal 5 Yr 4‐6 TR, Defensive Municipal Fixed Income Bloomberg 1 Yr 1‐2 TR, Floating Rate Corporate Loans S&P/Leveraged Loan TR, High Yield Bonds ICE BofA US High Yield TR, Low Correlated Hedge Funds HFRI Fund of Funds Composite Index, Liquid LowCorrelated Hedge Funds Wilshire Liquid Alternatives Multi‐Strategy Index, Commodities Bloomberg Commodity TR, Midstream Energy Alerian Midstream Energy TR, Global REITS S&P Developed PropertyTR, Direct Real Estate (Current Quarter, YTD, and Annualized Returns are preliminary) NCREIF ODCE, Reinsurance Eurekahedge ILS Advisers NR LCL2618
Investment Policy Summary as of 2021Client VariablesClient Type:Time Horizon:Expected Return:Risk Tolerances:Defi ned Benefit Pl anGreater than Fi ve Years2.5% over CPIExpected downsi de of –15.5% to ‐18.5% per year based on a statistical confidence level of 95% (1)Asset AllocationDome s ti c Equi tyLa rge Ca p Equi tyMi d/Sma l l Ca p Equi tyPerformance BenchmarksLower LimitStrategicAllocationUpper ryDome s ti c Equi tyLa rge Ca p Va l ueLa rge Ca p CoreLa rge Ca p GrowthMi d Ca p Equi tySma l l Ca p Equi tyInte rna ti ona l Equi tyInvestmentManagerPrimaryIndexPeer GroupUniverseCa mbi a r La rge Ca p Equi tyVa ngua rd 500 I nde x Admi ra lHa rbor Ca pi ta l Appre ci a ti onS&P 500 Va l ueS&P 500 I nde xS&P 500 GrowthLa rge Ca p Va l ueLa rge Ca p CoreLa rge Ca p GrowthRobe co Mi d Ca p Va l ueVa ngua rd Exte nde d Ma rke tEme ra l d GrowthRus s e l l Mi d Ca p Va l ue Inde xS&P Compl e ti on Inde xRus s e l l 2000 Growth I nde xMi d Ca p Va l ueSMI D Ca p CoreSma l l Ca p GrowthCa us e wa y Inte rna ti ona lVa ngua rd De ve l ope d Ma rke ts Inde xAme ri ca n Funds EuroPa ci fi cMSCI :EAFE Va l ueVa ngua rd Spl i ce d De v. Ex. USMSCI :EAFE GrowthNon‐US Equi tyNon‐US Equi tyNon‐US Equi tyHa rdi ng Loe vne r Eme rgi ng Ma rke tsMSCI : Eme rgi ng Ma rke tsEme rgi ng Ma rke tsMe t We s t Tota l Re turnDodge & Cox IncomeBl mbg Aggre gra te BondBl mbg Aggre gra te BondCore Fi xe d I ncomeCore Fi xe d I ncomeEa ton Va nce Fl oa ti ng Ra teCSFB Le v. Loa n Inde xLoa n Pa rti ci pa ti onPa rtne rSe l e ct Al t. Stra tWi l s hi re Li qui d Al t. Mul ti ‐Stra tI M Abs ol ute Re turnIronwood Ins tl Mul ti ‐Stra te gyLi ghthous e Gl oba l Long/ShortHFRI FofF Compos i te I nde xHFRI FofF Compos i te I nde xNANASchwa b Mone y Ma rke t Fund90 Da y US T‐Bi l lNAI nte rna ti ona l Equi ty14.00%17.00%20.00%3.00%6.00%9.00%Eme rgi ng Ma rke tsEme rgi ng Ma rke tsDome s ti c Fi xe d IncomeDome s ti c Fi xe d I 00%Fl oa ti ng Ra te Corpora te Loa nsFl oa ti ng Ra te Corpora te Loa nsLi qui d Low Corre l a te d He dgeLi qui d Low Corre l a te d He dgeLow Corre l a te d He dgeLow Corre l a te d He dge11.00%14.00%17.00%0.00%3.00%100.00%6.00%Ca s h & Equi va l e ntsCa s h & Equi va l e ntsTotal Portfolio Strategic Benchmark:Total Portfolio Secondary 6.00%6.00%23.00%5.00%1.00%14.00%3.00%100.00%S&P 500 Va l ueS&P 500 I nde xS&P 500 GrowthRus s e l l Mi d Ca p Va l ue Inde xS&P Compl e ti on I nde xRus s e l l 2000 Growth Inde xMSCI :EAFE Va l ueVa ngua rd Spl i ce d De v. Ex. USMSCI :EAFE GrowthMSCI : Eme rgi ng Ma rke tsBl mbg Aggre gra te BondCSFB Le v Loa n Inde xWi l s hi re Li qui d Al t. Mul ti ‐Stra tHFRI FofF Compos i te I nde x90 Da y US T‐Bi l lCPI 2.5%2719(1) There is a 5% probability thatthe 1 year modeled loss of ‐15.5% to‐18.5% will be exceeded. Risktolerances are based on 2021capital markets assumptions.NOTE: The 1 year modeled loss willvary from year to year depending onfuture capital market assumptions.
Asset Allocation vs. Target AllocationJune 30, 2021September 30, 2021Large Cap Equity0.3%Mid Cap Equity0.1%Small Cap Equity-0.2 %Mid Cap Equity-0.2 %Small Cap Equity0.0%International EquityLarge Cap EquityInternational Equity-0.6 %-0.1 %-0.3 %Emerging Markets0.0%Emerging MarketsFixed Income0.0%Fixed Income0.1%Floating Rate Corporate Loans0.0%Liquid Low Correlated Hedge0.1%Floating Rate Corporate Loans0.0%Liquid Low Correlated Hedge0.0%Low Correlated Hedge-1.5 %Low Correlated Hedge0.5%Cash & EquivalentsCash & Equivalents-0.3 %-1.0 %-0.5 %0.0%0.5%1.0%-1.8 %Allocation Differences1.5%-0.4 %-0.9 %0.0%0.9%1.8%2.7%Allocation DifferencesJune 30, 2021Large Cap EquityMid Cap EquitySmall Cap EquityInternational EquityEmerging MarketsFixed IncomeFloating Rate Corporate LoansLiquid Low Correlated HedgeLow Correlated HedgeCash & EquivalentsTotal Fund-0.5 %September 30, 2021Market Value( 1.0014.003.00100.00Large Cap EquityMid Cap EquitySmall Cap EquityInternational EquityEmerging MarketsFixed IncomeFloating Rate Corporate LoansLiquid Low Correlated HedgeLow Correlated HedgeCash & EquivalentsTotal Fund2820Market Value( 1.0014.003.00100.00
Manager ScorecardCriteriaOrganizationPeoplePhilosophy &StyleProcessConsistencyAsset Base PerformanceExpensesOverallExp 370.420.821.471.451.00Cambiar Large Cap ValueVanguard 500 Idx;Adm (VFIAX)Harbor:Cap Apprec;Ret (HNACX)Robeco MCVVanguard Ext MI;Adm (VEXAX)Emerald:Growth;Inst (FGROX)Causeway:Intl Val;Inst (CIVIX)Vanguard Dev Mkt;Adm (VTMGX)American Funds EuPc;F3 (FEUPX)Harding Loevner:IEM;I (HLMEX)MetWest:Total Rtn;Plan (MWTSX)Dodge & Cox Income (DODIX)Eaton Vance Flt Rt;Inst (EIBLX)PartnerSel Alt Str;Inst (MASFX)Ironwood Inst'l Multi-Strategy Fund LLCLighthouse Global Long/Short Equity LPCostsMedianExp 570.570.941.792.052.05Ratio ofExp toMedian 7166.6773.6887.2382.1270.7348.78Legend For Overall CriteriaNo/Minimum ConcernsNew No/Minimum ConcernsMinor ConcernUpgrade to Minor ConcernMajor ConcernDowngrade to Minor ConcernUnder ReviewNew Major ConcernManagerMetWest:Total Rtn;Plan (MWTSX)Score FactorPeopleDodge & Cox Income (DODIX)PeopleEaton Vance Flt Rt;Inst (EIBLX)PeopleEaton Vance Flt Rt;Inst (EIBLX)OrganizationCommentsInnovest Due Diligence was recently informed that Tad Rivelle, CIO at TCW, will be retiring at the end of 2021. Tad Rivelle currently serves as aco-PM on both the Met West Total Return and Met West Unconstrained strategies. All other Portfolio Managers will remain on the strategiesand there are no expected changes in the philosophy and process. Innovest will continue to monitor the strategies as Rivelle's departureapproaches.Larissa Roesch retired after 23 years on the strategy 5/1/2021. She leaves behind a strong eight-person investment committee with an averagemanager tenure of over 15 years. Dana Emery (33 years) and Thomas Dugan (28 years) lead the strategy and are accompanied by six otherveteran and rising talent portfolio managers. Innovest will continue to monitor the portfolio manager change in the Dodge & Cox Incomestrategy.Craig Russ will retire in 2022, therefore Eaton Vance added 2 Portfolio Managers to co-manage, Ralph Hinckley and Jake Lemle. Andrew Sveenwill succeed Craig Russ as sole director.In October 2020, Eaton Vance announced that it would be acquired by Morgan Stanley. Although changes to the Eaton Vance team andinvestment strategy are not anticipated, this change warrants a heightened degree of monitoring.The Expense Ratio and Median Expense Ratio for Hedge Fund of Funds and Private Equity Fund of Funds excludes underlying fund expenses; the expenses shown are only at the Fund of Funds level.For additional disclosures related to any non-mutual fund alternative investments, please see the full disclaimer in the appendix.2921
Manager ScorecardManagerPartnerSel Alt Str;Inst (MASFX)Score FactorOrganizationCommentsEffective July, 31st, 2020, the Masters Alternative
a voicemail. Comments must be received by 8 a.m. on January 6. Public comments submitted by the deadline will be entered into the public record. Members of the public wishing to give oral comments directly to the Board should sign up in person to speak in the boardroom. 1. Preliminary Items 1.A. Call to Order: Roll Call and Verification of Quorum