Transcription
HANDBOOKUsing the Q-systemRock mass classification and support design
Oslo, May 2015For further information on this handbook please contact:NGIPostboks 3930Ullevål Stadion0806 OSLONorwaywww.ngi.noCover photograph of the Holmestrand Railway Station by Matthew J. LatoPrinted by Allkopi ASNGI takes no responsibility for possible errors in the handbook, orconsequential damages from the use of information contained therein.
PrefaceThe development of the NGI Q-system for rock mass classification began in the early 1970’s,and was first published in 1974. NGI has continuously improved and updated the system, andproduced the Q-system handbook in 2012 as a summary of NGI’s Best Practice. This currentedition includes NGI developments and experience gained since the publication of the firstedition.3
Contents1Introduction . 61.11.21.3History . 6Areas of application . 6Limitations . 72 Rock mass stability . 82.12.22.3Degree of jointing . 8Joint friction . 8Stress . 93 The Q-system . 104 Calculation of the Q-value . 114.14.24.34.44.54.64.74.84.94General . 11Rock Quality Designation (RQD) . 114.2.1 RQD in blasted underground excavations . 144.2.2 RQD in foliated rocks . 144.2.3 RQD in soft rocks . 144.2.4 RQD in relation to healed joints and mineral fillings . 15Joint set number (Jn) . 154.3.1 Jn in relation to joint length . 16Degree of jointing (RQD/Jn) . 18Joint roughness number (Jr) . 184.5.1 Jr in relation to joint infill . 184.5.2 Jr in relation to joint planarity . 194.5.3 Jr in relation to joint orientation . 194.5.4 Jr in rock masses without joints . 20Joint alteration number (Ja) . 214.6.1 Ja in relation to type of mineral in a joint filling . 23Joint friction (Jr/Ja) . 23Joint water reduction factor (Jw) . 244.8.1 Jw in relation to and changing water inflow . 24Stress Reduction Factor (SRF) .25
4.9.1 SRF and weakness zones intersectingthe underground opening (Case A to E in Table 6a) . 274.9.2 SRF in competent rocks, rock stress problems(Case F to L in Table 6b) . 294.9.3 SRF inn squeezing rock (Case M and N in Table 6c) . 304.9.4 SRF in swelling rock (Case O and P in the Table 6d) . 314.10 Q-parameters related to pre-grouting . 315 Using the Q-system to evaluate the supportrequirements . 325.15.25.35.45.55.65.7Excavation Support Ratio (ESR) . 32Rock support chart . 335.2.1 Sprayed concrete at high Q-values . 365.2.2 Wall support . 36Reinforced ribs of sprayed concrete (RRS) . 37Forepoling . 38Energy absorption of sprayed concrete . 39Support of weak narrow zones . 39Additional comments on stability and rock support . 406 Mapping in underground openings . 426.16.26.3General . 42Engineering geological map . 426.2.1 Mapping of sections . 43Mapping in tunnels excavated by TBM . 447 The Q-system used during pre-investigations7.17.27.3. 45General . 45Use of the Q-system during field mapping . 45Use of the Q-system during core logging . 46References . 48Appendix Tables 1 to 8 . 49Insert Tables and Q-system diagram .(Inside back cover)5
1 INTRODUCTIONNORWEGIAN GEOTECHNICAL INSTITUTE1 Introduction1.1 HistoryThe Q-system was developed at NGI between 1971 and 1974 (Barton et al. 1974). Sincethe introduction of the Q-system in 1974 there has been a considerable development withinsupport philosophy and technology in underground excavations. Several new types of rockbolts have been introduced, and the continuous development of fibre reinforced technologyhas in many ways changed the support procedure. Application of sprayed concrete has gainedacceptance even for good quality rock masses due to demands for a higher level of safetyduring the recent years. Reinforced ribs of sprayed concrete have replaced cast concretestructures to a large extent.Since the introduction of the system in 1974, two revisions of the support chart have beencarried out and published in conference proceedings. An extensive updating in 1993 wasbased on 1050 examples mainly from Norwegian underground excavations (Grimstad andBarton, 1993). In 2002, an updating was made based on more than 900 new examples fromunderground excavations in Norway, Switzerland and India. This update also includedanalytical research with respect to the thickness, spacing and reinforcement of reinforced ribsof sprayed concrete (RRS) as a function of the load and the rock mass quality (Grimstad etal. 2002).In this handbook, the guidelines for RRS in the support chart have been updated. The RRSguidelines are simplified with regards to recent case histories in Norway.1.2 Areas of applicationThe Q-value may be used for classification of the rock mass around an underground opening,as well as for field mapping. This means that the Q-value may be influenced by the blastingon the underground opening. The Q-value in an undisturbed rock mass may be different.The Q-system is a classification system for rock masses with respect to stability of undergroundopenings. Based on estimation of six rock mass parameters, a Q-value for a rock mass can becalculated. This value gives a description of the rock mass quality. The different Q-values arerelated to different types of permanent support by means of a schematic support chart. Thismeans that by calculating the Q-value it is possible to find the type and quantity of supportthat has been applied previously in rock masses of the similar qualities. The Q-system cantherefore be used as a guideline in rock support design decisions and for documentation ofrock mass quality.6
NORWEGIAN GEOTECHNICAL INSTITUTE1 INTRODUCTIONThe Q-system is developed for use in underground openings. However, the system can alsobe used for field mapping, core logging and investigations in a borehole, but it is importantto have in mind that in such cases some of the parameters may be difficult to estimate. TheQ-values from field mapping and boreholes will therefore often be more uncertain than thosemapped in an underground opening, and should be handled with some care.1.3 LimitationsThe majority of the case histories are derived from mainly hard, jointed rocks includingweakness zones. From soft rocks with few or no joints there are only few examples, and byevaluation of support in such types of rocks, other methods should be considered to be usedin addition to the Q-system for support design. It is important to combine application of theQ-system with deformation measurements and numerical simulations in squeezing rock orvery weak rock.The Q-system is empirical with regards to rock support. However, use of sprayed concretehas been extended in rock masses of good quality. The rock support recommendations aretherefore conservative for these cases.7
2 ROCK MASS STABILITYNORWEGIAN GEOTECHNICAL INSTITUTE2 Rock mass stabilityDuring underground excavation it is very important to have a close visual observation of therock surface in the whole tunnel periphery before the rock is covered by sprayed concrete.In addition to the visual observation, hammering with a scaling rod or a hammer will giveimportant observation of deterioration of unstable rock giving particular sounds. Also smallcracks, invisible from the invert, will be observed with a closer look. Altered rock may showthe same geological structures as the original fresh and unweathered rock, and may not benoticed when observed at distance. In order to have a close observation it is of outmostimportance to have access to the face and crown by use of lifting equipment especiallydesigned for this purpose.Rock mass stability is influenced by several parameters, but the following three factors arethe most important: Degree of jointing (block size)Joint frictionsStress2.1 Degree of jointingThe degree of jointing, or block size, is determined by the joint pattern, i.e., joint orientationand joint spacing. At a certain location in the rock mass, there will, in most cases, be a jointpattern which could be well or not so well defined. Often joint directions exist systematicallyin rock masses, and most of the joints will be parallel with one of these directions. Nearparallel joints form joint sets, and the joint spacing within each set will usually showcharacteristic distributions. The joint spacing may be reduced considerably along some zonesin the surrounding rock. Such zones are called fracture zones. Stability will generally decreasewhen joint spacing decreases and the number of joint sets increases. In soft rocks wheredeformation can occur independently of joints, the degree of jointing has less importance thanit has in hard rocks.2.2 Joint frictionIn hard rocks, deformations will occur as shear displacements along joints. The friction alongthe joints will therefore be significant for the rock mass stability. Joint friction is dependent onjoint roughness, thickness and type of mineral fillings. Very rough joints, joints with no fillingor joints with only a thin, hard mineral filling will be favourable for stability. On the otherhand, smooth surface and/or a thick filling of a soft mineral will result in low friction and poorstability. In soft rocks where deformation is less dependent of joints, the joint friction factoris less significant.8
NORWEGIAN GEOTECHNICAL INSTITUTE2 ROCK MASS STABILITY2.3 StressThe vertical stress in a rock mass commonly depends on the depth below the surface. However,tectonic stresses and anisotropic stresses due to topography can be more influential in someareas. Stability of the underground excavation will generally depend on the stress magnitudein relation to the rock strength. Moderate stresses are usually favourable for stability. Lowstresses are often unfavourable for the stability. In rock masses intersected by zones of weakmineral fillings such as clay or crushed rock, the stress situation may vary considerablywithin relatively small areas. Experience from tunnel projects in Norway has shown that ifthe magnitude of the major principal stress approaches about 1/5 of the compressive strengthof the rock, spalling may occur. When tangential stresses exceed the magnitude of the rockcompressive strength, squeezing may occur. In other words; the anisotropy of the rock massplays an important role when designing rock support.9
3 THE Q-SYSTEMNORWEGIAN GEOTECHNICAL INSTITUTE3 The Q-systemThe Q-value gives a description of the rock mass stability of an underground opening injointed rock masses. High Q-values indicates good stability and low values means poorstability. Based on 6 parameters the Q-value is calculated using the following equation:The six parameters are:RQD Degree of jointing (Rock Quality Designation)Jn Joint set numberJr Joint roughness numberJa Joint alteration numberJw Joint water reduction factorSRF Stress Reduction FactorThe individual parameters are determined during geological mapping using tables that givenumerical values to be assigned to a described situation. Paired, the six parameters expressthe three main factors which describe the stability in underground openings:RQDJn Degree of jointing (or block size)JrJa Joint friction (inter-block shear strength)JwSRF Active stress10
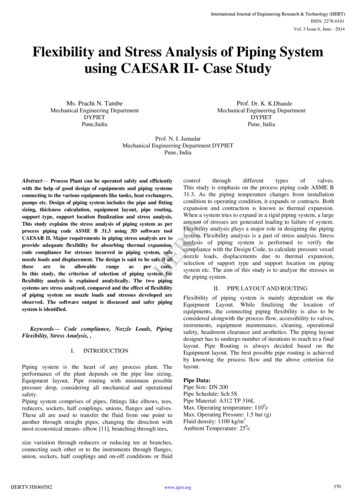
NORWEGIAN GEOTECHNICAL INSTITUTE4 CALCULATION OF THE Q-VALUE4 Calculation of theQ-value4.1 GeneralQ-values can be determined in different ways, by geological mapping in undergroundexcavations, on the surface, or alternatively by core logging. The most correct values areobtained from geological mapping underground. Each of the six parameters is determinedaccording to a description found in tables. A complete set of these tables is inserted in theback cover of the handbook.During the mapping it may be necessary to divide the underground excavation into severalsections so that the variation of the Q-value within each section is moderate, i.e. this variationshould not exceed that of a rock class in the support chart. During excavation, one blast roundwill often be a natural section for individual mapping. In sections of a few metres length theremay be some variation, and in order to show this variation, histograms may be used duringmapping.The true Q-value at the level of excavation can only be observed in the excavation itself,and Q-values obtained by other methods will be more uncertain. The number of joint setsmay be underestimated from drill cores and estimations of the parameters Jw and SRFmay be cumbersome without actual observations on site. From surface mapping Ja maybe particularly uncertain because joint filling may be washed out at the surface, and otherjoint parameters may be difficult to observe. In such cases it may be an advantage to usehistograms to visualize variations in the data. By using maximum and minimum values foreach parameter, the variations will be visualized, and Q-value can then be calculated by usingthe mean values for each parameter. In addition the maximum and minimum Q-value can alsobe estimated. An example from a long tunnel section is shown in Figure 1.The Q-value varies between 0.001 and 1000. Please note that it is possible to get highervalues and slightly lower values by extreme combinations of parameters. In such odd casesone can use 0.001 and 1000 respectively for determination of support.4.2 Rock Quality Designation (RQD)RQD was defined by Deere in 1963 (Deere, 1963) and was intended to be used as a simpleclassification system for the stability of rock masses. Using the RQD-value, five rock classesare defined (A-E) as shown in Table 1. RQD was originally defined from drill cores as follows:11
4 CALCULATION OF THE Q-VALUENORWEGIAN GEOTECHNICAL INSTITUTE“RQD is the sum of the length (between natural joints) of all core pieces morethan 10 cm long (or core diameter x 2) as a percentage of the total core length”RQD will therefore be a percentage between 0 and 100. If 0 is used in the Q-formula, it willgive a Q-value of 0 and therefore all RQD-values between 0 and 10 are increased to 10 whencalculating the Q-value.Table 1 RQD-values and volumetric jointing.1RQD (Rock Quality Designation)RQDAVery poor( 27 joints per m3 )0-25BPoor(20-27 joints per m3 )25-50CFair(13-19 joints per m3 )50-75DGood(8-12 joints per m3 )75-90EExcellent(0-7 joints per m3 )90-100Note: i) Where RQD is reported or measured as 10 (including 0) the value 10 is used to evaluate the Q-valueii) RQD-intervals of 5, i.e. 100, 95, 90, etc., are sufficiently accurateIn an underground opening or a cavern it is usually possible to get a three dimensional viewof the rock mass. A three dimensional RQD may therefore be used. That means that the RQDvalue is estimated from the number of joints per m3. The following formula may be used(Palmström, 2005):RQD 110 – 2.5Jv (for Jv between 4 and 44)where Jv is the number of joints per m3Based on the formula above, the number of joints per m3 for each RQD-class is shown inTable 1. Several readings of RQD should be taken along surfaces of different orientation, ifpossible perpendicular to each other, and the mean value can then be used in the calculationof the Q-value. The variation in RQD-values may be shown in histograms.In a rock exposure at the surface, it may be more difficult to obtain the correct RQD values.If an exposure constitutes of only one planar face, it may be difficult to determine the jointspacing of joints parallel or sub-parallel to this surface.12
NORWEGIAN GEOTECHNICAL INSTITUTE(RQD101007170Q - VALUES:Q (typical min) Q (typical max) Q (mean value) Q (most frequent) BLOCK4 CALCULATION OF THE Q-VALUE(φ r)andTAN(φ *(Jw0.661.000.911.00FAIR/ SRF) Q/ 10.0 0.008/ 1.0 100.0/ 2.4 4.44/ 1.0 23.33GOODEXCRQD %10Core pieces 10 O90100ONENONEJnJoint set number20TANJn)15.03.06.79.0V. TINGDISC.60Jr40Jointroughness- least favourable200010,511,51,5THICK FILLS502THIN FILLS3COATED4UNFILLED HEAL40Ja3020Jointalteration- least favourable100020ACTIVE131286512EXC. INFLOWS808644HIGH TRESS / 05107,552,5400200100502010520,512,5Rev.Report No.Figure No.Depth zone (m)Drawn byDateLoggCheckedApprovedProject nameQ - REGISTRATIONS CHARTFigure 1An example of histogram presentation of Q-parameters from a long tunnel section.13
4 CALCULATION OF THE Q-VALUENORWEGIAN GEOTECHNICAL INSTITUTE4.2.1 RQD in blasted underground excavationsAccording to the original definition of RQD, only natural joints are to be considered. Aclose investigation of the muck pile from a relevant blast round may indicate the order ofmagnitude of the RQD. All types of fractures, despite their origin, may influence on thestability underground. Fractures caused by blasting will usually occur only in a zone up to2 m from the periphery of the excavation, and may therefore be less significant for the overallstability than pervasive, natural joints. These artificial joints should not be taken into accountwhen evaluating the RQD. However, they may be important for the stability of single blocks.Single blocks must be supported independently.4.2.2 RQD in foliated rocksIn some cases there are uncertainties to which joints should be considered. This will oftenbe the case in strongly foliated rocks or rocks with well developed schistosity. A schistosesurface represents a weakness in the rock, and is not necessarily a natural joint. At the surface,schist often split up into thin flakes due to weathering, whereas some metres below the surfacethe rock may appear massive. Hence schistose and foliated rocks may have high RQD values.Drilled cores of schist may also behave in the same way. Soon after drilling only few jointscan be seen, and the RQD-value may be 100. After drying for some weeks, the cores mayconsist of only thin disks, and the RQD-value could be zero. In such cases it is difficult tosay which RQD-value should be used in calculating the Q-value, and this uncertainty musttherefore be taken into account in the support design.In rocks with strongly developed foliation or schistosity it is often helpful to look at therock rubble being mucked out of an excavation. The size of the blasted blocks will give agood indication of the RQD-value. In many cases apparent schistose rocks give blocks ofconsiderable size when blasted. This means that in unweathered schists only a few of thesurfaces developed from schistosity may be real joints, and rock types like phyllite, slate andmica schist may therefore in many cases have a RQD value of 100.4.2.3 RQD in soft rocksRQD may be difficult to define, and it is therefore important to consider RQD in relation tothe other parameters such as SRF and Jn. Some soft rocks may have no or very few joints, andshould therefore by definition have a high RQD-value. However, in weakly consolidated orstrongly weathered non-cohesive material that can be defined as soil, the RQD-value shouldbe stipulated to 10. In cohesive and soft material such as clay, the RQD-value should alsobe 10, because the material act as a weakness zone compared to the surrounding rock. Whenrock deformation is independent of jointing the Q-system compensates by using a high SRFvalue, i.e. squeezing rock.14
NORWEGIAN GEOTECHNICAL INSTITUTE4 CALCULATION OF THE Q-VALUE4.2.4 RQD in relation to healed joints and mineral fillingsHealed joints and joints with mineral fillings can cause uncertainty in the calculation of RQD.The strength of the minerals in the joint filling is vital. Minerals such as chlorite, mica andclay will usually result in weak bindings between the joint walls, whereas epidote, feldsparand quartz do not necessarily mean a weakening of the rock mass. Joints with calcite fillingmay be more uncertain. In competent rocks, joints will form a weak surface, but in weakrocks there may be the opposite situation. A simple test is to hit the rock with a hammer andlook for where the breaks occur.4.3 Joint set number (Jn)Shape and size of the blocks in a rock mass depend on the joint geometry. Joints within ajoint set will be nearly parallel to one another and will display a characteristic joint spacing.Joints that do not occur systematically or that have a spacing of several meters are calledrandom joints. However, the effect of spacing strongly depends on the span or height ofthe underground opening. If more than one joint belonging to a joint set appears in theunderground opening, it has an effect on the stability and should be regarded as a joint set.The number of Jn is not the same as the number of joint sets.Table 2 Jn – values.2Joint set numberJnAMassive, no or few joints0.5-1.0BOne joint set2COne joint set plus random joints3DTwo joint sets4ETwo joint sets plus random joints6FThree joint sets9GThree joint sets plus random joints12HFour or more joint sets, random heavily jointed “sugar cube”, etc15JCrushed rock, earth like20Note: i) For tunnel intersections, use 3 x Jnii) For portals, use 2 x Jn15
4 CALCULATION OF THE Q-VALUENORWEGIAN GEOTECHNICAL INSTITUTEBy studying the shape of the blocks in rock mass, the prominent joint directions will becomeapparent. Table 2 gives the parameter values for Jn according to the number of joint sets andrandom joints. In an underground opening the joints sets are often quite easy to identify. If thejoint sets are difficult to identify directly, the orientation of a number of joints can be plottedin a stereo net, see Figure 2. The different joint directions will then occur as concentrationsin the stereogram.The definition of joint sets depends on the joint spacing between near parallel joints, but alsoon the span or height of the underground opening. If the joint spacing is generally greater thanthe span or height, the blocks formed by this specific joint set will usually be too large to fallout, and the joints should then be considered as random.When calculating the Jn-value, it is very important to consider only the joints occurring atthe same location and forming definite blocks. In situations where the Jn-value is determinedfrom joint observations in a longer section of an underground excavation, summing up all thejoint sets results in a Jn-value that is too high.4.3.1 Jn in relation to joint lengthThe length of the joints does not directly affect the Q-values, but has importance for stabilityof the opening. Joints with considerable length, which intersect the whole cross section ofan opening, will usually be more important for stability than shorter joints. Very short joints,often termed cracks, may have some importance locally, i.e. stability of small blocks andmust therefore be considered. When short joints in general do not take part in the formationof blocks, they can be considered as random even if they occur rather systematically. If theytake part in the formation of blocks, they must be considered as a joint set in the particularlocation in which they occur.In some cases it is necessary not only to consider the number of joint directions, but also theshape of the blocks and the possibility of block fall. One example is columnar basalt whichoccurs among other places in Iceland, see Figure 2. The columns are usually hexagonal inshape, formed by joints in three different joint directions. The only direction fall-out canoccur, is along the axes of the columns. As long as no joints occur across these axes, normallyno blocks will fall. Even if there are three apparent joint directions shaping the columns, itis not correct to consider these as three joint sets, i.e. Jn should not usually be 9. A Jn-valueof 4 is more reasonable since the column may be considered to be formed by two highlyundulating sets of joints. Empirical data from underground openings in this type of rock oftenshow good stability. Similar conditions can be encountered in tightly folded schists wheresliding is prevented in certain directions.16
NORWEGIAN GEOTECHNICAL INSTITUTE4 CALCULATION OF THE Q-VALUEOne joint set Jn 2Two joint sets Jn 4Note:The number of joint directions is not alwaysthe same as the number of joint setsThree joint sets Jn 9 Three joint sets Jn 12Columnar jointing with three joint directions, but Jn 4Figure 2Different joint patterns shown as block diagrams and in stereonets.17
4 CALCULATION OF THE Q-VALUENORWEGIAN GEOTECHNICAL INSTITUTE4.4 Degree of jointing (RQD/Jn)The fraction RQD/Jn represents the relative block size in the rock masses. In addition to RQDand Jn it is also useful to make notes of the real size and shape of the blocks, and the jointfrequency.4.5 Joint roughness number (Jr)Joint friction depends on the nature of the joint wall surfaces, if they are undulating, planar,rough or smooth. The joint roughness number describes these conditions and is estimatedfrom Table 3, or Figure 3. The joint description is based on roughness in two scales:1) The terms rough, smooth and slickenside refer to small structures in a scale ofcentimetres or millimetres. This can be evaluated by running a finger along thejoint wall; small scale roughness will then be felt.2) Large scale roughness is measured on a dm to m scale and is measured by layinga 1 m long ruler on the joint surface to determine the large scale roughnessamplitude. The terms stepped, undulating and planar are used for large scaleroughness. The large scale roughness must be considered in relation to the blocksize and also to the probable direction of sliding.All joint sets at a location must be evaluated with regards to Jr. When calculating the Q
In this handbook, the guidelines for RRS in the support chart have been updated. The RRS-guidelines are simplified with regards to recent case histories in Norway. 1.2 Areas of application The Q-value may be used for classification of the rock mass aro