Transcription
Presented at the 2016 ICEAA Professional Development & Training WorkshopNaval Center for Cost Analysis (NCCA)Cost Estimating Relationship (CER)Development HandbookStudy Team:Bruce Parker, Patrick Staley, John Fitch (NCCA)Adam James, Anna Irvine, Jeff Cherwonik, Brian Flynn (Technomics)Alf Smith, Jeff McDowell (Tecolote)
Presented at the 2016 ICEAA Professional Development & Training WorkshopMotivation/ Objective A handbook to provide cost estimators with currentbest practices analyzing data and developing CERs Incorporates traditional and modern methodologies ina logical flow Provides well-developed examples to follow Part of NCCA Tool Roadmap2
Presented at the 2016 ICEAA Professional Development & Training WorkshopOutline of Presentation Basic StepsooooooooCollect dataNormalizeAnalyzeFind cost driversGenerate CERValidate CERCharacterize uncertaintyDocument Sample of Worked Examples Concluding Remarks3
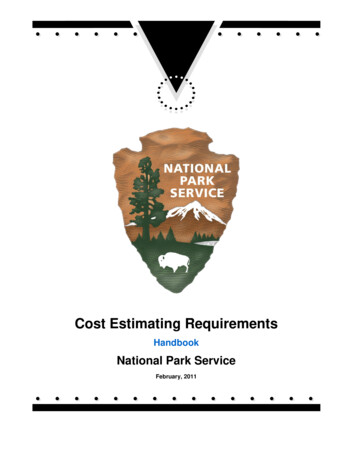
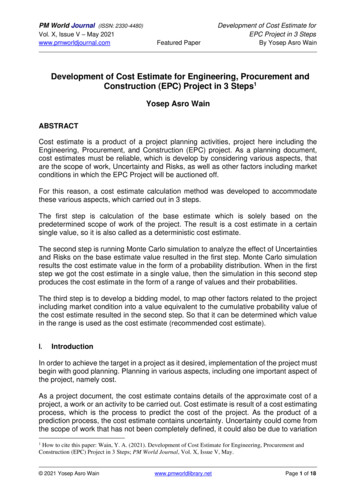
Basic Steps in CER DevelopmentProcessPresented at the 2016 ICEAA Professional Development & Training Workshop The blue boxes correspond to the six core steps of the process, which arethe focus of the HB. The preceding steps, denoted by gray boxes, are important to the CERdevelopment process, and a discussion of how to approach each of thesesteps is included. The analysis, in practice, is often iterative in nature, therefore the utility ofthe guide allows the user to move from one section to another to find theinformation most relevant to a particular question. The flow charts guidethe flow of the document.4
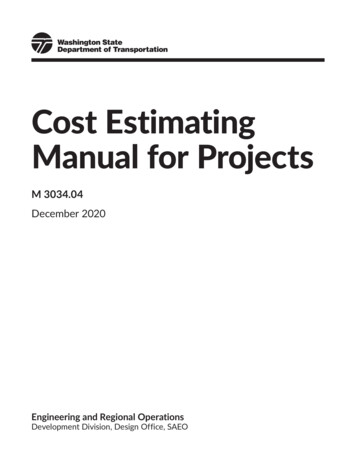
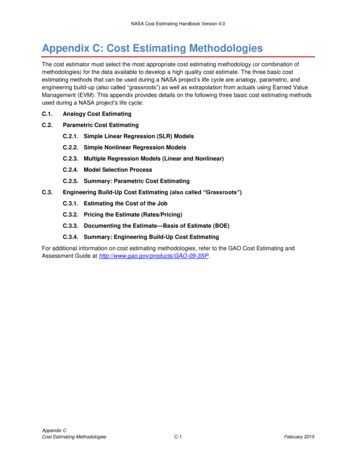
Presented at the 2016 ICEAA Professional Development & Training WorkshopStep 1: Collect Data Data Collection is the foundation ofa reliable cost estimate Resources outlining best practicesfor cost estimating, including datacollection and analysis:– GAO Cost Analysis Handbook(http://www.gao.gov/products/GAO-093SP)– Department of the Navy Cost EstimatingGuide. (https://www.ncca.navy.mil/references/DON Cost Estimating Guide.pdf) Familiarity with the programmatic,technical, manufacturing andsupportability aspects of theprogram of interest is critical tounderstand the cost driversCharacteristic DataProgrammaticsService:Ai r Force , Army, DoD, Na vyProgram / CommodityType: MIL-STD-881CProgram / CommoditySub-TypeCost and ScheduleDataCostoooooSAR/DAESCSDRCPRContra ctsContra ctor InternalDa taScheduleooooIMSIMPSAR/ DAESPO Sche dulesMission TypeCapabilitiesSys te m Ca pabilityArchi te ctureTechnicalPhys i cal / Pe rformanceCha ra cteristics5
Presented at the 2016 ICEAA Professional Development & Training WorkshopStep 2: Consolidate and Normalize Data Ensure that analogous systems or system components are consistent– May need to go to component level to make them more comparable Normalizing data for cost, quantity, and sizing; content; andphysical parameters. Examples include (CEBoK Module 4):– Escalating historical costs to a common base year including overhead, Cost ofMoney (COM), General and Administrative (G&A) expenses, and fee– Normalize data to a single unit cost where applicable, dividing by the quantityand standardizing along the cost improvement curve– Addressing differences in manufacturing processes across states ofdevelopment– Differences in technology across systems– Significant digits of numerical data (greater than overall estimate precision)6
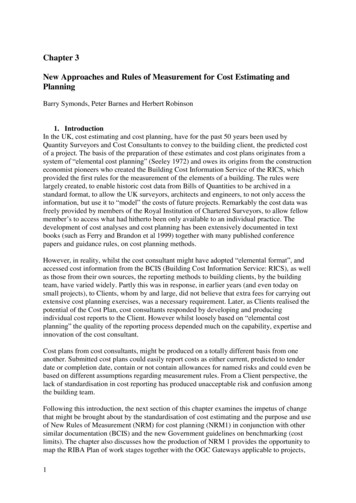
Presented at the 2016 ICEAA Professional Development & Training WorkshopStep 3: Analyze Data Assess # of Data Points– Degrees of Freedom Univariate Data AnalysisFrequency, Number ofProgramsThe Number of Programs in the CostRange 6420515 25 35 45 55 65 75 85 95APUC Cost RangeMean, Median, Mode,Variance, StDev, CV, RangeAssess need for CER– Constant CER– Parametric7
Presented at the 2016 ICEAA Professional Development & Training WorkshopStep 4: Identify Cost Drivers IndependentVariable DataAnalysis Test Correlations ID Variables HypothesizeFunctional Form Transform data, ifneeded8
Presented at the 2016 ICEAA Professional Development & Training WorkshopStep 5: Generate CER5.0 Generate CER Select Variables to use Always fit the OLS model, even ifhypothesizing another form Regression Methods– OLS, WLS, Transforms, GLM(MLE), NLS– Different tools to solve differentmodel forms Check Assumptions to validateuse of the model form A priori information as a tool Harmful multicollinearity– Ridge Regression Steps 5 and 6 can be (and oftenare) iterative9
Presented at the 2016 ICEAA Professional Development & Training WorkshopStep 5: Generate CER Ordinary Least Squares (OLS) regression serves as the foundationalmodel for which other models can be thought of as “remedies” toOLS deficiencies and/or assumption violations– “Core” OLS assumptions1.2.3.4.Independence of ErrorsHomoscedasticityNormality of ErrorsLinearity– Other issues such as multicollinearity, physical interpretations, computationalefficiencies, etc. may drive model choice Models are specified by both a functional form and error structuresome function ofyour predictors𝒚𝒚 𝑓𝑓 𝑿𝑿; 𝜷𝜷 𝜺𝜺some error term or function(can be “multiplicative” in nature)10
Presented at the 2016 ICEAA Professional Development & Training WorkshopStep 6: Validate CER6.0 Validate CERValidating a CER is far more than justlooking at an R-squared, F-statistic, ora single graph Understand the data relationships andcoefficient estimates Determine consistency with engineeringand physical principles Assess and validate the statistical modelassumptions Identify and review high influence pointssuch as leverage points and potentialoutliers Assess the impacts of multicollinearity Determine the significance of the modeland independent variables Quantify metrics of best fit and predictionstrength Compare and contrast multiple competingCERs to identify the “best” model11
Presented at the 2016 ICEAA Professional Development & Training WorkshopStep 6: Validate CERSteps through each assumptionand provides discussions ofoptions to diagnose and remedyproblems1. Independence of errors– Each error is distributedindependently2. Homoscedasticity– Each error is distributedidentically (with the samevariance)3. Normality of Errors– Each error is distributed accordingto the normal distribution4. Linearity– 𝒚𝒚, is a linear function of thepredictors12
Presented at the 2016 ICEAA Professional Development & Training WorkshopStep 6: Validate CER Model Assumptions– Assess and validate (both graphically and formally) the underlying assumptions– Violations of assumptions, depending on the severity, can completely invalidate a model Model Diagnostics– Diagnose and assess influential points (i.e., potential outliers and leverage points)– Assess multicollinearity which can potentially devastate a model Model Significance– Assess statistical significance of both predictors and the model– F-tests, t-tests, p-values, etc Model Quality– Assess metrics of fit and prediction for the newly constructed CER– Often assess metrics for fit, when prediction is really of interest Model Selection– Choose a set of variables within one model form (such as linear or log-linear)– Select between different model functional forms13
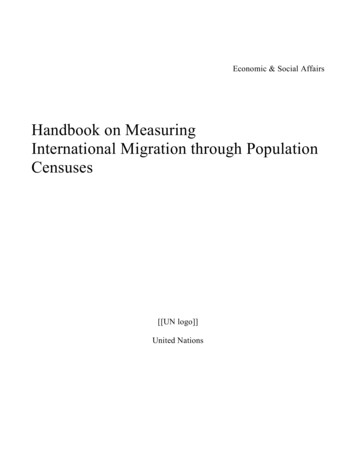
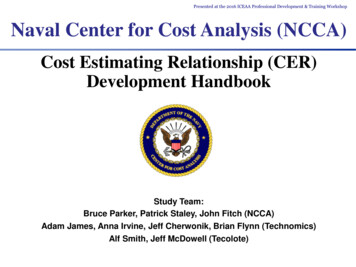
Presented at the 2016 ICEAA Professional Development & Training WorkshopStep 7: Characterize Uncertainty7.0 CharacterizeUncertainty Understanding the risk and uncertaintyassociated with a CER is crucial to accurateimplementation Adjust Point Estimate: NCCA policy toestimate using the sum of the means The HB references the JA CSRUHIV. Prediction IntervalsEstimate InputsInputx nullHP500.0000WeightConfidence Level (%)10000.000095.00%Prediction ResultsResultx nullLower Bound179539.6779Estimate207370.4389Upper Bound235201.1998Delta(%)Lower Bound13.4208Upper Bound13.4208RI K(%) MultiplierLower BoundUpper Bound86.5792113.420814
Presented at the 2016 ICEAA Professional Development & Training WorkshopStep 8: Document CER8.0 Document CER Comprehensive, accuratedocumentation is critical toenable traceability andauditability of a CER, andmore broadly a cost estimate15
Presented at the 2016 ICEAA Professional Development & Training WorkshopCER HANDBOOK EXAMPLES First principles calculations for most examples are in an Excel workbook CO TAT is used to demonstrate typical statistical package behaviorCost Research & Tools Division16
Presented at the 2016 ICEAA Professional Development & Training WorkshopNotional Electronics Data Most example calculations make use of this data Every chart and tabular result can be found in anExcel workbook shipped with the handbook17
Presented at the 2016 ICEAA Professional Development & Training WorkshopUnivariate Descriptive Statistics18
Presented at the 2016 ICEAA Professional Development & Training WorkshopUnivariate Inferential Statistics Excel workbook containsdetailed calculations (sampleto right) for every figure andtable This figure illustrates how tocalculate the confidence andprediction interval if yourpoint estimate is the mean ofa set of data19
Presented at the 2016 ICEAA Professional Development & Training WorkshopOLS Regression20
Presented at the 2016 ICEAA Professional Development & Training WorkshopCompare Univariate to Linear RegressionExcel workbook hasdetailed calculationsto produce these charts By using same data throughout,can compare results Figure 73 demonstratesincreased precision of the OLSCER over using the mean of thecost as an estimate21
Presented at the 2016 ICEAA Professional Development & Training WorkshopWeighted Least Squares22
Presented at the 2016 ICEAA Professional Development & Training WorkshopRidge Regression Handbook goes through theprocess to identify thatPower and Aperture arecorrelated (multicollinearity) Ridge regression explainedto address the issue Ridge plot shows that asridge parameter increases,SSE also increases23
Presented at the 2016 ICEAA Professional Development & Training WorkshopOther Examples The handbook is your one stop shop for costanalysis regression and statistics Worked examples include:––––––Dummy VariablesGeneralized Least Squares (GLS) (IRLS, MUPE)Generalized regression (ZMPE)Transformable Linear and the Log-Linear ModelGeneralized Linear ModelEstimation with Prior Information Exact Prior Information on Parameter Relationships Pseudo-Exact Prior Information on Parameter Values24
Presented at the 2016 ICEAA Professional Development & Training WorkshopConcluding Remarks Initial draft of handbook completed Mar 2015 Leads the analyst through a logical and systematic process toperform cost statistical analysis and regression– Core concepts, mathematics and worked examples are described indetail– The more esoteric technical content is found in the appendices Draft now being refined and a single set of examples beingestablished throughout Approved NCCA CER Handbook will be published atwww.ncca.navy.mil on or before 26 August 2016 Future goals: broader coordination of handbook, trainingcourse development, and tool enhancements25
Presented at the 2016 ICEAA Professional Development & Training WorkshopCER HANDBOOK BACKUPCost Research & Tools Division26
Presented at the 2016 ICEAA Professional Development & Training WorkshopMultivariate Using Matrix Math Excel contains the matrix math to solve forCost 37.31 28.21 * Power 6.105 * Aper ANOVA and t statistics also provided27
Cost Estimating Relationship (CER) Development Handbook. Study Team: Bruce Parker, Patrick Staley, John Fitch (NCCA) Adam James, Anna Irvine, Jeff Cherwonik, Brian Flynn ( Technomics) Alf Smith, Jeff McDowell (Tecolote) Presented at the 20