Transcription
Tolerance Design1ME222/424MSC 424TME 424PD Funkenbusch (ME 222/424, TME 424, MSC 424)
Tolerance Design2 Where do tolerances come from? HistoryAbsolute vs. Statistical tolerance as acceptable range Summing tolerances Worst-caseStatisticalMore complex systems Tolerance Design methodology Tolerancing based on variance controlPD Funkenbusch (ME 222/424)
Interchangeable parts3 Inventor? Depends on yourinterpretation. But maybe asearly as 1040’s AD (Chinesemoveable type). Eli Whitney helped popularizehttp://p2.img.cctvpic.comthe idea for the manufacture ofguns. “Took off” in the 1800’s as acornerstone of mass production. Tolerances make sure parts willfir together.http://3.bp.blogspot.comPD Funkenbusch (ME 222/424)
Tolerance as acceptable range4 Set maximum and minimum values for somecharacteristic (e.g. part length). LSL Lower Specification LimitUSL Upper Specification Limit For simplicity we will assume that the average value (m)is midway between the LSL and USL. Tolerance D LSL m - DUSL m D Range of values m DPD Funkenbusch (ME 222/424)
m D5 User (customer) friendly Immediate sense of the values likely to be encountered. Quick measure of “quality” Small D values are immediately impressive But what does the tolerance actually mean? Two common methods to specify Absolute StatisticalPD Funkenbusch (ME 222/424)
Absolute (method one)6 Inspect all components Reject (discard) all those outside of the tolerance(m D) All parts (that pass) will be within the tolerance Absolute limitPD Funkenbusch (ME 222/424)
Statistical (method two)7 Analyze a sample of components. Determine average (m) , standarddeviation (s), and distribution. Set tolerance so that only a small, specified fraction of componentswill be outside of the range. For simplicity here, we will assume that all distributions are normal. Examples: D 1 s 68.3 % in tolerance average one standard deviation D 3 s 99.73 % in tolerance D 6 s 99.9999998% in tolerance D 4.5s 99.99966% in toleranceNote: D 4.5s (evaluated over an extended time period) is sometimes used as thecut-off point for “Six Sigma Quality” less than 3.4 DPMO (defects per millionopportunities) “rule of thumb” to adjust for drift in product meanPD Funkenbusch (ME 222/424)
Summing tolerances8 Often concerned about howto sum tolerances.m2 D2m1 D1 Determine final tolerancebased on componenttolerances Determine how to adjustcomponent tolerances toachieve a desired finaltolerance ? ?PD Funkenbusch (ME 222/424)Add in information on coststo find the most costeffective approach
Example9m1 D1m2 D2m3 D3m4 D4 Fit three componentsend to end into a slotmachined into a fourthcomponent. Want to determine the“gap” remaining.mg Dg m2 D2PD Funkenbusch (ME 222/424)Average length of gapTolerance on the gap
Gap10 Average mg Dg add & subtract based ongeometry mg m4 - m1 - m2 - m3 Tolerance always sumUncertainty increases with eachcomponent included Different ways of summing PD Funkenbusch (ME 222/424)“Worst case”“Statistical”
“Worst-case” summation11 Tolerance sum D’s Dg D1 D2 D 3 D4mg DgPD Funkenbusch (ME 222/424) With absolute tolerances,this ensures that all thegaps will be within thetolerance (i.e. mg Dg ) Can also use withstatistical tolerances. Inthis case it is possible tohave product outside oftolerance but theprobability will be small.
“Statistical” summation12 Tolerance addD2‘s Most meaningful withstatistical tolerances. Dg2 D12 D22 D32 D42 Assuming all distributionsmg DgPD Funkenbusch (ME 222/424)are normal and that thecomponent tolerances areset to the same number ofs’s (e.g. D 3s for allcomponents), then theproduct tolerance shouldcorrespond to that of thecomponents.
Where does this (summing squares) come from?13 From statistics, know that uncorrelated variancescan be added: stotal2 s12 s22 s32 s42 Multiply thru by a constant squared, n2: n2stotal2 n2s12 n2s22 n2s32 n2s42 But D ns is how we defined the statistical tolerance,so: Dproduct2 D12 D22 D32 D42 PD Funkenbusch (ME 222/424)
Numerical example14m1 D1m2 D2m3 D3m4 D4 Fit three componentsend to end into a slotmachined into a fourthcomponent.Comp.mg Dgm2 D2PD Funkenbusch (ME 222/424)m (mm) D (mm)1100.12300.33200.34610.2
Average gap15Comp.m (mm) D (mm)1100.12300.33200.34610.2mg DgPD Funkenbusch (ME 222/424) Add & subtract based ongeometry mg m4 - m3 - m2 - m1 mg 61 – 20 – 30 – 10 1 mm
Tolerance on gap16Worst caseStatistical Dg D1 D2 D3 D 4 Dg2 D12 D22 D32 D42 0.1 0.3 0.3 0.2 0.9 mm mg Dg 0.1 to 1.9 mm (0.1)2 (0.3)2 (0.3)2 (0.2)2 0.23 Dg 0.5 mm mg Dg 0.5 to 1.5 mmPD Funkenbusch (ME 222/424)
Tolerance type vs. summation method17Tolerance dd D’s)All product withintoleranceSome product out oftolerance (generallysmall %)Statistical(add D2 ’s)Difficult to estimate(“depends”)Fraction in tolerancerelated to components’fraction in tolerancePD Funkenbusch (ME 222/424)
Complications18 Simple approach works well for a linear stacking of components asshown in the example. May not apply to: components with other “features” shape imperfections, roughness more complicated geometries 3-D, rotations properties other than length variability caused by other sources (e.g. environmental conditions) etc. As examples, variability in the output voltage of an electrical circuit because of differences incomponent properties (resistances, capacitances, etc.) and geometry/assembly variability in engine performance due to component wear, ambient temperature,fuel quality, etc.PD Funkenbusch (ME 222/424)
Approaches to dealing with more complex systems19 Modeling Need a good mathematical modelMay be able to solve analytically, depending on complexityAlternatively use the model to “test” different combinations ofcomponent /environment valuesMonte Carlo random sampling based on frequency of occurrence.Generally requires large numbers of samples (1,000s or 10,000s) must be practical with the model Various systematic approaches, e.g. Tolerance design Experimental Need to be able to identify and monitor or adjust sources ofvariabilityAnalyze data collected “in the field” is suitable data available? Systematic testing, e.g. Tolerance design PD Funkenbusch (ME 222/424)
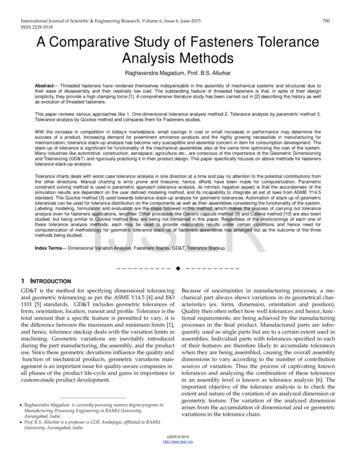
Random sampling (Monte Carlo) example20PtrabeculartcorticalD Simple model for axial loading of a long bone. [Thisis taken from a “Case Study” in Bartel, Davy, andKeaveny’s Orthopedic Biomechanics textbook.However, it is just an isostrain model for uniaxialcompression.]PD Funkenbusch (ME 222/424)
Random sampling (Monte Carlo) example21 The load supported on the cortical portion of the bone,Pc, is given by: Where P is the total applied load, t is the thickness of thecortical shell, D is the diameter of the trabecularcentrum, and Ec and Et are the modulus of the corticaland trabecular bone, respectively. Because of each of the terms in this equation will varyfrom person to person, the load on the cortical bone willalso vary.PD Funkenbusch (ME 222/424)
22 The table below gives some information on each of theparameters.ParameterAverage valueCoefficient of varianceP (N)1.5e320%Et (Pa)3.0e820%Ec (Pa)1.7e1010%t(m)3.5e425%D (m)3.0e-225% Average values (except for P) are taken from Bartel et al.and are nominally for vertebra. The rest of the values are“stand-ins” (more or less made up), just to illustrate.PD Funkenbusch (ME 222/424)
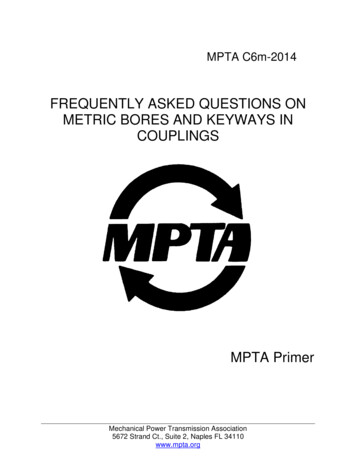
Results (different each time!)23Mean Square ErrorAverage1.20E 031.40E 051.20E 051.15E 031.10E 03MSE (N*N)Load (N)1.00E 051.05E 038.00E 046.00E 044.00E 041.00E 032.00E 049.50E 020.00E 00110PD Funkenbusch (ME 222/424)100N100010000110100N100010000
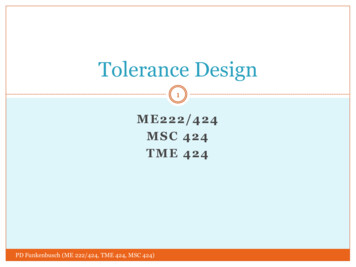
Compare with a tolerance design (8 TC)24MSE 7.09 e4Average 1.09 e31.20E 031.40E 051.20E 051.15E 031.10E 03MSE (N*N)Load (N)1.00E 051.05E 038.00E 046.00E 044.00E 041.00E 032.00E 049.50E 020.00E 00110PD Funkenbusch (ME 222/424)100N100010000110100N100010000
Tolerance Design25TOLERANCE AS VARIABILITYPD Funkenbusch (ME 222/424)
Taguchi’s approach to quality26 Genichi Taguchi (1924 – 2012) quality “guru”, responsible for many innovationsdeveloped many tools and methodsTolerance design was Taguchi’s last resort method for improvingquality Taguchi’s concept of quality Taguchi equated “quality” with reducing the variance (s2) in the finalproductDidn’t believe in using fixed “tolerances” (i.e. cutoff values)So Tolerance design focuses on reducing s2 , without considering %in/out of tolerance Can be applied to non-normal distributions, but need to be cautiousabout converting to a “D” and estimating % in tolerancePD Funkenbusch (ME 222/424)
Tolerance Design concept27 Assume that proportionality between variance incomponents and final (product) variance still holds, butwith a proportionality constant (sensitivity) added stotal2 h1s12 h2s22 h3 s32 h4 s42 Experiment estimate variance for the productdetermine contribution of each component variance to the total decide how to best improve tolerance (i.e. reduce variance) as neededh values show sensitivity of final product variance to tolerance(variance) of each component think about the units PD Funkenbusch (ME 222/424)
Tolerance design experiment28 For each component, inputspecific valuesTCmeasuredABC.response 1-1-1-1Y12-1-1 1Y23-1 1-1Y34-1 1 1Y4. 1-1-1 match variance of component(“levels” -1 , 1) m s Experiment tests differentcombinations of componentlevels Measure the response of theTC Treatment condition, one“run” of the experimentA, B, C different components-1, 1 represent two differentcomponent values to be used inexperimentationPD Funkenbusch (ME 222/424)product variation in these valuesprovides estimate of the totalproduct variance. also determinecontribution of eachcomponent to total
Matrix selection29 Design of matrix is important Design Of Experiments (DOE) Usually 2-level Can include other (non-component) sources Matrix size (# of TC) Between (n 1) and 2n n number of components Much smaller than Monte Carlo style methods Large matrix provides more/better data (rare) But smaller sizes are still useful (common)PD Funkenbusch (ME 222/424)
Example (Throttle handle) From “Designing experimentsfor tolerancing assembledproducts”, Soren Bisgaard.Technometrics (1997), 14215230 Components Friction in a throttle handleof outboard motors toomuch or too little need toimprove the tolerance Matrix size Tracked friction by measuringtorque to turn the handle Three components in theassemblyPD Funkenbusch (ME 222/424)Knob, handle, and tubeBut multiple dimensions onthe knob (three), and handle(three)Total of seven dimensions totolerance Minimum size 8Maximum size 128Chose to use 64 Relativelyconservative/expensive
Throttle handle (experimental details)31 Knobs (dimensions A, B, C) m - s and m s for each dimension Eight possible combinations Manufactured all eight combinations Handles (dimensions D, E, F) m - s and m s for each dimension Eight possible combinations Manufactured four of the combinations Tube (dimension G) Manufactured two tubes, one with m - s and one with m s Tested all combinations of these components 8 x 4 x 2 64 combinations 64 TC Treatment condition assembled one combination of components andmeasured torquePD Funkenbusch (ME 222/424)
Throttle handle (key results)Sources%AVariance(contrib.to 74G0.0040342.2550.52Total--677.46 100.004.3632 A, B, C knobdimensions D, E, F handledimensions G tube dimension G is main contributor tovariance ( 50%) Part tolerances(length)Variance of torque(force-length)2PD Funkenbusch (ME 222/424)Best bet to improveperformanceBut also depends onrelative costs
Throttle handle (predicting improvement)SourcesAVariance(contrib.to 3299.9533 Consider the effect ofhalving the tolerance (i.e.s) for G Variance of G (s2 ) will bereduced to ¼Contribution from G tototal with, therefore alsobe reduced to ¼Total Variance for thethrottle torque should bereduced to 421 PD Funkenbusch (ME 222/424)677 – ¾ (342) 421
Predictive equationSourcesAVariance(contrib.to 0.00400.0020--342.2585.56677.46420.77TotalPart tolerances(length)%7.0120.3299.95Variance of torque(force-length)2PD Funkenbusch (ME 222/424)34stotal2 hA sA2 hBsB2 hCsC2 h D s D2 hG sG2 contribution of G to total SSG 342.25 hG 342.25/ sG2 342.25/(0.0040) 2 2.14 x 10 7 Reduce sG to 0.0020SSG hG sG2 2 .14 x 10 7 x (0.0020) 2 85.56
Summary35 Definitions of tolerance Based on % in/out of toleranceAbsolute all in toleranceStatistical known % out of tolerance Summation of tolerances “worst-case” summation of tolerances“statistical” summation of the squares Tolerance design Based on reducing the product varianceAssumes product variance is proportional to component variancesDOE to estimate total product variance, component contributions,and the effects of changing component tolerancesPD Funkenbusch (ME 222/424)
Set tolerance so that only a small, specified fraction of components will be outside of the range. For simplicity here, we will assume that all distributions are normal. Examples: D 1 s 68.3 % in tolerance