Transcription
PCore Commercial Real Estate DebtAn “All Season” Strategic Investment Opportunity1
Executive SummaryMany institutional investors seeking to manage risk within their real estate allocations were historically limited to core equity strategieseither through funds, separate accounts, or direct ownership. This paper will explore private commercial mortgages, which haveconsistently delivered superior risk-adjusted returns relative to public stocks, bonds, and core equity real estate for more than threedecades (see section “Strategic Attributes of Core Commercial Real Estate Debt”). More recently, institutional investors have been ableto access the private commercial real estate (CRE) debt asset class through various investment vehicles. We believe that core CRE debtcould serve as both a compelling alternative, as well as a complement, to core real estate equity and other fixed income asset classes.Investors seeking stable income returns with a level of downside protection1 from real asset exposure should consider the merits of along-term strategic allocation to core CRE debt as it provides: An “All-season” investment strategy. Core CRE debt has delivered higher cash income returns than core CRE equity and otherfixed-income instruments such as investment-grade corporate bonds consistently across multiple market cycles (see section“Strategic Attributes of Core Commercial Real Estate Debt”). The two main contributing factors to these historical trends involvestructural protection and persistent borrower demand for first mortgage debt. As a result, core CRE debt emerged from the GlobalFinancial Crisis (GFC) relatively unscathed. More recently, the COVID-19 pandemic has again put core CRE debt to the test, andwhile the recession’s full impact is still unfolding, core CRE debt is demonstrating its resiliency.2 Exposure to a large addressable market. There are 4.7 trillion in U.S. commercial mortgage loans currently outstanding.3 Thesize of the market offers institutional investors the depth and liquidity required to match against their liabilities. Yet, the assetclass is often underrepresented in investors’ portfolios, largely due to a lack of appropriate investment channels. Low volatility, robust current income with downside protection. U.S. commercial mortgages have generated long-term incomereturns secured by a lien on the underlying commercial property and historically protected by equity subordination ofapproximately 30%.4 As a result, core CRE debt exhibits low volatility of income with historical default rates in line with investmentgrade commercial bonds over the past twenty years.5 The historical spread premium for core debt income averages 279 basispoints (bps) over the 10-year treasury for three decades versus only 17 basis bps for real estate equity cash income returns (seesection “Structured for Downside Protection”). Portfolio enhancement. U.S. commercial mortgage loans combine many of the positive aspects offered by both fixed income andcommercial real estate equity including inflation-hedged income returns, stable cashflows, principal protection backed by a hardasset, a deep investor pool, and enhanced diversification potential. This paper will show that adding commercial mortgage loansmay enhance portfolio construction whether as part of investors’ real estate portfolios or as their fixed income allocation. Duration and liquidity. The hold period for institutional core CRE equity investors is approximately 14 years on average.6 CoreCRE debt strategies can offer much shorter durations, allowing investors to pivot readily in response to shifting secular trends (seesection “Duration and Liquidity”). Relatively short duration investments also promote liquidity as investor capital is not locked upfor long periods and can be distributed or reinvested more frequently than longer duration ones.Increased capital into the space has encouraged many new entrants into the space. Given broader recognition of the portfolioenhancing benefits of core CRE debt, we expect continued investor inflows into the asset class. For first-time institutional investors,proper active management of a core CRE debt strategy is especially critical in the COVID-19 era as the pandemic has profoundly affectedrisk factors related to current and future real estate demand with important implications for loan underwriting.2
PContentsExecutive Summary . 2Defining Core Commercial Real Estate Debt . 4Strategic Attributes of Core Commercial Real Estate Debt . 6Conclusion . 113
Defining Core Commercial Real Estate DebtOverview of Commercial Real Estate Debt InvestmentPrivate CRE debt investment falls into two broad categories: senior and subordinated debt. Senior mortgages are secured by theunderlying property, and senior mortgage holders have priority as well as certain bankruptcy protections over those holdingsubordinated debt in the event of a default/liquidation. While loan structure is a critical determinant of senior mortgages, we believeproperty type, duration, and a sponsor’s business plan, and loan-to-value (LTV) are also important characteristics when assessing overallrisk and return. Subordinated debt is generally secured by a pledge of interest in the borrowing entity as opposed to the underlyingproperty itself.Within this categorization framework, senior and subordinated commercial real estate loans are further differentiated by leveragelevel, property type, duration, and sponsor business plan. Subject to prudent underwriting, these factors will determine the relativerisk and return profile of a debt investment whether senior or subordinated. “Cash Flowing” versus “Non-Cash Flowing” mezzaninedebt references the degree of tenant disruption associated with the planned property rehabilitation or redevelopment. Greaterdisruption should accompany higher debt costs to account for greater business plan risk. Construction loans (whether senior orsubordinated) involve significantly greater business plan risk due to the development process than loans on stabilized properties. Figure1 compares the key structural aspects of private CRE debt.Figure 1.Categories of Private CRE DebtReal Estate Debt Investment CategoriesLoan TypeRate TypeTypical Term(Years)Stabilized 65%Fixed/Floating7 Light Transition 70%Floating3 to 5Moderate Transitional 80%Floating3 to 5Cash Flowing Mezzanine50% to 85%Fixed/Floating3 to 10Non-Cash Flowing Mezzanine60% to 80%Fixed/Floating3 to 10Construction40% to 80%Floating1 to 5SubordinatedConstructionFor illustrative purposes only. Based on Ares’ view of the current market as of Q3 2020.4Core CRE DebtSeniorTypical Loan-toValue (LTV)
PCore Commercial Real Estate Debt CharacteristicsAs referenced in Figure 1, we believe that senior first mortgageloans on stabilized properties fall into the core risk profile whileconstruction loans and non-cash flowing mezzanine would beconsidered “non-core.” When categorizing senior mortgages onlight transitional and moderate transitional properties and cashflowing mezzanine loans, the definition of core can be somewhatfluid.This view is guided by the philosophy about the role core CREdebt should play in investors’ portfolios: real estate debt shouldbe a long-term strategic exposure that can withstand economicand market cycles, included highly stressed periods. Ourdefinition of “core” real estate debt encompasses: Senior mortgage loans. Senior mortgage loans have a firstlien on the underlying collateral and therefore offerinvestors the flexibility to rectify issues includingrestructuring of loan terms, obtaining additional equityfrom the borrower, and potentially foreclosure. This levelof flexibility is less available to subordinate debt holders. Stabilized Loan-to-Value (LTVs) 70%. During downturns,first mortgage loans, by nature of their seniority within thecapital stack, have greater structural protection than theborrower’s equity position. Considering that propertyvalues fell by 27% during the GFC – the most severe marketdownturn in recorded commercial real estate history, webelieve first mortgage loans with equity subordination of30% or greater at stabilization have a higher probability ofwithstanding future value corrections.7 Backed by institutional-quality assets. Underlyingcollateral should be suited to long-term institutionalownership with any disruption to property cash flows beingminimal and transient. Located in major metro areas with deep transactionalliquidity. Underlying property should be located within atop 30 metropolitan area, which have diversified andmature employment bases, stable demographic trends,and ample transactional liquidity. In our view, smaller,tertiary metro areas disproportionately experienceliquidity challenges during periods of dislocation andtherefore are not appropriate for a core CRE debt strategy.5
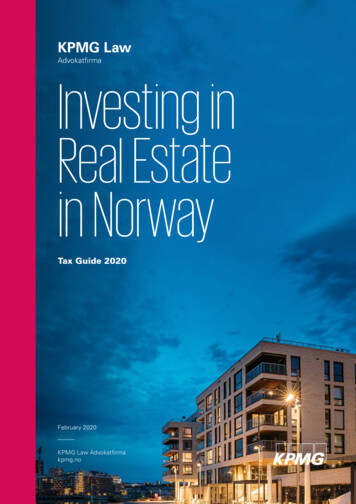
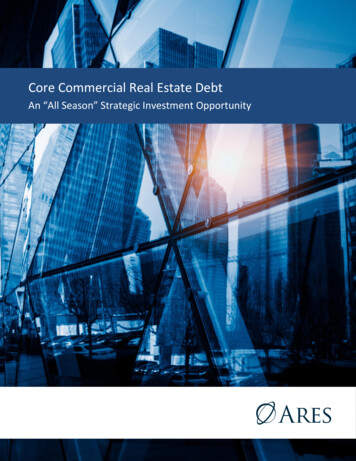
Strategic Attributes of Core Commercial Real Estate DebtCommercial Real Estate Debt is a Large, Investible MarketThere are 4.7 trillion of commercial mortgages outstanding inclusive of securitized mortgages, making it one of the largest fixed incomeasset classes.8 In terms of size, it sits between U.S. investment grade corporate bonds and municipal bonds (Figure 2). Given its size andlong history, we believe the U.S. commercial mortgage market can provide the level of depth, long-term liquidity, and price stabilityrequired for a long-lived strategic allocation. Yet, less than 10% of private mortgages are held by institutional9 investors pointing to anopportunity to address underserved borrower demand.Market Value of Outstanding ( trillions)Figure 2.Comparison of U.S. Fixed-Income Investment Asset Classes by Estimated Market Size as of Q1 edSecuritiesHigh YieldCorporateLeveraged LoanMarket0Publicly-HeldTreasury radeCorporateCommercialReal EstateDebtMunicipalBondsFor illustrative purposes only. Sources referenced include Department of the Treasury as of Q1 2020 for “Publicly-Held Treasury Debt”, Securities Industry and FinancialMarkets Association (SIFMA) and Federal Reserve as of Q1 2020 for “Residential Mortgage-Backed Securities”, SIFMA and S&P Global as of Q1 2020 for “InvestmentGrade Corporate”, Federal Reserve as of Q1 2020 for “Commercial Real Estate Debt”, SIFMA and Municipal Securities Rules-Making Board (MSRB) as of Q1 2020 for“Municipal Bonds”, SIFMA and S&P Global as of Q1 2020 for “High-Yield Corporate”, SIFMA as of Q4 2019 for “Asset-Backed Securities”, Bank for InternationalSettlements for “Leveraged Loans”. Please refer to section “Index Definitions” for additional information.Structured for Downside Protection, and Durable, Steady IncomeCore CRE debt has experienced very low default rates over the past 20 years due primarily to significant equity subordination, whichprovides principal protection10 even in the most volatile market periods.11 Core CRE debt loan-to-values have averaged 66% since 1990and 68% over the past 40 years, providing a 30% buffer against property value declines.12 The core property market has neverexperienced an aggregate value loss of greater than 30% as measured by the NCREIF market value index (MVI).13 The most severe pricedecline in the history of the NCREIF Property Index happened during the GFC when the index fell by 27%.14 Even during the extendedmarket downturn that spanned the back-to-back recessions of 1990 and 1991, the index declined by only 24%.15 While lenders willcontinue to experience the impact of economic downturns on their loan portfolios, we believe adherence to time-tested leverage levelswill continue to result in very low default rates and, in the unlikely event of a default, high recovery rates.Core CRE debt income returns exhibit less cyclicality than core CRE equity income returns (Figure 3). For core CRE equity income returns,we use the income return after deducting for routine capital expenditures – essentially a truer cash income return – for an “apples-toapples” comparison with core debt income returns. Importantly, the historical spread premium for core debt income is robust andstable, averaging 279 basis points (bps) over the 10-year treasury for three decades versus only 17 basis bps for real estate equitycash income returns (Figure 4).6
PFigure 3.Core CRE Debt Offers Capital Structure Seniority and Historically Higher Income Returns Relative to Equity as of Q2 2020Trailing 4Q Income Returns12%9%6%3%0%1990199219941996199820002002Core CRE Debt Income Return200420062008201020122014Core CRE Equity Income Return (After Cap Ex)2016201820201M LiborFor illustrative purposes only. Indices referenced include: the Giliberto-Levy Commercial Mortgage Performance Index as of Q2 2020 for “Core CRE Debt IncomeReturn”, the National Council of Real Estate Investment Fiduciaries (NCREIF) Property Index as of Q2 2020 for “Core CRE Equity Income Return (After Cap Ex)”, andthe ICE Benchmark Administration for “1M Libor”. Please refer to section “Index Definitions” for additional information.Figure 4.Core CRE Debt Income Returns Have Maintained a Higher Average Spread than Core CRE Equity as of Q2 2020Spread Over 10Y Treasury Yield (bps)600Average Spread of Core CRE DebtIncome Returns: 279 bps4002000Average Spread of Core CRE EquityIncome Returns: 17 2006Core CRE Equity Income Return (after Cap Ex)2008201020122014201620182020Core CRE Debt Income ReturnFor illustrative purposes only. Indices referenced include: the Giliberto-Levy Commercial Mortgage Performance Index as of Q2 2020 for “Core CRE Debt IncomeReturn”, the NCREIF Property Index as of Q2 2020 for “Core CRE Equity Income Return (after Cap Ex)”, and Federal Reserve as of Q2 2020 for “10Y Treasury Yields”.Please refer to section “Index Definitions” for additional information.7
We believe Core CRE Debt offers a deep investible asset class tied to an expanding universe of high-quality real estate properties withinformational transparency at the property-level. The asset class is also seasoned having emerged from each successive real estatedownturn since the 1980s with improved downside protection borne of improved underwriting discipline. 16 Delinquency rates ondirect core loans have averaged below 0.5% over the past 20 years and are 0.05% as of Q2 2020.17The risk-adjusted return profile of core CRE debt stands out when comparing against long-term historical performance of other assetclasses including public debt, public equity, and core equity real estate. This can be illustrated by the Sharpe Ratio (Figure 5), whichdivides the return of a portfolio over a risk-free rate (i.e. excess return) by the standard deviation of excess returns, one can see thatcore CRE debt has offered attractive risk-adjusted return performance relative to these asset classes since 1985 based upon theSharpe ratio.Figure 5.Comparison of Annual Risk and Return Across Asset Classes as of Q2 202012-month Trailing Total Returns60%40%20%0%(20%)(40%)1985 1987 1989 1991 1993 1995 1997 1999 2001 2003 2005 2007 2009 2011 2013 2015 2017 2019Public Investment-Grade DebtPublic EquitiesCore RE EquityCore RE DebtAverage Annual Returns and Risk (1985 – 2019)Public InvestmentGrade DebtPublic EquitiesCoreCRE EquityCoreCRE DebtAnnual Returns6.94%12.77%8.16%7.45%Annual Risk5.62%16.92%7.37%5.53%Sharpe Ratio0.7410.5670.6320.794For illustrative purposes only. Indices referenced include the Bloomberg Barclays Capital US Aggregate Bond Index as of Q2 2020 for “Public Investment-Grade Debt”,the S&P 500 Index as of Q2 2020 for “Public Equities”, the NCREIF Property Index as of Q2 2020 for “Core CRE Equity”, the Giliberto-Levy Commercial MortgagePerformance Index as of Q2 2020 for “Core CRE Debt”. Sharpe Ratio calculation uses 3-month T-bill yield as risk-free rate. Please refer to section “Index Definitions”for additional information.When the COVID-19 pandemic struck, it presented the most severe test ofcore CRE debt since the GFC. While the pandemic has been a unique, fastmoving market, core CRE debt has held up better than both stocks andcore CRE equity through the first half of 2020 based upon annual returnsas the table on the right illustrates. The public bond market benefiteddirectly from the massive amount of monetary stimulus the FederalReserve put forth early into the crisis as its trailing four quarter return of8.7% is well above its historical average of 5.7%.18Post-COVID-19 Total Return SnapshotYTD 2020 Q2Last 4QStocks-3.1%7.5%Bonds6.1%8.7%Core CRE Equity-0.3%2.7%Core CRE Debt3.3%5.6%Sources same as for “Average Annual Returns and Risk” table above.8
PA Complement to Core Commercial Real Estate EquityWe believe asset class diversification is one of the primary reasons why institutional investors allocate to CRE, encompassing both debtand equity. Most institutional investors who have had longstanding allocation to core CRE equity understand its diversification utility.However, most institutional investors tend not to be aware that an allocation to core CRE debt in addition to core CRE equity mayfurther enhance risk-adjusted mixed-asset portfolio returns especially through a market downturn.Figure 6.19A Hypothetical 5% Allocation to Core Debt Can Enhance Mixed-Asset Portfolio Performance Through a RecessionAllocationsReturn/Risk Ratio20Stocks60%All periodsBonds40%1.007Core CRE Equity0%DownturnsCore CRE Debt0%0.421AllocationsReturn/Risk RatioStocks54%All periodsBonds36%1.070Core CRE Equity10%DownturnsCore CRE Debt0%0.429AllocationsReturn/Risk RatioStocks54%All periodsBonds36%1.074Core CRE Equity5%DownturnsCore CRE Debt5%0.461Portfolio APortfolio BPortfolio CAllocating to coreCRE debt has shownto improve totalmixed-asset portfoliorisk-adjusted returnsthrough all periods ofour analysis, butespecially duringeconomic downturns.For illustrative purposes only. The results shown represent hypothetical backtests of historical index returns from Q1 1985 to Q2 2020. Indices referenced include theBloomberg Barclays US Aggregate Bond Index for “Bonds”, the S&P 500 for “Stocks”, the NFI-ODCE for “Private CRE Equity”, and the Giliberto-Levy Index CommercialMortgage Performance Index for “Private CRE Debt”. Downturns refer to recessions as defined by the National Bureau of Economic Research (NBER) plus four-quartersto account for the lagged nature of real estate values. The four quarters after each recession are added on because of the lagged nature of real estate values except forthe 2020 recession. Please refer to endnote 14 and section “Index Definitions” for additional information on the results shown.Figure 6 details the improvement in diversification that can occur by adding an allocation to core debt to a hypothetical portfolio ofstocks and bonds (Portfolio A) and a portfolio of stocks, bonds, and core CRE equity (Portfolio B) especially during market downturns.During recessions, the return/risk ratio for Portfolio C improves by 10% over Portfolio A (no real estate) and 8% over Portfolio B(allocation to core equity). Finally, over the entire historical period, Portfolio C demonstrates a higher return/risk ratio than either ofthe other two portfolios. While this theoretical framework illustrates the diversification benefits of commercial real estate exposure onpaper, institutional investors have realized this in practice and have steadily increased their allocation thresholds to the asset class overtime as a result.219
A Complement to Investment Grade Corporate BondsTo demonstrate a way that core CRE debt may enhance risk-adjusted returns, we constructed two hypothetical fixed income portfoliosillustrated below, one without an allocation to core CRE debt (left) and one with an allocation (right). Using historical returns over a 20year period, we illustrate how a 10% allocation of senior direct mortgages to a fixed income portfolio could improve risk-adjustedreturns by 21% (Figure 7). Construction of the hypothetical portfolios was made by Ares Real Estate Research using market data fromQ1 1998 to Q2 2020.Figure 7.22A 10% allocation to core CRE debt could enhance a fixed-income portfolio’s risk-adjusted return by 21%Fixed-income Portfolio w/o Core CRE Debt Adding a 10% Allocation to Core CRE Debt8%9%Core CREDebt8%20%10%9%18%11%10%33%37%14%13%U.S. TreasuriesInvestment-Grade CorporateHigh Yield CorporateResidential & Commercial Mortgage-Backed SecuritiesLeveraged LoansAsset-Backed SecuritiesU.S. TreasuriesInvestment-Grade CorporateHigh Yield CorporateResidential & Commercial Mortgage-Backed SecuritiesLeveraged LoansAsset-Backed SecuritiesCore CRE DebtPortfolio Key MetricsPortfolio Key MetricsAnnualized Returns: 5.27%Annualized Volatility: 3.75%Annualized Returns: 5.24%Annualized Volatility: 3.08%Return/Risk: 1.42Return/Risk: 1.70For illustrative purposes only. Construction of the hypothetical portfolios was made by Ares Real Estate Research using market data from Q1 1998 to Q2 2020. Thehypothetical back-tested results shown were derived from adding a hypothetical 10% allocation to core real estate debt to the hypothetical fixed income portfolio fromQ1 1998 to Q2 2020. Indices referenced include the Bloomberg Barclays US Treasury Index as of Q2 2020 for “U.S. Treasuries”, the ICE BofA US Corporate Index as of Q22020 for “Investment-Grade Corporate”), the ICE BofA US High Yield Index as of Q2 2020 for “High Yield Corporate”, the Bloomberg Barclays US CMBS Investment GradeIndex as of Q2 2020 for “Commercial Mortgage-Backed Securities”), the Bloomberg Barclays US MBS Index as Q2 2020 for “Residential Mortgage-Backed Securities”), theBloomberg Barclays US ABS Index as of Q2 2020 for “Asset-Backed Securities”, Credit Suisse Leveraged Loan Index as Q2 2020 for “Leveraged Loans”, and Giliberto-LevyCommercial Mortgage Performance Index as of Q2 2020 for “Core CRE Debt”. Please refer to endnote 17 and section “Index Definitions” for additional information on theresults shown.10
PDuration and LiquidityWe believe the secular tailwinds that informed real estate investment over the previous cycle are evolving in the aftermath of thedeepest recession of the postwar era brought about by the tragedy of the COVID-19 pandemic. Certain existing trends have beenaccelerated as in the case of e-commerce’s effect on industrial warehouse demand while other trends are reversing as in the case ofoffice space densification. Institutional investment in core equity real estate is characterized by long hold periods. In any given year,approximately 7% of the properties constituting the 696 billion NCREIF Property Index transact, meaning a core property trades aboutonce every 14 years on average.23 However, a core real estate debt strategy can invest across a much shorter duration as referenced inFigure 1, allowing for strategic pivots during major inflection points as we are currently seeing.We believe core CRE debt strategies may offer the liquidity required to make the asset class a strategic allocation. Since a core CRE debtstrategy should prioritize stability of income and downside protection24, we believe the asset class offers the liquidity investors need todynamically rebalance their exposure as dictated by their own mixed-asset portfolio needs.ConclusionCore real estate debt not only offers a tactical opportunity in the current environment but also presents strong merits for inclusionas a long-term, “all-season” strategic allocation in investors’ portfolios. Valued at 4.7 trillion25, we believe the U.S. commercialmortgage market asset class may offer institutional investors the depth and liquidity required to match against their liabilities. As aninvestment asset class, we believe commercial mortgage loans combine many of the positive aspects of both fixed income andcommercial real estate equity and may enhance portfolio diversification whether as part of an investor’s real estate allocation or aspart of an investor’s fixed income portfolio11
Legal Notice and DisclaimersThese materials are neither an offer to sell, nor the solicitation of an offer to purchase, any security, the offer and/or sale of which can only be made by definitive offering documentation. Anyoffer or solicitation with respect to any securities that may be issued by any investment vehicle (each, an “Ares Fund”) managed or sponsored by Ares Management LLC or any of its subsidiaryor other affiliated entities (collectively, “Ares Management”) will be made only by means of definitive offering memoranda, which will be provided to prospective investors and will containmaterial information that is not set forth herein, including risk factors relating to any such investment. Any such offering memoranda will supersede these materials and any other marketingmaterials (in whatever form) provided by Ares Management to prospective investors. In addition, these materials are not an offer to sell, or the solicitation of an offer to purchase securitiesof Ares Management Corporation (“Ares Corp”), the parent of Ares Management. An investment in Ares Corp is discrete from an investment in any fund directly or indirectly managed by AresCorp. Collectively, Ares Corp, its affiliated entities, and all underlying subsidiary entities shall be referred to as “Ares” unless specifically noted otherwise. Certain Ares Fund securities may beoffered through our affiliate, Ares Investor Services LLC (“AIS”), a broker-dealer registered with the SEC, and a member of FINRA and SIPC.In making a decision to invest in any securities of an Ares Fund, prospective investors should rely only on the offering memorandum for such securities and not on these materials, whichcontain preliminary information that is subject to change and that is not intended to be complete or to constitute all the information necessary to adequately evaluate the consequences ofinvesting in such securities. Ares makes no representation or warranty (express or implied) with respect to the information contained herein (including, without limitation, information obtainedfrom third parties) and expressly disclaims any and all liability based on or relating to the information contained in, or errors or omissions from, these materials; or based on or relating to therecipient’s use (or the use by any of its affiliates or representatives) of these materials; or any other written or oral communications transmitted to the recipient or any of its affiliates orrepresentatives in the course of its evaluation of Ares or any of its business activities. Ares undertakes no duty or obligation to update or revise the information contained in these materials.The recipient should conduct its own investigations and analyses of Ares and the relevant Ares Fund and the information set forth in these materials. Nothing in these materials should beconstrued as a recommendation to invest in any securities that may be issued by Ares Corp or an Ares Fund or as legal, accounting or tax advice. Before deciding to invest in any Ares Fund, aprospective investor should carefully review information respecting Ares and such Ares Fund and consult with its own legal, accounting, tax and other advisors in order to independently assessthe merits of such an investment.These materials are not intended for distribution to, or use by, any person or entity in any jurisdiction or country where such distribution or use would be contrary to law or regulation.These materials contain confidential and proprietary information, and their distribution or the divulgence of any of their contents to any person, other than the person to whom they wereoriginally delivered and such person's advisors, without the prior consent of Ares is prohibited. The recipient is advised that United States securities laws restrict any person who has material,nonpublic information about a company from purchasing or selling securities of such company (and options, warrants and rights relating thereto) and from communicating such informationto any other person under circumstances in which it is reasonably foreseeable that such person is likely to purchase or sell such securities. The recipient agrees not to purchase or sell suchsecurities in violation of any such laws, including of Ares Corp or a publicly traded Ares Fund.These materials may contain “forward-looking” information that is not purely historical in nature, and such information may include, among other things, projections, forecasts or estimatesof cash flows, yields or returns, scenario analyses and proposed or expected portfolio composition. The forward-looking information contained herein is based upon certain assumptions aboutfuture events or conditions and is intended only to illustrate hypothetical results under those assumptions (not all of which will be specified herein). Not all relevant events or conditions mayhave been considered in developing such assumptions. The success or achievement of various results and objectives is dependent upon a multitude of factors, many of which are beyond thecontrol of Ares. No representations are made as to the accuracy of such estimates or projections or that such projections will be realized. Actual events or conditions are unlikely to be consistentwith, and may differ materially from, those assumed. Prospective investors should not view the past performance of Ares as indicative of future results. Ares does not undertake any obligationto publicly update or review any forward-looking information, whether as a result of new information, future developments or otherwise.Some funds managed by Ares or its affiliates may be unregistered private investment par
Commercial Real Estate Debt is a Large, Investible Market There are 4.7 trillion of commercial mortgages outstanding inclusive of securitized mortgages, making it one of the largest fixed income asset classes. 8 In terms of size, it sits between U.S. investm