Transcription
catalystsArticleSynthesis of Three-Dimensionally OrderedMacroporous NiCe Catalysts for OxidativeDehydrogenation of Propane to PropeneKegong Fang 1, *,† ID , Lulu Liu 2,† , Mingwei Zhang 1 , Lu Zhao 1 , Juan Zhou 1 , Wenbin Li 1 ,Xiaoliang Mu 1 and Cheng Yang 3123*†State Key Laboratory of Coal Conversion, Institute of Coal Chemistry, Chinese Academy of Sciences,Taiyuan 030001, China; zmwsdust@126.com (M.Z.); zhaolu@sxicc.ac.cn (L.Z.);zhoujuan20091221@163.com (J.Z.); liwenbin@sxicc.ac.cn (W.L.); muxiaoliang 1986@163.com (X.M.)College of Environmental Engineering, Shanghai University, 333 Nanchen Road, Shanghai 200444, China;lululiu123@126.comCollege of Chemistry and Chemical Engineering, University of Jinan, Jinan 250022, China;chm yangch@ujn.edu.cnCorrespondence: kgfang@sxicc.ac.cn; Tel.: 86-351-406-4505These authors contributed equally to this work and should be considered as co-first authors.Received: 18 December 2017; Accepted: 8 January 2018; Published: 10 January 2018Abstract: Three-dimensionally ordered macroporous (3DOM) NiCe catalysts with different Ni/Cemolar ratio were fabricated using the colloidal crystal templating method. The physic-chemicalproperties of the samples were characterized by various techniques, including N2adsorption–desorption, X-ray diffraction (XRD), transmission electron microscopy (TEM),Raman, and H2 -temperature-programmed reduction (TPR) characterizations. The results revealedthat the 3DOM NiCe samples preserved the three-dimensionally ordered macroporous channelswith interlinked micro- or mesoporous structure and highly dispersed nickel oxide species inthe framework upon different amount of nickel incorporation. In the evaluation of the oxidativedehydrogenation (ODH) of propane, the 3DOM NiCe catalysts exhibited higher selectivity and yieldto propene than the amorphous NiCe catalyst. An optimum yield of propene of 11.9% with the30.3% propane conversion at 375 C was obtained over the 3DOM 2NiCe catalyst. Combining XRD,TPR, and Raman analysis, it could be found that the nickel incorporation in CeO2 lattice produced ahigh concentration of oxygen vacancies that were the active sites for the oxidative dehydrogenationof propane. Besides this, the 3DOM structure promoted the rapid diffusion of the reactants andproducts—favorable for the generation of propene in the ODH of propane.Keywords: three-dimensionally; macroporous; NiCe; oxidative dehydrogenation; propane; propene1. IntroductionThe synthesis of propene from oxidative dehydrogenation (ODH) of propane exhibits the virtueof favorable thermodynamics and less coke deposits compared with the traditional steam cracking ofnaphtha or direct dehydrogenation of propane, becoming one of the routes with the most potentialto produce value-added unsaturated hydrocarbon chemicals [1,2]. In this process, vanadium andmolybdenum-based catalysts are commonly used for the selective catalytic production of propene [3–5].However, these catalysts are usually conducted at relatively higher temperatures (above 500 C), whichcause the occurrence of undesirable combustion and then restrain propene formation. In the past fewdecades, great efforts have been dedicated to the improvement of vanadium and molybdenum-basedODH catalysts for highly preferable alkene yield [6–10], but propane conversion was normallyCatalysts 2018, 8, 19; ysts
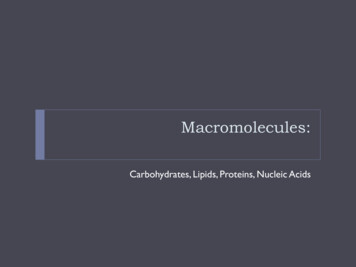
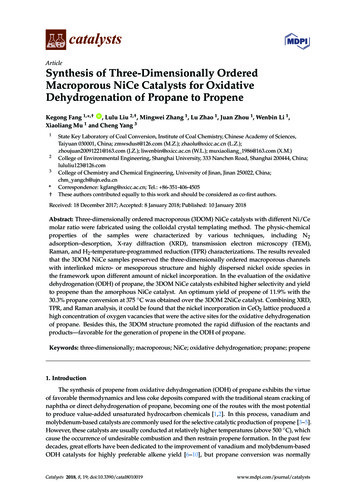
Catalysts 2018, 8, 192 of 12unsatisfactory at the lower temperature of 400 C using the catalysts above. Further studies are stillrequired to develop highly active catalysts used under the mild reaction conditions in the ODH process.In recent years, cerium-based materials doped with transition metal oxides (e.g., Nb2 O3 , NiO)have been reported to favor the redox cycle in catalytic oxidation reactions by means of promoting theformation of anionic vacancies and surface oxygen species [11–14]. L. J. Duhamel [11] reported thatCeNi0.5 OY catalyst could form cerium-nickel solid solution or interface of NiO/CeO2 , which presentedmany interaction sites between Ce and Ni cations, favorable for the good activation and selectivity inthe oxidative dehydrogenation of propane under the mild temperature of ca. 350 C. Liu et al. [13]obtained a high yield of propene over Ni-Ce-O catalysts prepared by the gel-precipitation of oxalateprecursor, and suggested that the highly dispersed nickel oxides contributed to the selective formationof propene in the ODH of propane. Despite the above advances, their practical application still remainsparticularly challenging. Due to the poor heat conductivity of the above Ni-Ce composite oxidecatalysts, the strong exothermicity of the ODH reaction process may unavoidably induce hotspots inthe reactor bed, which causes the catalyst’s deactivation and restriction in industrial applications [15].Therefore, it is worthwhile to pursue a catalyst that combines excellent catalytic performance withenhanced thermal conductivity and mass diffusion.Recently, three-dimensional ordered macroporous (3DOM) materials have shown much benefit inuse as catalysts, separation adsorbents, and photonic crystals [16,17]. These materials have a structurewith regular large pore size and coadjacent macroporous channels with high approachable surfacearea, which ensure abundant exposure to the reactants. On the other hand, the three-dimensionaltransfixion pore structure is also beneficial to mass diffusion and improves the catalytic activity [18–23].For example, Au embedded onto 3DOM CeO2 exhibited excellent catalytic activity/selectivity informaldehyde oxidation [24,25]. Using the beneficial features of 3DOM CeO2 , another study reportedthat the structured catalysts exhibit efficient heat/mass transfer with excellent activity, selectivity, andstability for the catalytic oxidation of methane to syngas [23].However, to our best knowledge, few researchers have reported about the catalytic properties ofthree-dimensionally structured NiCe mixed oxides with ordered macroporous channels in the ODHreaction. Therefore, in the present research, we prepared 3DOM NiCe catalysts with different nickelloading by the assembly of the colloidal crystal template. The resulting catalysts were systematicallycharacterized and evaluated in the ODH of propane for the purpose of understanding the effectof the nickel introduction on ODH activity of 3DOM CeO2 -doped Ni catalysts with respect to themodification of structure and redox properties.2. Results and Discussion2.1. Morphology and StructureThe N2 adsorption–desorption isotherms and the textural properties of 3DOM NiCe mixed oxidessamples are given in Figure 1 and Table 1. The isotherms of all samples exhibit type IV adsorptionisotherm patterns, which demonstrate the presence of the mesostructure. The 3DOM NiCe samplesdisplayed a steep capillary condensation step at relatively higher pressures with H3-type hysteresisloops, suggesting the existence of the large mesoporous channel structure with a narrow range ofsizes. The pure CeO2 and 2NiCe samples had H4 hysteresis loops, indicative of small channel-likemesopores in a broad range of sizes. Table 1 lists the detailed mesoporous sizes of the samples, whichare consistent with N2 sorption isotherm analysis. Meanwhile, almost linear isotherms could beseen in the low-pressure portion for 3DOM NiCe samples, characteristic of the unrestrained monoor multilayer adsorption in macroporous structures [26]. From the pore-size distribution curves(Figure 1B) of these samples, it could be seen that the nanopore sizes of samples were dominantlydistributed in the range of 2.5–4.5 nm with a peak value at 3 nm. The second pores were mainlydistributed between 7 nm and 70 nm. The Brunauer–Emmett–Teller (BET) surface areas of the 3DOMNiCe samples ranged from 29 m2 /g to 76 m2 /g with the pore volume of 0.08–0.26 cm3 /g—larger
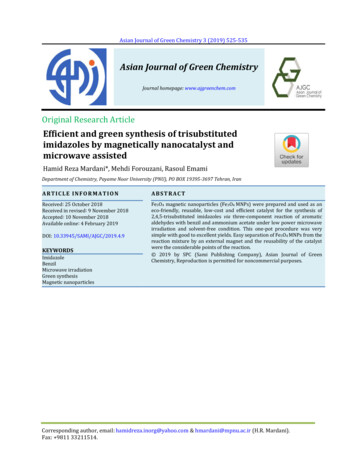
Catalysts 2018, 8, 193 of 12Catalysts 2018, 8, 193 of 12m2 /gcm3 /g)than those (13.8and 0.06of the nonporous bulk NiCe sample. It could be tionofreactantmoleculesdemonstrated ample pore structures, which might contribute to the adsorption of reactant )NN2 adsorption‐desorption isomers of a–f: three‐dimensional ordered macroporousFigure2 adsorption-desorption isomers of a–f: three-dimensional ordered 2NiCeandand(B)(B)(3DOM)CeO(3DOM) CeO2 , 3DOM s3DOMCeO, eO2 , NiCe,a . leparametersofofthesamplesCrystallite Size from XRD (nm)SamplesCrystallite Size from XRD (nm)SBET (m2g 1) Dp (nm) VP (cm3g 1)CeO2 (111)NiO (200)SBET (m2 g 1 )Dp (nm)SamplesVP (cm3 g 1 )NiO (200) ‐3DOM CeOCeO229.26.80.082 (111) 12.83DOM0.2NiCe9.7‐34.19.00.113DOM CeO212.829.26.80.083DOM 0.5NiCe 9.79.214.811.00.150.113DOM 0.2NiCe34.1 37.39.03DOM 2NiCe 9.29.019.10.240.153DOM 0.5NiCe14.8 16.937.3 41.611.03DOM 2NiCe16.9 12.941.6 76.0419.13DOM 5NiCe 9.08.89.60.260.243DOM iCe3DOM NiO 10.617.913.87.4‐1549.1715.40.210.063DOM aNiO1549.1715.40.21SBET: Brunauer–Emmett–Teller (BET) surface area; Dp: pore diameter; VP: pore volume.aSBET : Brunauer–Emmett–Teller (BET) surface area; Dp : pore diameter; VP : pore volume.2.2. TEM Images2.2. TEMImagesFigure2 shows the transmission electron microscopy (TEM) and high resolution TEM (HRTEM)imagesof thesamples.Apparently, electronthe samplesdisplayedmacroporouschannels withFigure2 showsthe transmissionmicroscopy(TEM)and high resolutionTEMoverlapped(HRTEM)porousofstructure.As shownin Figurethemacroporediameter sizesof 3DOMcatalystsimagesthe roporouschannelswithNiCeoverlappedwereabout190 wswitha size ofporous structure. As shown in Figure 2a1–e1, the macropore diameter sizes of 3DOM NiCe catalysts60 about10 nm.190The HRTEMimagesrevealedthe presenceof athroughnanoporouswall,with nanoporesizesofofwere10 nm, andsomevoids wereinterlinkedhollowwindowswith a sizeforThetheHRTEMcatalysts.This revealedimplied thatthe macroporouswalls consistedclosely packed605–10 10nmnm.imagesthe presenceof a nanoporouswall, Ceof 5–10 nm for the catalysts. This implied that the macroporous walls consisted of closely packedsamples causedthe increasestructure.of the surfacearea, favorablefor the reactantabsorptionactivationmicroporousor mesoporousThe existenceof nano-poresin the skeletonsof atticefringeswithawidthof0.3,0.19,and0.27nmsamples caused the increase of the surface area, favorable for the reactant absorption and activationindexed asThe(111),(220), and(200)alsoplanesof CeOlattice2, and of0.26, 0.22,0.24 geswithanda widthof 0.3,0.19, asand0.27(200),nmand (111)planes(220),of iceofceriumindexedas (111),andrespectively.(200) planes ,2and nickel oxides.
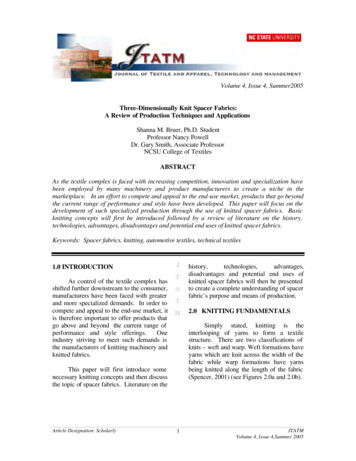
Catalysts 2018, 8, 194 of 12and (111) planes of NiO, respectively. This indicated the co-existence of the crystal lattice of ceriumCatalystsoxides.2018, 8, 194 of 12and nickelFigureTheTEMTEM (left)(left) and(middleand right)imagesimagesof the as‐prepared3DOM nickel‐Figure2. 2.TheandHRTEMHRTEM(middleand right)of the as-prepared3DOMcerium samples: a1–a3 3DOM CeO2; b1–b3 3DOM 0.2NiCe; c1–c3 3DOM 0.5NiCe; d1–d3 3DOMnickel-cerium samples: a1–a3 3DOM CeO2 ; b1–b3 3DOM 0.2NiCe; c1–c3 3DOM 0.5NiCe; d1–d32NiCe; e1–e3 3DOM 5NiCe; and f1–f3 2NiCe.3DOM 2NiCe; e1–e3 3DOM 5NiCe; and f1–f3 2NiCe.2.3. Powder X‐ray Diffraction2.3. Powder X-ray DiffractionFigure 3 gives the diffraction patterns obtained with different 3DOM NiCe and 2NiCe catalysts.Only twocrystallites—NiOand CeO2—wereobserved,thoughthe degreeof NiCecrystallinityof the catalysts.twoFigure3 givesthe diffractionpatternsobtainedwithdifferent3DOMand 2NiCestrongly dependedandon theNi/Ceratio.observed,NiO diffractionlinesfor 3DOM 0.2NiCeOnlyphasestwo crystallites—NiOCeOthoughthedisappeareddegree of crystallinityof the two2 —werecatalyst,indicatingthe isomorphicsubstitutionor highdispersionof nickeloxides onthesurface0.2NiCeofphasesstronglydependedon the Ni/Ceratio. couldbeseenfromcatalyst, indicating the isomorphic substitution or high dispersion of nickel oxides on the surface ofX‐ray diffraction (XRD). The broadness of the cerium peaks and the change of their position with thecerium oxides. Upon further increasing the NiO content,2 the bulk NiO phasecould be seen fromaddition of nickel were observed, suggesting that partial Ni cations replaced Ce4 cations in the CeO2X-raylattice.diffraction(XRD). The broadness of the cerium peaks and the change of their position with theConsidering the smaller size of nickel ionic radius (Ni2 : 0.07 nm) compared to that of ceriumaddition of nickel were observed, suggesting that partial Ni2 cations replaced Ce4 cations in the
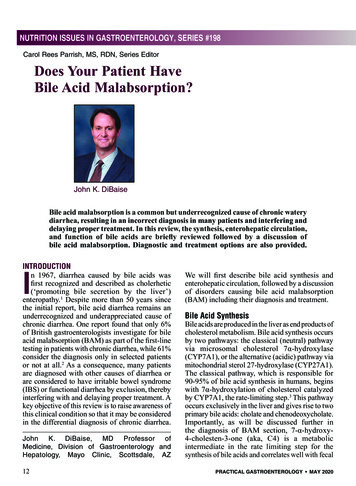
ionic radius (Ce4 : 0.09 nm) [28], the above result could imply the generation of cerium‐nickel solidsolution, as reported in the literature [29].The crystallite size could be calculated by the Scherrer formula based on the (200) and (111)characteristic XRD peaks of NiO and CeO2, respectively. From the concrete data listed in Table 1,Catalysts2018,8, 19 oxides showed the smaller crystal sizes of NiO and CeO2 than those of the corresponding5 of 12NiCemixedpure oxides, which confirmed that the incorporation of NiO in CeO2 inhibited the growth of crystalparticles. Additionally, the particle size of NiO and CeO2 in 3DOMNiCe mixed oxides wereCeO2respectivelylattice. i2 : 0.07compared bulkto that ofin the m)the amorphous4 : 0.09 nm) [28], the above result could imply the generation of cerium-nickelceriumionicradius(CeNiCesamplenm and 10.6 nm), indicating that NiO and CeO2 were well dispersed in the 3DOMCatalysts2018, 8, (17.9195 of 12solidNiCesolution,reported in the literature [29].mixedasoxides.ionic radius (Ce4 : 0.09 nm) [28], the above result could imply the generation of cerium‐nickel solidsolution, as reported in the literature [29].The crystallite size could be calculated by the Scherrer formula based on the (200) and (111)characteristic XRD peaks of NiO and CeO2, respectively. From the concrete data listed in Table 1,NiCe mixed oxides showed the smaller crystal sizes of NiO and CeO2 than those of the correspondingpure oxides, which confirmed that the incorporation of NiO in CeO2 inhibited the growth of crystalparticles. Additionally, the particle size of NiO and CeO2 in 3DOM NiCe mixed oxides wererespectively in the ranges of 12.9–16.9 nm and 8.8–9.7 nm—less than those of the amorphous bulkNiCe sample (17.9 nm and 10.6 nm), indicating that NiO and CeO2 were well dispersed in the 3DOMNiCe mixed oxides.Figure 3. The X‐ray diffraction (XRD) patterns of different catalysts.Figure 3. The X-ray diffraction (XRD) patterns of different catalysts.2.4. Raman SpectraThe crystallite size could be calculated by the Scherrer formula based on the (200) and (111)The Raman spectra of 3DOM NiCe and 2NiCe catalysts are shown in Figure 4. For comparison,characteristic XRD peaks of NiO and CeO2 , respectively. From the concrete data listed in Table 1, NiCethe spectra of pure compounds of CeO2 and NiO were also demonstrated. The strong bandmixedoxides showed the smaller crystal sizes of NiO and CeO2 thanthose of the corresponding puredesignated to F2g mode was examined at 462 cm 1 for pure CeO2 [30]. Pure NiO showed a OinCeOinhibitedgrowthof[31,32].crystal particles. 12 stretching theabsorption peak centered at 503 cm , characteristic of the Ni‐Omodein NiOAdditionally, the particle size of NiO and CeO2 in 3DOM NiCe mixed oxides were respectively in theranges of 12.9–16.9 nm and 8.8–9.7 nm—less than those of the amorphous bulk NiCe sample (17.9 nmand 10.6 nm), indicating that NiO and CeO2 were well dispersed in the 3DOM NiCe mixed oxides.Figure 3. The X‐ray diffraction (XRD) patterns of different catalysts.2.4. Raman Spectra2.4. Raman SpectraThe Raman spectra of 3DOM NiCe and 2NiCe catalysts are shown in Figure 4. For comparison,The Raman spectra of 3DOM NiCe and 2NiCe catalysts are shown in Figure 4. For comparison,the spectra of pure compounds of CeO2 and NiO were also demonstrated. The strong band designatedthe spectra of pure compounds of CeO2 and NiO were also demonstrated. The strong bandto F2gdesignatedmode wastoexamined462examinedcm 1 foratpureCeO[30].Pureshowed a broad absorption peak 1 2F2g mode atwas462 cmforpureCeONiO2 [30]. Pure NiO showed a broad 1 , characteristic of the Ni-O stretching mode in NiO [31,32].centeredat503cm 1absorption peak centered at 503 cm , characteristic of the Ni‐O stretching mode in NiO [31,32].Figure 4. Raman spectra of the samples.Figure 4. Raman spectra of the samples.Figure 4. Raman spectra of the samples.
Catalysts 2018,2018,8,8,1919Catalystsof121266ofIt could be seen that the intensity of the Ni‐O stretching band decreased and the band associatedIt could be seen that the intensity of the Ni-O stretching band decreased and the band associatedwith CeO2 phase slightly shifted to lower frequencies with the increasing incorporation of Ni amountwith CeO2 phase slightly shifted to lower frequencies with the increasing incorporation of Ni amountfor the 3DOM NiCe and 2NiCe samples. Such spectral changes were probably due to the similarfor the 3DOM NiCe and 2NiCe samples. Such spectral changes were probably due to the similarisomorphous replacement of Ni2 2 into the CeO lattice as revealed by Solsona [33]. Note that threeisomorphous replacement of Ni into the CeO lattice as revealed by Solsona [33]. Note that threebands at 224, 592, and 628 cm 1 1were obviously observed in the 3DOM NiCe catalysts, suggesting thatbands at 224, 592, and 628 cm were obviously observed in the 3DOM NiCe catalysts, suggesting thatfurther modification of the oxygen sublattice occurred and then promoted the formation of oxygenfurther modification of the oxygen sublattice occurred and then promoted the formation of oxygenvacancies in CeO2 lattice as reported in the previous literature [30].vacancies in CeO2 lattice as reported in the previous literature [30].2.5.2.5. Temperature‐ProgrammedTemperature-Programmed reduction (TPR)The reducibilityreducibility ofof thethe samplessamples waswas studiedstudied byby H2 -temperature-programmed reduction reductioncurvewithtwo(see Figure 5). Pure 3DOM NiO sample presented a broad reduction curve with two maximamaxima atat 432432and516 dthebulknickelspeciesinthe and 516 C, in accordance with the reduction of the surface nickel and the bulk nickel species in theframeworkframework ofof 3DOM3DOM structure,structure, respectively.respectively. FromFrom thethe GaussGauss deconvolutiondeconvolution ofof thethe rethree main reduction peaks (denoted T1, T2, and T3) could be seen in the temperature rangerange ofof 100100to700 1)ataround308 Ccould to 700 C for 3DOM Ni-Ce mixed oxides. The first reduction peak (T1) at around 308 C could bebe4 by Ni2 into CeO2 lattice [34]. Due to this, unbalanced chargeattributedCe4 attributed toto thethe replacementreplacement ofof Ceby Ni2 into CeO2 lattice [34]. Due to this, unbalanced chargedistortionthe Ni-O-CeNi‐O‐Ce med.AsAsa on occurred;occurred; nincorporation ofof NiNi atoms.atoms. SuchoxygenvacancieswasgeneratedSuch oxygenoxygen2vacanciesparticipate inin thethe ancies couldcould nts.form the active oxygen species. This coincided with the above XRD and Raman measurements. TheseThesereactivebe reducedat low temperature,favorablefor enhancingthereactiveoxygenoxygenspeciesspeciescan be canreducedeasily ateasilylow temperature,favorablefor enhancingthe ondreductionpeak(T2)centeredat370–410 Cfortheperformance of the catalysts. The second reduction peak (T2) centered at 370–410 C for the 3DOM3DOM0.2–5NiCebe assignedto the reductionof thehighly dispersedNiOspecies0.2–5NiCesamplessamplescould becouldassignedto the reductionof the highlydispersedNiO tructure.TheT3peakinthe440–490 Ctemperaturerange the surface layer of the 3DOM structure. The T3 peak in the 440–490 C temperature range uctionpeakofbulkNiOinthe3DOMframeworkasidentified as the high-temperature reduction peak of bulk NiO in the 3DOM framework as well aswell as some strongly interacting nickel‐cerium oxides. As for the 2NiCe sample, T1–T3 peakssome strongly interacting nickel-cerium oxides. As for the 2NiCe sample, T1–T3 peaks correspondedcorresponded to the reduction of surface active oxygen species adsorbed over oxygen vacancies,to the reduction of surface active oxygen species adsorbed over oxygen vacancies, crystalline and Nicrystalline and Ni cations with a strong interaction with ceria, respectively [35].cations with a strong interaction with ceria, respectively [35].Figure 5. The H2 -temperature-programmed reduction (TPR) patterns of the samples: (a) 3DOM CeO2 ;Figure 5. The H2‐temperature‐programmed reduction (TPR) patterns of the samples: (a) 3DOM CeO2;(b) 3DOM 0.2NiCe; (c) 3DOM 2NiCe; (d) 3DOM 5NiCe; (e) 2NiCe, (f) 3DOM NiO.(b) 3DOM 0.2NiCe; (c) 3DOM 2NiCe; (d) 3DOM 5NiCe; (e) 2NiCe, (f) 3DOM NiO. C in thePure 3DOM3DOM CeOpeakcenteredat 564PureCeO22 showedshowed ductionreductionpeakcenteredat 564 C ininvestigatedtemperaturerange,correlatedwith thereductionof the e,correlatedwiththe reductionof the ceria.surfaceceria.onBasedonprevious reports [33], the bulk ceria should be reduced by hydrogen above 700 C; therefore, its
Catalysts 2018, 8, 197 of 12reports [33], the bulk ceria should be reduced by hydrogen above 700 C; therefore, its reduction peakcould not be observed in the present study. The reduction peak of the surface Ce-species for the NiCecatalysts were almost invisible, possibly due to such above surface reduction peak being overlappedby the more intense TPR profile of nickel species.From the quantitative H2 consumption amount of the samples listed in Table 2, the pure3DOM NiO showed the largest amount of H2 uptake (13.3 mmol·g 1 ), close to the theoreticalvalue (13.4 mmol·g 1 ). By contrast, the lowest amount of H2 consumption (2.7 mmol·g 1 ) overthe 3DOM CeO2 sample could be observed, which is far below the chemical stoichiometric amountof 11.6 mmol·g 1 . This indicated the nearly complete reduction of 3DOM NiO, while only a smallnumber of CeO2 species could be reduced, coinciding with the above discussion. For 3DOM NiCesamples, H2 consumption amounts corresponding to the T1 peak was very small, and no obviousvariation occurred with the change of Ni/Ce ratio due to the relatively smaller amount of nickelcations incorporated in the CeO2 lattice. The major H2 uptake of T2 and T3 peaks was attributedto the reduction of surface and bulk nickel species that increased with the augment of the nickelamount—especially the T3 peak. This suggested that a greater proportion of bulk nickel speciesformed at higher nickel loading. Combining the TPR patterns (see Figure 5), it could also be seen thatthe main reduction maximum of the T2 peak generally shifted to higher temperature upon increasingNi/Ce ratio from 0.2 to 2, and then moved to lower temperature after further enhancing the amountof nickel. This result might indicate that the reducibility of surface nickel oxide species displayeda decreasing trend during the change of the Ni/Ce ratio range from 0.2–2 and then went up at aNi/Ce ratio of 5. The T3 reduction peak gradually shifted to higher temperature, probably due tothe highly dispersed NiO or Ni-Ce solid solution produced on CeO2 co-exist as reported by formerresearchers [35,36]. In terms of amorphous 2NiCe and 3DOM counterpart, the former presented aslightly greater H2 uptake and lower reduction maximum temperature, implying that the NiCe samplecould be easily reduced without 3DOM structure.Table 2. Hydrogen consumption of the temperature-programmed reduction (TPR) peaks for thevarious samples.SamplesH2 Consumption (mmol·g 1 )T1 PeakT2 PeakT3 PeakCeO2 81.91.1-0.20.52.73DOM NiO2NiCe3DOM 5NiCe3DOM 2NiCe3DOM 0.5NiCe3DOM 0.2NiCe3DOM CeO2Total Amount of H2Consumption (mmol·g 1 )13.38.09.97.84.83.52.72.6. Catalytic PerformanceTable 3 lists the catalytic performance of the catalysts. The pure CeO2 had the lowest propaneconversion, and the products were mainly CO2 . For the 3DOM NiCe samples, the Ni/Ce ratio exerted agreat effect on the catalytic performances in the oxidative dehydrogenation of propane. The conversionof propane increased from 26.2% to 34.6% when the Ni/Ce ratio rose from 0.2 to 5. The selectivity ofpropene increased from 28.8% to 39.4% when the Ni/Ce ratio increased from 0.2 to 2. Upon furtherincreasing the Ni/Ce ratio up to 5, a sharp decrease of propene selectivity could be observed overthe 3DOM 5NiCe sample. Although 3DOM 2NiCe catalyst showed moderate propane conversion,it gave the best propene yield of 11.9%. The distinct differences among the 3DOM NiCe and 2NiCesamples can be seen in Table 3. Compared with the 3DOM samples, the selectivity of propene over thenonporous 2NiCe catalyst was much lower, whereas the conversion of propane was higher than theformer samples due to the greater degree of methane and CO2 formation.
e 3. Catalytic performance of the catalysts for the oxidative dehydrogenation (ODH) of propaneTable 3. Catalytic performance of the catalysts for the oxidative dehydrogenation (ODH)of propaneat temperature 375 C,gaseous hourly space velocity (GHSV) 15,000 mL (g h) 1, molar ratio ofat temperature 375 C, gaseous hourly space velocity (GHSV) 15,000 mL (g h) 1 , molar ratio ofN2:C3H8:O2 8:1:1.N2 :C3 H8 :O2 8:1:1.Selectivity (%)SamplesPropane Conversion (%)Propene Yield (%)Selectivity(%) aPropeneCO2 CrackSamplesPropane Conversion (%)Propene Yield (%)2NiCe36.00.192.57.40.04PropeneCO2Crack a3DOM 5NiCe34.60.297.72.10.062NiCe36.00.192.57.40.043DOM 2NiCe30.339.457.23.411.93DOM 5NiCe34.60.297.72.10.063DOM0.5NiCe27.338.357.34.4 3.410.5 7 4.47.55 10.53DOM0.5NiCe27.338.357.37.222.976.80.3 1.71.65 7.553DOMCeO23DOM0.2NiCe26.228.869.5a cracking 7.23DOM CeO222.976.8 and ethane.0.31.65products such as methane,ethylene,acracking products such as methane, ethylene, and ethane.Considering the best catalytic performance of 3DOM 2NiCe catalyst listed in Table 3, ormanceperformance ofof3DOM3DOM2NiCe2NiCecatalystcatalyst listedand itsConsideringthe bestin amorphousTable 3, wecounterpart2NiCe sampleunder thedifferent reactiontemperaturesin theandODHpropaneintensively ofinvestigatedthe catalyticperformanceof 3DOM2NiCe catalystits Cesample,propaneconversionincreasedcounterpart of 2NiCe sample under the different reaction temperatures in the ODH of propane reactionmonotonouslymuchlower propeneyield duringthe conversionincreasing temperaturecourse. Propene(see Figure 6). withFor theamorphous2NiCe sample,propaneincreased h lower propene yield during the increasing temperature course. Propene was the main reatexpenseofpropeneformationwhenthewith little CO2 produced at the initial stage of the reaction. However, CO2 selectivity sharply enhancedtemperaturerose320 expense C, indicatingthat thecombustionof propanemainly occurredat higherup to ca. 70%at abovethe greatof propeneformationwhenthe temperaturerose above320 C,temperature.Similarto the amorphous2NiCemainlysample,occurredthe 3DOMdemonstratedindicating thatthe combustionof propaneat 2NiCehighercatalysttemperature.Similarlowerto thepropaneconversionand propeneyield buthigherpropeneselectivity belowreactiontemperatureamorphous2NiCe sample,
catalysts Article Synthesis of Three-Dimensionally Ordered Macroporous NiCe Catalysts for Oxidative Dehydrogenation of Propane to Propene Kegong Fang 1,*,† ID, Lulu Liu 2,†, Mingwei Zhang 1, Lu Zhao 1, Juan Zhou 1, Wenbin Li 1, Xiaoliang Mu 1 and Cheng Yang 3 1 State Key Laboratory of Coal Conversion, Inst