Transcription
CHAPTER 2AuditionJOSH H. MCDERMOTTchallenges of everyday audition are reflectedin the gap between biological and machinehearing systems—machine systems forinterpreting sound currently fall short ofhuman abilities. At present, smart phonesand other machine systems recognize speechreasonably well in quiet conditions, but ina noisy restaurant they are all but useless.Understanding the basis of our success inperceiving sound will hopefully help us toreplicate it in machine systems and restoreit in biological auditory systems when theirfunction becomes impaired.The goal of this chapter is to provide abird’s-eye view of contemporary hearingresearch. The chapter is an updated versionof one I wrote a few years ago (McDermott,2013). I provide brief overviews of classicareas of research as well as some centralthemes and advances from the past 10 years.The first section describes the sensory transduction of the cochlea. The second sectiondiscusses modulation and its measurement bysubcortical and cortical regions of the auditory system, a key research focus of the lastfew decades. The third and fourth sectionsdescribe some of what is known about theprimary and nonprimary auditory cortex,respectively. The fifth section discussesthe perception of sound source properties,INTRODUCTIONSound is created when matter in the worldvibrates and takes the form of pressure wavesthat propagate through the air, containingclues about the environment around us.Audition is the process by which organismsutilize these clues to derive information aboutthe world.Audition is a crucial sense for most animals. Humans use sound to infer a vastnumber of important things—what someone said, their emotional state when theysaid it, and the whereabouts and nature ofobjects we cannot see, to name but a few.When hearing is impaired (via congenitalconditions, noise exposure, or aging), theconsequences can be devastating, such thata large industry is devoted to the design ofprosthetic hearing devices.As listeners, we are largely unaware of thecomputations underlying our auditory system’s success, but they represent an impressive feat of engineering. The computationalThis chapter is an updated version of a chapter writtenfor The Oxford Handbook of Cognitive Neuroscience.I thank Dana Boebinger, Alex Kell, Wiktor Mlynarski,and Kevin Woods for helpful comments on earlier draftsof this chapter. Supported by a McDonnell ScholarAward and a National Science Foundation CAREERAward.Stevens’ Handbook of Experimental Psychology and Cognitive Neuroscience, Fourth Edition, edited by John T. Wixted.Copyright 2018 John Wiley & Sons, Inc.DOI: 10.1002/9781119170174.epcn2021
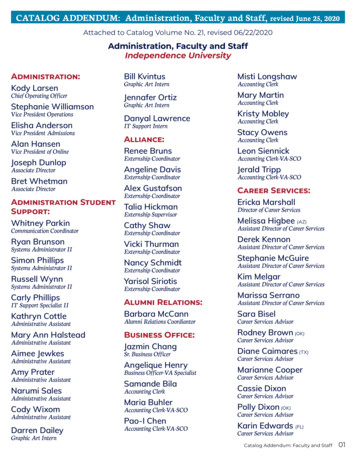
2Auditionfocusing on location, loudness, and pitch. Thesixth section presents an overview of auditoryscene analysis. I conclude with a discussionof where hearing research is headed.“auditory scene analysis” (Bregman, 1990),this problem has analogs in other sensorymodalities, but the nature of sound presentsthe auditory system with unique challenges.THE PROBLEMSOUND MEASUREMENT—THEPERIPHERAL AUDITORY SYSTEMJust by listening, we can routinely apprehendmany aspects of the world around us: thesize of a room in which we are talking,whether it is windy or raining outside, thespeed of an approaching car, or whether thesurface someone is walking on is gravel ormarble. This ability is nontrivial because theproperties of the world that are of interestto a listener are generally not explicit inthe acoustic input—they cannot be easilyrecognized or discriminated from the soundwaveform itself. The brain must process thesound entering the ear to generate representations in which the properties of interest aremore evident. One of the main objectives ofhearing science is to understand the natureof this transformation and its instantiation inthe brain.Like other senses, audition is furthercomplicated by a second challenge—that ofscene analysis. Although listeners are generally interested in the properties of individualobjects or events, the ears are rarely presented with the sounds from isolated sources.Instead, the sound signal that reaches the earis typically a mixture of sounds from different sources. Such mixtures of sound sourcesoccur frequently in natural auditory environments, for example in social settings, wherea single speaker of interest may be talkingamong many others, and in music. From themixture it receives as input, the brain mustderive representations of the individual soundsources of interest, as are needed to understand someone’s speech, recognize a melody,or otherwise guide behavior. Known as the“cocktail party problem” (Cherry, 1953), orThe transformation of the raw acoustic inputinto representations that are useful for behavior is apparently instantiated over many brainareas and stages of neural processing, spanning the cochlea, midbrain, thalamus, andcortex (Figure 2.1). The early stages of thiscascade are particularly intricate in the auditory system relative to other sensory systems,with many processing stations occurringprior to the cortex. The sensory organ of thecochlea is itself a complex multicomponentsystem, whose investigation remains a considerable challenge—the mechanical natureof the cochlea renders it much more difficultto probe (e.g., with electrodes) than the retinaor olfactory epithelium, for instance. Peripheral coding of sound is also unusual relativeto that of other senses in its degree of clinicalrelevance. Unlike vision, for which the mostcommon forms of dysfunction are optical innature, and can be fixed with glasses, hearingimpairment typically involves altered peripheral neural processing, and its treatment hasbenefited from a detailed understanding ofthe processes that are altered. Much of hearing research has accordingly been devotedto understanding the nature of the measurements made by the auditory periphery, andthey provide a natural starting point for anydiscussion of how we hear.Frequency Selectivity and the CochleaHearing begins with the ear, where soundis transduced into action potentials that aresent to the brain via the auditory nerve.
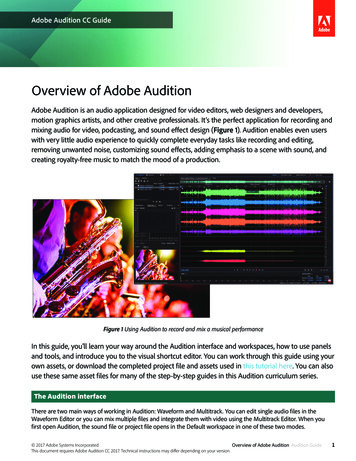
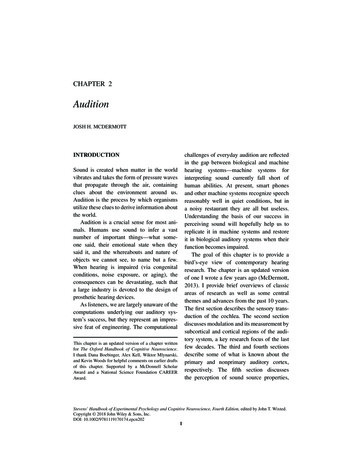
Sound Measurement—The Peripheral Auditory orcolliculusLeft cochleaAuditory nerveSuperiorolivarynucleusCochlearnucleusFigure 2.1 The auditory system. Sound is transduced by the cochlea, processed by an interconnectedset of subcortical areas, and then fed into the core regions of auditory cortex.Source: From Goldstein (2007). 2007 South-Western, a part of Cengage, Inc. Reproduced withpermission. www.cengage/com/permissionsThe transduction process is marked byseveral distinctive signal transformations,the most obvious of which is produced byfrequency tuning.The key components of sound transduction are depicted in Figure 2.2. Sound inducesvibrations of the eardrum, which are thentransmitted via the bones of the middle ear tothe cochlea, the sensory organ of the auditorysystem. The cochlea is a coiled, fluid-filledtube. Several membranes extend throughthe tube and vibrate in response to sound.Transduction of this mechanical vibrationinto an electrical signal occurs in the organ ofCorti, a mass of cells attached to the basilarmembrane. The organ of Corti in particular contains what are known as hair cells,named for the stereocilia that protrude fromthem. The inner hair cells are responsiblefor sound transduction. When the section ofmembrane on which they lie vibrates, stereocilia shear against the membrane above,opening mechanically gated ion channels andinducing a voltage change within the body ofthe cell. Neurotransmitter release is triggeredby the change in membrane potential, generating action potentials in the auditory nervefibers that the hair cell synapses with. Thiselectrical signal is carried by the auditorynerve fibers to the brain.The frequency tuning of the transductionprocess occurs because different parts ofthe basilar membrane vibrate maximally inresponse to different frequencies. This is
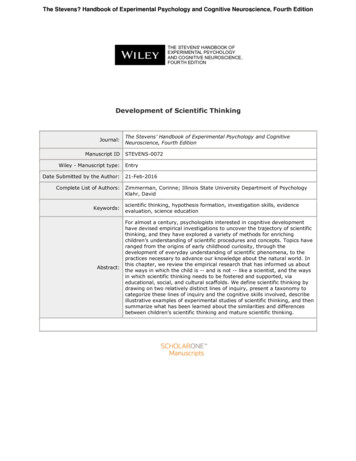
4AuditionCross section of nalVestibularcanalInnerhair nalCochleaTectorialmembrane StereociliaOrganof CortiBasilarmembraneAuditory nerveTunnel EfferentAfferent Inner of Corti fibershair cellsfibersOuterhair cellsBasilarmembraneOuterhair cellsFigure 2.2 Structure of the peripheral auditory system. (Top left) Diagram of ear. The eardrum transmits sound to the cochlea via the middle ear bones (ossicles). (Top middle) Inner ear. The semicircularcanals abut the cochlea. Sound enters the cochlea via the oval window and causes vibrations along thebasilar membrane, which runs through the middle of the cochlea. (Top right) Cross section of cochlea.The organ of Corti, containing the hair cells that transduce sound into electrical potentials, sits on topof the basilar membrane. (Bottom) Schematic of section of the organ of Corti. The shearing that occursbetween the basilar and tectorial membranes when they vibrate (in response to sound) causes the hair cellstereocilia to deform. The deformation causes a change in the membrane potential of the inner hair cells,transmitted to the brain via afferent auditory nerve fibers. The outer hair cells, which are 3 times morenumerous than the inner hair cells, serve as a feedback system to alter the basilar membrane motion,tightening its tuning and amplifying the response to low-amplitude sounds.Source: From Wolfe (2006, Chapter 9). Reproduced with permission of Oxford University Press.partly due to mechanical resonances—thethickness and stiffness of the membranevary along its length, producing a different resonant frequency at each point. Themechanical resonances are actively enhancedvia a feedback process, believed to be mediated largely by a second set of cells, calledthe outer hair cells. The outer hair cells abutthe inner hair cells on the organ of Corti andserve to alter the basilar membrane vibrationrather than transduce it. They expand andcontract in response to sound (Ashmore,2008; Dallos, 2008; Hudspeth, 2008). Theirmotion alters the passive mechanics of thebasilar membrane, amplifying the response tolow-intensity sounds and tightening the frequency tuning of the resonance. The upshotis that high frequencies produce vibrationsat the basal end of the cochlea (close to theeardrum), while low frequencies produce
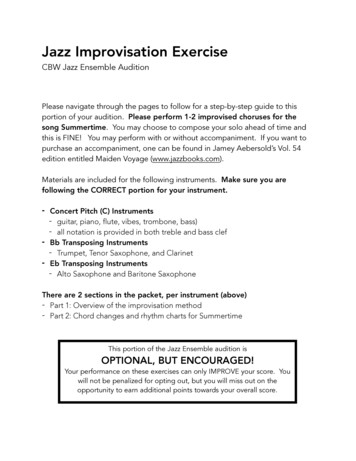
Sound Measurement—The Peripheral Auditory Systemvibrations at the apical end (far from theeardrum), with frequencies in between stimulating intermediate regions. The auditorynerve fibers that synapse onto individual innerhair cells are thus frequency-tuned—they fireaction potentials in response to a local rangeof frequencies, collectively providing therest of the auditory system with a frequencydecomposition of the incoming waveform.As a result of this behavior, the cochlea isoften described functionally as a set of bandpass filters—filters that each pass frequencieswithin a particular range, and eliminate thoseoutside of it. Collectively the filters span theaudible spectrum.The frequency decomposition of thecochlea is conceptually similar to the Fouriertransform, but differs in important respects.Whereas the Fourier transform uses linearlyspaced frequency bins, each separated bythe same number of Hz, the tuning bandwidth of auditory nerve fibers increaseswith their preferred frequency. This characteristic is evident in Figure 2.3A, inwhich the frequency response of a set ofauditory nerve fibers is plotted on a logarithmic frequency scale. Although thelowest frequency fibers are broader on alog scale than the high frequency fibers,in absolute terms their bandwidths aremuch lower—several hundred Hz insteadof several thousand. The distribution of bestfrequency along the cochlea also follows aroughly logarithmic function, apparent inFigure 2.3B, which plots the best frequencyof a large set of nerve fibers against thedistance along the cochlea of the hair cellthat they synapse with. These features offrequency selectivity are present in mostbiological auditory systems. It is partly forthis reason that a log scale is commonly usedfor frequency.Cochlear frequency selectivity has a hostof perceptual consequences—for instance,our ability to detect a particular frequencyis limited largely by the signal-to-noise5ratio of the cochlear filter centered on thefrequency. There are many treatments offrequency selectivity and perception (Moore,2003), as it is perhaps the most studied aspectof hearing.Although the frequency tuning of thecochlea is uncontroversial, the teleologicalquestion of why the cochlear transductionprocess is frequency tuned remains lesssettled. How does frequency tuning aid thebrain’s task of recovering useful informationabout the world from its acoustic input? Overthe last two decades, a growing number ofresearchers have endeavored to explain properties of sensory systems as optimal for thetask of encoding natural sensory stimuli, initially focusing on coding questions in vision,and using notions of efficiency as the optimality criterion (Field, 1987; Olshausen &Field, 1996). Lewicki and his colleagues haveapplied similar concepts to hearing, usingalgorithms that derive efficient and sparserepresentations of sounds (Lewicki, 2002;Smith & Lewicki, 2006), properties believedto be desirable of early sensory representations. They report that for speech, or setsof environmental sounds and animal vocalizations, efficient representations for soundlook much like the representation producedby auditory nerve fiber responses—soundsare represented with filters whose tuningis localized in frequency. Interestingly, theresulting representations share the dependence of bandwidth and frequency foundin biological hearing—bandwidths increasewith frequency as they do in the ear. Moreover, representations derived in the sameway for “unnatural” sets of sounds, suchas samples of white noise, do not exhibitfrequency tuning, indicating that the resultis at least somewhat specific to the sortsof sounds commonly encountered in theworld. These results suggest that frequencytuning of the sort found in the ear providesan efficient means to encode the soundsthat were likely of importance when the
6AuditionThreshold (dB SPL)(A)5000.512510Percent Distance From Base(B) 1008060402000.10.313Frequency (kHz)1030Figure 2.3 Frequency selectivity. (A) Threshold tuning curves of auditory nerve fibers from a cat ear,plotting the level that was necessary to evoke a criterion increase in firing rate for a given frequency(Miller, Schilling, Franck, & Young, 1997). (B) The tonotopy of the cochlea. The position along thebasilar membrane at which auditory nerve fibers synapse with a hair cell (determined by dye injections)is plotted versus their best frequency (Liberman, 1982).Source: Both parts of this figure are courtesy of Eric Young (Young, 2010), who replotted data from theoriginal sources. Reproduced with permission of Oxford University Press.auditory system evolved, possibly explainingits ubiquitous presence in auditory systemsas an optimal distribution of limited neural coding resources. It remains to be seenwhether this framework can explain potentialvariation in frequency tuning bandwidthsacross species—humans have recently beenclaimed to possess narrower tuning than otherspecies (Joris et al., 2011; Shera, Guinan, &Oxenham, 2002)—or the broadening offrequency tuning with increasing soundintensity (Rhode, 1978), but it provides onemeans by which to understand the origins ofperipheral auditory processing.
Sound Measurement—The Peripheral Auditory SystemAmplitude CompressionA second salient transformation that occursin the cochlea is that of amplitude compression. Compression is reflected in thefact that the mechanical response of thecochlea to a soft sound (and thus the neuralresponse that results) is larger than wouldbe expected given the response to an intensesound. The response elicited by a sound isnot proportional to the sound’s amplitude(as it would be if the response were linear),but rather to a compressive nonlinear function of amplitude. The dynamic range ofthe response to sound is thus “compressed”relative to the dynamic range of the acousticinput. Whereas the range of audible soundscovers five orders of magnitude, or 100 dB,the range of cochlear response covers onlyone or two orders of magnitude (Ruggero,Rich, Recio, & Narayan, 1997).Compression appears to serve to map therange of amplitudes that the listener needsto hear (i.e., those commonly encountered inthe environment) onto the physical operatingrange of the cochlea. Without compression, itwould have to be the case that either soundslow in level would be inaudible, or soundshigh in level would be indiscriminable (forthey would fall outside the range that couldelicit a response change). Compression permits very soft sounds to produce a physicalresponse that is (just barely) detectable,while maintaining some discriminability ofhigher levels.The compressive nonlinearity is oftenapproximated as a power function with anexponent of 0.3 or so. It is not obvious whythe compressive nonlinearity should take theparticular form that it does. Many differentfunctions could in principle serve to compressthe output response range. It remains to beseen whether compression can be explainedin terms of optimizing the encoding of theinput, as has been proposed for frequency7tuning (though see Escabi, Miller, Read, andSchreiner (2003)). Most machine hearingapplications also utilize amplitude compression prior to analyzing sound, however, and itis widely agreed to be useful to amplify lowamplitudes relative to large when processingsound.Amplitude compression was first noticedin measurements of the physical vibrationsof the basilar membrane (Rhode, 1971;Ruggero, 1992), but it is also apparent inauditory nerve fiber responses (Yates, 1990)and is believed to account for a number ofperceptual phenomena (Moore & Oxenham,1998). The effects of compression are relatedto cochlear amplification, in that compressionresults from response amplification that islimited to low-intensity sounds. Compressionis achieved in part via the outer hair cells,whose motility modifies the motion of thebasilar membrane in response to sound (Ruggero & Rich, 1991). Outer hair cell functionis frequently altered in hearing impairment,one consequence of which is a loss of compression, something that hearing aids attemptto mimic.Neural Coding in the Auditory NerveAlthough frequency tuning and amplitudecompression are at this point uncontroversialand relatively well understood, several otherempirical questions about peripheral auditorycoding remain unresolved. One importantissue involves the means by which the auditory nerve encodes frequency information.As a result of the frequency tuning of theauditory nerve, the spike rate of a nervefiber contains information about frequency(a large firing rate indicates that the soundinput contains frequencies near the centerof the range of the fiber’s tuning). Collectively, the firing rates of all nerve fibers couldthus be used to estimate the instantaneousspectrum of a sound. However, spike timings
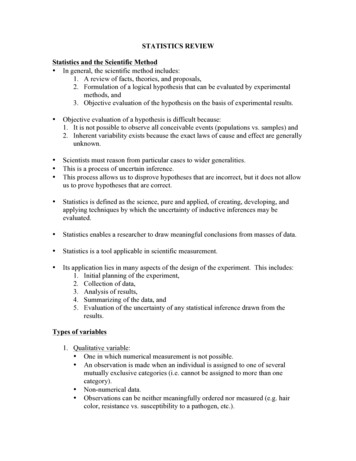
8Auditionalso carry frequency information. At least forlow frequencies, the spikes that are fired inresponse to sound do not occur randomly, butrather tend to occur at the peak displacementsof the basilar membrane vibration. Becausethe motion of a particular section of the membrane mirrors the bandpass filtered soundwaveform, the spikes occur at the waveformpeaks (Rose, Brugge, Anderson, & Hind,1967). If the input is a single frequency,spikes thus occur at a fixed phase of thefrequency cycle (Figure 2.4A). This behavioris known as “phase locking” and producesspikes at regular intervals corresponding tothe period of the frequency. The spike timingsthus carry information that could potentiallyaugment or supercede that conveyed by therate of firing.Phase locking degrades in accuracy asfrequency is increased (Figure 2.4B) dueto limitations in the temporal fidelity of thehair cell membrane potential (Palmer &Russell, 1986), and is believed to be largelyabsent for frequencies above 4 kHz in mostmammals, though there is some variabilityacross species (Johnson, 1980; Palmer &(B)1Phase-Locking Index(A)Russell, 1986; Sumner & Palmer, 2012).The appeal of phase locking as a code forsound frequency is partly due to featuresof rate-based frequency selectivity that areunappealing from an engineering standpoint.Although frequency tuning in the auditorysystem (as measured by auditory nerve spikerates or psychophysical masking experiments) is narrow at low stimulus levels, itbroadens considerably as the level is raised(Glasberg & Moore, 1990; Rhode, 1978).Phase locking, by comparison, is robustto sound level—even though a nerve fiberresponds to a broad range of frequencieswhen the level is high, the time intervals between spikes continue to conveyfrequency-specific information, as the peaksin the bandpass-filtered waveform tend tooccur at integer multiples of the periods ofthe component frequencies.Our ability to discriminate frequency isimpressive, with thresholds on the order of1% (Moore, 1973), and there has been longstanding interest in whether this ability in partdepends on fine-grained spike timing information (Heinz, Colburn, & Carney, 2001).01001000Frequency (Hz)10000Figure 2.4 Phase locking. (A) A 200 Hz pure tone stimulus waveform aligned in time with severaloverlaid traces of an auditory nerve fiber’s response to the tone. Note that the spikes are not uniformlydistributed in time, but rather occur at particular phases of the sinusoidal input. (B) A measure of phaselocking for each of a set of nerve fibers in response to different frequencies. Phase locking decreases athigh frequencies.Source: Reprinted from Javel and Mott (1988). Reproduced with permission of Elsevier.
Sound Measurement—The Peripheral Auditory SystemAlthough phase locking remains uncharacterized in humans due to the unavailabilityof human auditory nerve recordings, it ispresumed to occur in much the same way asin nonhuman auditory systems. Moreover,several psychophysical phenomena are consistent with a role for phase locking in humanhearing. For instance, frequency discrimination becomes much poorer for frequenciesabove 4 kHz (Moore, 1973), roughly thepoint at which phase locking declines in nonhuman animals. The fundamental frequencyof the highest note on a piano is also approximately 4 kHz; this is also the point abovewhich melodic intervals between pure tones(tones containing a single frequency) are alsomuch less evident (Attneave & Olson, 1971;Demany & Semal, 1990). These findings provide some circumstantial evidence that phaselocking is important for deriving precise estimates of frequency, but definitive evidenceremains elusive. It remains possible that theperceptual degradations at high frequenciesreflect a lack of experience with such frequencies, or their relative unimportance fortypical behavioral judgments, rather than aphysiological limitation.The upper limit of phase locking is alsoknown to decrease markedly at each successive stage of the auditory system (Wallace,Anderson, & Palmer, 2007). By primaryauditory cortex, the upper cutoff is in theneighborhood of a few hundred Hz. It wouldthus seem that the phase locking that occursrobustly in the auditory nerve would need tobe rapidly transformed into a spike rate codeif it were to benefit processing throughoutthe auditory system. Adding to the puzzle isthe fact that frequency tuning is not thoughtto be dramatically narrower at higher stagesin the auditory system. Such tighteningmight be expected if the frequency information provided by phase-locked spikes wastransformed to yield improved rate-based frequency tuning at subsequent stages (though9see Bitterman, Mukamel, Malach, Fried, andNelken (2008)).FeedbackLike other sensory systems, the auditorysystem can be thought of as a processing cascade, extending from the sensory receptors tocortical areas believed to mediate auditorybased decisions. This “feed-forward” view ofprocessing underlies much auditory research.As in other systems, however, feedback fromlater stages to earlier ones is ubiquitous andsubstantial, and in the auditory system isperhaps even more pronounced than elsewhere in the brain. Unlike the visual system,for instance, the auditory pathways containfeedback extending all the way back to thesensory receptors. The function of much ofthis feedback remains poorly understood,but one particular set of projections—thecochlear efferent system—has been thesubject of much discussion.Efferent connections to the cochleaoriginate primarily from the superior olivary nucleus, an area of the midbrain afew synapses removed from the cochlea(Figure 2.1, though the efferent pathwaysare not shown). The superior olive is dividedinto two subregions, medial and lateral, andto first order, these give rise to two efferentprojections: one from the medial superiorolive to the outer hair cells, called the medialolivocochlear (MOC) efferents, and onefrom the lateral superior olive to the innerhair cells (the LOC efferents) (Elgoyhen &Fuchs, 2010). The MOC efferents have beenmore thoroughly studied than their LOCcounterparts. Their activation (by electricalstimulation, for instance) is known to reducethe basilar membrane response to lowintensity sounds and causes the frequencytuning of the response to broaden. This isprobably because the MOC efferents inhibitthe outer hair cells, which are crucial to
10Auditionamplifying the response to low-intensitysounds, and to sharpening frequency tuning.The MOC efferents may serve a protective function by reducing the response toloud sounds (Rajan, 2000), but their mostcommonly proposed function is to enhancethe response to transient sounds in noise(Guinan, 2006). When the MOC fibers aresevered, for instance, performance on tasksinvolving discrimination of tones in noise isreduced (May & McQuone, 1995). Noiserelated MOC effects are proposed to derivefrom its influence on adaptation, whichwhen induced by background noise reducesthe detectability of transient foregroundsounds by decreasing the dynamic rangeof the auditory nerve’s response. BecauseMOC activation reduces the response toongoing sound, adaptation induced by continuous background noise is reduced, thusenhancing the response to transient tones thatare too brief to trigger the MOC feedbackthemselves (Kawase, Delgutte, & Liberman,1993; Winslow & Sachs, 1987). Anotherinteresting but controversial proposal is thatthe MOC efferents play a role in auditoryattention. One study, for instance, found thatpatients whose vestibular nerve (containingthe MOC fibers) had been severed werebetter at detecting unexpected tones after thesurgery, suggesting that selective attentionhad been altered so as to prevent the focusingof resources on expected frequencies (Scharf,Magnan, & Chays, 1997). See Guinan (2006)for a recent review of these and other ideasabout MOC efferent function.SOUND MEASUREMENT—MODULATIONSubcortical Auditory PathwaysThe auditory nerve feeds into a cascadeof interconnected subcortical regions thatlead up to the auditory cortex, as shown inFigure 2.1. The subcortical auditory pathwayshave complex anatomy, only some of whichis depicted in Figure 2.1. In contrast to thesubcortical pathways of the visual system,which are less complex and largely preservethe representation generated in the retina, thesubcortical auditory areas exhibit a panoplyof interesting response properties not foundin the auditory nerve, many of which remainactive topics of investigation. Several subcortical regions will be referred to in thesections that follow in the context of othertypes of acoustic measurements or perceptualfunctions. One of the main features thatemerges in subcortical auditory regions istuning to amplitude modulation, the subjectof the next section.Amplitude Modulation and theEnvelopeThe cochlea decomposes the acoustic inputinto frequency channels, but much of theimportant information in sound is conveyedby the way that the output of these frequency channels is modulated in amplitude.Consider Figure 2.5A, which displays in bluethe output of one such frequency channelfor a short segment of a speech signal. Theblue waveform oscillates at a rapid rate, butits amplitude waxes and wanes at a muchlower rate (evident in the close-up view ofFigure 2.5B). This waxing and waning isknown as “amplitude modulation” and is acommon feature of many modes of soundproduction (e.g., vocal articulation). Theamplitude is captured by what is known as the“envelope” of a signal, shown in red for thesignal of Figures 2.5A and B. The envelopesof a set of bandpass filters can be stacked vertically and displayed as an image, generatinga spectrogram (referred to as a cochleogramwhen the filters mimic the frequency tuning of the cochlea, as in Figure 2.5C).Figure 2.5D shows the spectra of the signal and its envelope. The signal spectrumis bandpass (because it is the output of a
Sound 1000Time (ms)15001700(D)(C) 8997527717201740Time (ms)17600–103057Power (dB)Frequency (Hz)111732942470–20–30–4018805001000Time (ms)1500–500100200300Frequency (Hz)400Figure 2.5 Amplitude modulation. (A) The output of a bandpass filter (centered at 340 Hz) for arecording of speech, plotted in blue, with its envelope plotted in red. (B) Close-up of part of (A) (corresponding to the black rectangle in (A)). Note that the filtered sound signal (like the unfiltered signal)fluctuates around zero at a high rate, whereas the envelope is positive valued, and fluctuates more slowly.(C) Cochleagram of the same speech signal formed from the envelopes of a set of filters mimicking thefrequency tuning of the cochlea (one of which is plotted in (A)). The cochleagram is produced by plotting each envelope horizontally in grayscale. (D) P
6 Audition 0.5 1 2 5 10 0.1 0.3 1 3 10 30 0 50 (A) (B) 100 80 60 40 20 0 Frequency (kHz) Percent Distance From Ba