Transcription
2021-2022
I am delighted to share the Employment Report for the MBA Class of 2021, which includesinternship data for the MBA Class of 2022.This year’s outcomes highlight the value of the MIT Sloan MBA, especially in times thatcall for agile business leaders who solve complex problems with ingenuity. 95.9% of theMBA Class of 2021 received offers within three months of graduation. The top industrieshiring our graduates were Consulting (28.3%), Technology (25.0%), and Finance (21.4%).Following a trend we observed in their internships, the MBA Class of 2021 also accepted ahigher percentage of full-time offers in Pharmaceuticals/Healthcare/Biotechnology (9.8%)than the previous class.The average base salary for the MBA Class of 2021 increased to 148,075, while the medianbase salary held steady at 150,000. The median signing bonus was 30K. Marking a twoyear trend, other guaranteed compensation increased again this year. 70.5% of graduatesreported they received guaranteed compensation beyond a signing bonus, with an averagevalue of 34K and a median value of 65K. Growth potential was the top reason (40.7%)graduates accepted their position.For the MBA Class of 2022, the top internship industries were Finance (26.2%), Technology(25.6%), and Consulting (21.0%). Pharmaceuticals/Healthcare/Biotechnology (7.3%)remained a key industry for internship-seeking students, rounding out our top four industries.Sloanies are motivated by potential for impact and opportunities to make their ideas matter.Graduates found these opportunities with companies who have long-standing hiringrelationships with MIT Sloan, as well as companies hiring at MIT Sloan for the first time. TheClasses of 2021 and 2022 accepted opportunities at 342 companies, pursuing pathways forimpact and advancement at leading and growing organizations across the country and aroundthe globe. 48.6% of students who accepted positions went to work with employers who hiredthree or more Sloanies for full-time roles or internships; and 53.5% of the organizations thathired Sloanies this year did so for the first time.We are grateful to our faculty, employers, alumni, students, and partners across the MIT Sloancommunity for creating and engaging in the uniquely Sloan experience that drives these greatoutcomes, through world-class curriculum, labs, centers and initiatives, and professionaldevelopment and networking activities.We look forward to future collaboration, and we thank you for your support!Susan BrennanAssistant Dean,MIT Sloan Career Development OfficeMIT SLOAN MBA EMPLOYMENT REPORT 2021-2022 Page 2
EMPLOYERS HIRING MEMBERS OF THE MBA CLASSES OF 2021 AND 20221922 Investment1upHealth22North VenturesA24AbiomedThe Action NetworkActivision BlizzardAdobeAdvent International CorpAeris PartnersAES CorporationAgios PharmaceuticalsAirworksAlixPartnersAlnylam PharmaceuticalsAltis S.A.Amazon*1Amgen*AmplitudeAnalytical SpaceAnheuser-Busch InBevApex Clean EnergyAppleApplied IntuitionApplied VenturesAraguaia HoldingsArdent Venture PartnersARENAAT&TAtlanta VenturesAtlast FoodAtomicAUA Private Equity PartnersAurora InnovationAutodeskAutonomous AIAvangridAvivar CapitalAxiomadaB Capital GroupBain & CompanyBain CapitalBank of America Merrill LynchBayerBC PartnersBechtel EnterprisesBiobot AnalyticsBiogen*BitRate Venture CapitalBlackRock1 AmazonBloomReachBlue like an Orange SustainableCapitalBlue Meridian PartnersBlue OriginBlue Sage CapitalBNY MellonBoeingBoost CapitalThe Boston Consulting Group2Boston PropertiesBoxer CapitalThe Brattle GroupBravenBrigham and Women's HospitalBuilt RoboticsC3 AICajal NeuroscienceCalifornia Department ofFinanceCapchaseCapital OneCarGurusThe Carlyle GroupCelsiusEnergyCengageCentaur LabsCenterview PartnersCENTRE.ioCeres ImagingChamberlain AdvisorsChanelCheckmate PharmaceuticalsChenMedCiderCiscoCitiCity of San JoséClearBridge InvestmentsCleveland Real Estate InvestorsClosed Loop PartnersComanche BiopharmaCommureCondire InvestorsControlHubCoStar Portfolio StrategyCreativelyCredit SuisseCresta IntelligenceCuratedThe D.E. Shaw GroupDanaher CorporationDataRobotDaVitaDeepliteDeloitte ConsultingDelta-v CapitalDICK'S Sporting GoodsDivergent TechnologiesDiversis CapitalDocuSignDraftKingsDraper AssociatesDST GlobalDTE EnergyeBayThe Ecosystem Integrity FundEDF EnergyEhong CapitalElectronic ArtsElevate Sports VenturesEli Lilly and CompanyELSAPEmerson CollectiveEmpower BankingEnergy FoundryEnergy Impact PartnersEntytleEpsagonThe Equity AllianceErgattaEventide Asset con AmbulanceFarmers GateFarol ATTFederal Bureau of InvestigationFidelity InvestmentsFin Venture CapitalFinancial Technology PartnersFJ LabsFlagship PioneeringFLEETCORFoothill VenturesFootprint CoalitionFor Soccer VenturesFord Motor Companyincludes Amazon Web Services and Amazon Robotics.Boston Consulting Group includes BCG Digital.3 Google includes YouTube.4 United Nations includes UNICEF.2 TheFoundation MedicineFounder CollectiveFreight FarmsFremman CapitalGapGenentechGenerate CapitalGilead SciencesGinkgo BioworksGlobal Digital AssetsGlobal Founders CapitalGoDaddyGoldman SachsGoogle3Government of BrazilGuotai Junan SecuritiesH.I.G. CapitalH20 Capital InnovationHandyHappify HealthHealth AdvancesH-E-B GroceryHelainaHelloFreshHelpAroundHeywood & SonsHike VenturesHome Run DugoutHomelightHouston RocketsHubSpotHumanaHummingbird VenturesHuron ConsultingThe HYM Investment nternational FinanceCorporationIntuitInvoice CloudJohnson & JohnsonJP Morgan Chase & Co.KAPPA SecuritiesKearneyKing Arthur BakingKuiper SystemsL.E.K. ConsultingLAB VenturesLazardLeanTaaSLever VCLFM Capital*Liberty Mutual InsuranceLightstepLikewiseLoginIDLogistics Management InstituteLongpoint Realty PartnersLucid MotorsMaiden HomeMarathon CapitalMassDevelopmentMasterCard WorldwideMasterClassMcKinsey & CompanyMetrikaMGM Resorts InternationalMicrosoftMIT DriverlessModal RakyatMoelis & CompanyMorgan StanleyMuse CapitalMuus Asset Management Corp.National Park ServiceThe Nature ConservancyNestléNetflixNeuberger BermanNew BalanceNew York City EconomicDevelopment CorporationNike*Northrop GrummannTopologyNucleateOliver WymanParsons CorporationParticle HealthPatagoniaPATHPayPalPear TherapeuticsPelotonPermiraPfizerPIMCOPiper SandlerPocket GemsPolaris PartnersPutnam AssociatesQuaise EnergyQuantisRakutenRapidsosREDFRegeneron PharmaceuticalsThe Related CompaniesRentSpreeRestaurant BrandsInternationalREXRhino HealthRidgeline Energy AnalyticsRipple LabsRivianRokuRoland BergerRubicon Capital AdvisorsSalkantay PartnersSamaritan’s PurseSamsungSanofi GenzymeSantinilestari LokaprimaSAPSellerXServiceNowShopeeSilicon Valley BankSimmons EnergySocial FinanceSongbird TherapySpaceXSplunk TechnologySpotifyStone-Goff PartnersStrategy&Supply Change CapitalTA RealtyTakeda PharmaceuticalsTarget*Target GlobalTencentTerritory FoodsTeslaThermo Fisher ScientificThornburg InvestmentManagementTiger Pacific CapitalTikTokTinycareTishman SpeyerToastTrackManThe Trade DeskTranscarentTransnational Giving EuropeTriLinc GlobalTrueNorthTuring VideoUberUBSUfenau Capital PartnersUnited Nations4United Talent AgencyUnity TechnologiesUP PartnersUpfront VenturesUpstart NetworkValoVamosVenturesThe Vanguard GroupVerizon*Vertex PharmaceuticalsVHBViking Global InvestorsWatermill GroupWayfairWellframeWellington ManagementCompanyWheelWndrCoWorkanaWren House InfrastructureManagementWysaXontogenyY AnalyticsY CombinatorYETIYotmeZafinZillow GroupZus HealthRed Employers hiring three or more MIT Sloan MBA students for full-time and/or summer positions.*LGO Partner during the 2020-2021 academic year.MIT SLOAN MBA EMPLOYMENT REPORT 2021-2022 Page 3
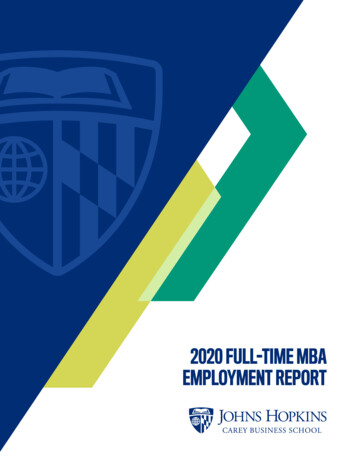
MBA CLASS OF 2021FULL-TIME EMPLOYMENT HIGHLIGHTSTOP 4%Pharma/Health/Biotech9.8%SALARY SUMMARYMEAN BASE SALARY 148,075 65K 150,000Minimumbase salary 275KMaximumbase salaryJOB OFFERSMEDIAN BASE SALARYSIGNING BONUS 30KMEDIAN SIGNING BONUS72.1%OF STUDENTS ACCEPTING AN OFFERAND PROVIDING USABLE SALARY DATA1REPORTED RECEIVING A SIGNING BONUS1 90.9%of students accepting an offer provided usable salary data.MIT SLOAN MBA EMPLOYMENT REPORT 2021-2022 Page 495.9%RECEIVED FULL-TIME OFFERS WITHINTHREE MONTHS OF GRADUATIONTOP REASON FOR ACCEPTING POSITION40.7%GROWTH POTENTIAL
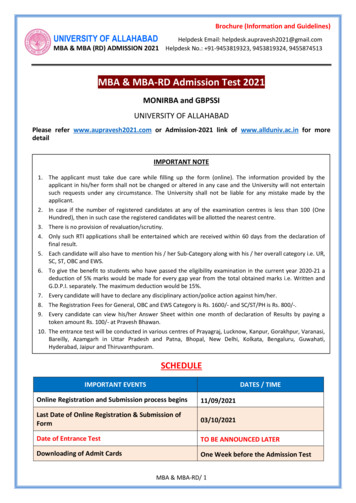
MBA CLASS OF 2021 FULL-TIME PROFILE DATACLASS PROFILE1Number of Candidates416U.S. Citizens/Permanent Residents59%Non-U.S. Citizens41%Women41%Median GMAT Score730Average Undergraduate GPA (out of 4.0)3.6Average Years Full-Time Work Experience Prior to MIT SloanTOP EMPLOYERS OFMBA CLASS OF 202125profile, as of matriculation, includes information for MBA students and studentsin the joint MBA/Leaders for Global Operations program.# of Hires1 ClassEMPLOYMENT PROFILEMcKinsey & Company30The Boston Consulting Group29Amazon12Bain & Company11COUNT% OF CLASSTotal407100%Google9Seeking29171.5%JP Morgan Chase & Co.410726.3%Morgan Stanley4Sponsored and Returning7618.7%Rivian4Starting a Business174.2%Amgen3Continuing Education123.0%HelloFresh3Postponing a Job Search10.2%IBM3Other10.2%Nike392.2%Not SeekingNo Recent Information2Grouped by parent company. Includes only accepted offers fromseeking population. Sponsored and returning are not included.MIT SLOAN MBA EMPLOYMENT REPORT 2021-2022 Page 5
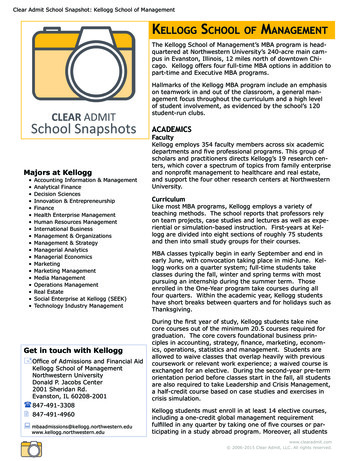
MBA CLASS OF 2021 FULL-TIME BASE SALARY BY INDUSTRYTOP INDUSTRIESINDUSTRY%MEANMEDIANLOWHIGH74.7% 150,576 150,000 65,000 275,000Consulting28.3% 157,572 165,000 70,000 175,000Finance21.4% 153,750 150,000 90,000 250,000Investment Banking/Brokerage6.5% 149,200 150,000 123,000 175,000Investment Management4.3% 142,273 150,000 90,000 180,000Private Equity3.6% 166,500 157,500 100,000 250,000Venture Capital3.6% 162,000 150,000 120,000 240,000Diversified Financial Services3.3% 151,167 145,000 125,000 180,000Software/Internet21.4% 143,806 140,000 100,000 275,000Media/Entertainment/Sports1.8% 102,000 100,000 65,000 150,000Retail1.1%-1---Other Service20.7%-1---Manufacturing Industries23.9% 142,517 140,000 72,000 260,000Pharmaceutical/Healthcare/Biotechnology9.8% 148,160 140,000 72,000 260,000Consumer Products4.0% 133,727 140,000 105,000 151,000Automotive/Aerospace3.6% 149,125 149,000 130,000 170,000Computers/Electronics2.9% 151,429 145,000 140,000 175,000Energy1.8% 127,000 120,000 100,000 165,000Other Manufacturing31.8% 122,000 120,000 110,000 138,000Service IndustriesOther Industries1.4% 102,554 102,663 100,000 --Education-Dash indicates fewer than three or less than 1% unique salary data points.Other Service includes Real Estate.3 Other Manufacturing includes Telecommunications, AgriTech, and Diversified Manufacturing.12MIT SLOAN MBA EMPLOYMENT REPORT 2021-2022 Page .1%Consulting27.6%18.5%Technology4Finance202030.7% 30.7%Consulting19.7%Technology4Finance20194 Technologyincludes Software/Internet,Computers/Electronics, andTelecommunications.
MBA CLASS OF 2021 FULL-TIME BASE SALARY BY egic Planning34.8% 153,649 165,000 65,000 175,000Finance22.3% 155,600 150,000 90,000 260,000Investment Banking7.0% 151,125 150,000 123,000 180,000Asset Management/Portfolio Management3.6% 154,375 152,500 110,000 180,000Venture Capitalist3.6% 164,500 150,000 120,000 240,000Private Equity3.3% 166,667 150,000 100,000 250,000Treasury/Corporate Finance2.2% 148,333 137,500 128,000 200,000Other Finance12.6% 145,000 125,000 90,000 260,00013.2% 137,500 135,000 72,000 200,00013.2% 142,939 144,000 120,000 170,000Leadership Development Program/General Management8.8% 129,524 130,000 85,000 155,000Business Development4.8% 154,231 150,000 100,000 275,000Business Analytics1.5% 130,000 122,500 100,000 175,000Marketing31.0% 138,667 140,000 125,000 151,000Other Function40.4%-5---Operations/Project Management2Product Management/DevelopmentOther Finance includes Research and Unspecified Finance.Operations/Project Management includes Supply Chain.3 Marketing includes Market Research, Product Marketing, and Sales.1425Other Function includes Engineering.Dash indicates fewer than three people or less than 1% reported salary information.TOP FUNCTIONSConsulting/Strategic Planning202134.8%FinanceProduct Management/DevelopmentOperations/Project ManagementConsulting/Strategic Planning39.7%202013.2% 13.2%Product Management/DevelopmentOperations/Project trategic Planning16.7% 16.7%12.4%Operations/Project ManagementProduct Management/Development15.5%13.9%11.9%MIT SLOAN MBA EMPLOYMENT REPORT 2021-2022 Page 7
MBA CLASS OF 2021 FULL-TIME BASE SALARY BY GEOGRAPHIC LOCATIONREGION%MEANMEDIANLOWHIGH90.7% 149,874 150,000 65,000 275,00089.2% 149,756 150,000 65,000 275,00040.4% 149,704 150,000 72,000 250,000Boston Metro20.7% 149,429 150,000 72,000 250,000NYC Metro18.9% 149,340 150,000 100,000 240,00028.1% 151,473 150,000 100,000 275,000SF Bay Area15.2% 156,885 150,000 122,000 275,000Los Angeles Metro5.6% 146,571 150,000 110,000 170,000Seattle Metro5.2% 141,571 132,000 100,000 200,0006.3% 142,392 150,000 95,000 175,0004.4% 144,639 155,000 95,000 175,000SOUTHWEST6.3% 147,941 165,000 65,000 220,000SOUTH4.4% 154,182 165,000 125,000 175,000Miami Metro2.2% 146,000 130,000 125,000 175,000Atlanta Metro1.9% 163,000 165,000 155,000 165,0003.7% 148,333 150,000 130,000 165,000Chicago Metro1.5% 157,500 162,500 140,000 165,000Detroit Area1.1% 148,333 150,000 130,000 165,0001.5% 156,500 158,500 144,000 165,000ASIA3.3% 138,223 130,000 120,285 180,000EUROPE3.0% 143,333 150,000 125,000 155,000LATIN AMERICA & THE CARIBBEAN3.0% 107,143 100,000 70,000 170,000NORTH AMERICAUnited StatesNORTHEASTWESTMIDATLANTICWashington DC MetroMIDWESTCanadaMIT SLOAN MBA EMPLOYMENT REPORT 2021-2022 Page 8
MBA CLASS OF 2021 FULL-TIME SIGNING BONUS RECEIVED BY JOB FUNCTIONSIGNING BONUS BY JOB FUNCTION% RECEIVINGMEANMEDIANLOWHIGHConsulting/Strategic Planning84.4% 29,382 30,000 10,000 60,000Finance52.7% 36,103 40,000 10,000 60,000Investment Banking68.8% 50,864 52,000 40,000 60,000Asset Management/ Portfolio Management62.5% 38,000 35,000 30,000 55,000Venture Capital20.0%-1---Private Equity33.3% 18,333 15,000 15,000 25,000Treasury/Corporate Finance83.3% 30,000 25,000 25,000 50,000Other Finance250.0% 24,167 12,500 10,000 50,000Operations/Project Management380.6% 31,620 25,000 7,500 70,000Product Management/Development72.7% 28,792 25,000 5,000 63,000Leadership Development Program/General Management85.7% 21,861 22,500 1,500 40,000Business Development46.2% 23,500 22,500 6,000 40,000100.0% 45,000 40,000 30,000 65,000Marketing4Dash indicates fewer than three people or less than 1% reported salary information.Other Finance includes Research and Unspecified Finance.3 Operations/Project Management includes Supply Chain.4 Marketing includes Market Research, Product Marketing, and Sales.12OTHER GUARANTEED COMPENSATION% REPORTING70.5%MEANMEDIANLOWHIGH 65,064 34,000 1,000 850,000Other Guaranteed Compensationincludes: Stock options and equity Relocation and moving expenses Tuition and education reimbursementMIT SLOAN MBA EMPLOYMENT REPORT 2021-2022 Page 9
MBA CLASS OF 2021 FULL-TIME OFFER SOURCE AND REASON FOR ACCEPTING OFFEROFFER SOURCETIMING OF JOB OFFERSAT GRADUATIONTHREE MONTHSAFTER GRADUATION89.7%95.9%%School FacilitatedTIMING OF JOB ACCEPTANCESAT GRADUATIONTHREE MONTHSAFTER GRADUATION83.8%94.8%REASON ACCEPTED63.5%Summer Internship — School Facilitated29.7%Job Postings (MIT or Sloan)12.8%LGO6.8%Interviews through On-campus Recruiting5.3%Faculty/CDO/Sloan Student Referral4.5%MIT/Sloan Sponsored Events2.6%Other School Facilitated11.8%Growth Potential40.7%Job Function17.9%Industry17.1%People/Corporate Culture7.7%Personal Network17.3%Prestige of Firm5.7%Summer Internship — Student Facilitated8.3%Compensation3.3%Online Job Postings4.5%Commitment to Social Impact2.8%Contacted Directly4.1%Commitment to Sustainability2.8%Previous Employer2.3%Location2.0%MIT SLOAN MBA EMPLOYMENT REPORT 2021-2022 Page 10Student Facilitated1 OtherSchool Facilitated includes Alumni and Club Events.36.5%
MBA CLASS OF 2022 INTERNSHIP EMPLOYMENT DATATOP EMPLOYERS OFMBA CLASS OF 2022 INTERNS2CLASS PROFILE1Number of Candidates484U.S. Citizens/Permanent Residents67%The Boston Consulting Group33Non-U.S. Citizens33%Amazon25McKinsey & Company14Women38%Google12Median GMAT Score720Bain & Company11Average Undergraduate GPA (out of 4.0)3.54Goldman Sachs8Apple5Capital One5Cisco4Facebook4JP Morgan Chase & Co.4Nike4Bank of America Merrill Lynch3Danaher Corporation3DraftKings3Evercore3# OF INTERNSAverage Years Full-Time Work Experience Prior to MIT Sloan15Class profile, as of matriculation, includes information for MBA students and students inthe joint MBA/Leaders for Global Operations program.EMPLOYMENT PROFILECOUNT% OF CLASSTotal484100%Seeking38780.0%EY-Parthenon3Not Seeking5110.5%IBM3Kearney3Starting a Business449.1%Microsoft3Sponsored and Returning71.4%Morgan Stanley3LGO469.5%Strategy&32Grouped by parent company. Includes only accepted offers fromthe seeking population. Sponsored and returning are not included.MIT SLOAN MBA EMPLOYMENT REPORT 2021-2022 Page 11
MBA CLASS OF 2022 INTERNSHIP MONTHLY BASE SALARY BY INDUSTRYTOP INDUSTRIESINDUSTRY1Service IndustriesFinance%MEANMEDIANLOWHIGH77.5% 9,334 9,615 1,200 20,83326.2% 8,682 9,400 1,200 20,833Venture Capital8.3% 5,460 5,100 2,000 15,000Investment Banking/Brokerage7.3% 11,256 12,500 4,800 14,000Investment Management4.1% 10,828 11,000 4,000 20,833Private Equity2.8% 5,767 5,000 3,000 10,000Diversified Financial Services2.8% 8,899 10,200 1,200 12,500Other Finance0.9%-2---Software/Internet22.5% 8,216 8,200 1,667 15,000Consulting21.0% 12,320 13,500 2,800 13,750Media/Entertainment/Sports3.6% 7,101 7,200 3,333 12,000Retail1.8% 6,783 7,710 1,600 9,600Other Service2.4% 5,669 4,000 1,600 12,000Manufacturing Industries18.9% 7,686 7,800 2,000 13,000Pharmaceutical/Healthcare/Biotechnology7.3% 7,299 7,520 4,000 9,750Consumer Products3.8% 7,525 7,500 3,600 10,000Computers/Electronics3.1% 9,687 9,200 6,400 13,000Automotive/Aerospace2.1% 6,957 7,000 2,000 10,000Energy1.3% 8,132 7,500 6,600 10,5601.3% 7,150 7,250 5,600 8,5003.6% 3,955 4,064 1,800 5,900Nonprofit1.8% 4,125 4,400 1,800 5,900Government1.5%-2---0.3%2---34Other ManufacturingOther IndustriesEducation-Salary data captures monthly salaries for interns.Dash indicates fewer than three people or less than 1% reported salary information.3 Other Service industries includes Real Estate and Human Resources.4 Other Manufacturing industries includes AgriTech and Diversified Manufacturing.26.2% logy524.6%19.6%FinanceConsulting201912MIT SLOAN MBA EMPLOYMENT REPORT 2021-2022 Page 125Technology includes Software/Internet,Computers/Electronics, andTelecommunications.
MBA CLASS OF 2022 INTERNSHIP MONTHLY BASE SALARY BY egic Planning29.1% 11,094 13,000 2,800 15,567Finance26.5% 8,304 8,000 1,600 20,833Venture Capital8.4% 5,653 5,200 2,000 15,000Investment Banking6.3% 11,855 12,500 8,000 14,000Asset Management/Portfolio Management2.9% 10,869 11,334 4,600 20,833Private Equity2.9% 6,465 5,700 3,000 13,750Treasury/Corporate Finance1.6% 8,467 8,025 5,000 12,000Private Client Services/Wealth Management1.0% 8,277 9,615 4,800 10,416Other Finance13.4% 5,494 4,128 1,600 10,417Product Management/Development16.3% 8,448 8,022 4,000 15,000Operations/Project Management211.5% 7,412 8,100 1,600 12,0009.7% 7,259 7,385 1,667 10,560Marketing2.9% 7,460 7,650 1,200 10,200Leadership Development Program/General Management2.1% 9,564 9,500 8,500 10,747Business Analytics1.3% 6,977 7,200 4,000 11,3840.6%5---Business Development34Other-1425Other Finance includes Research, Development, and Unspecified Finance.Operations/Project Management includes Supply Chain.3 Marketing includes Brand Management and Market Research.TOP FUNCTIONS29.1%Consulting/Strategic PlanningFinanceProduct Management/DevelopmentOperations/Project Management26.5%Other includes Human Resources and Policy Development.Dash indicates fewer than three people or less than 1% reported salary information.2021Consulting/Strategic PlanningFinance16.3%11.5%Product Management/DevelopmentOperations/Project Management25.6% 25.6%202018.9%Consulting/Strategic Planning201928.7%22.3%Finance7.7%Product Management/Development11.9% 11.0%Operations/Project ManagementMIT SLOAN MBA EMPLOYMENT REPORT 2021-2022 Page 13
MBA CLASS OF 2022 INTERNSHIP MONTHLY BASE SALARY BY GEOGRAPHIC LOCATION,OFFER SOURCE, AND REASON FOR ACCEPTING OFFERREGION%MEANMEDIANLOWHIGH93.8% 9,064 9,130 1,200 20,8336.2% 6,476 5,028 1,600 13,000EUROPE3.1% 6,669 6,228 3,500 10,400ASIA1.7% 2,980 2,500 1,600 5,800NORTH AMERICA0.8% 11,500 12,500 9,000 13,0000.6%1---United StatesRest of the WorldLATIN AMERICA & THE CARIBBEAN1 Dash-indicates fewer than three people or less than 1% reported salary information.OFFER SOURCEREASON ACCEPTEDGrowth Potential28.5%Job Function25.5%Industry23.1%Prestige of Firm6.3%People/Corporate Culture6.0%Commitment to Social Impact4.8%Commitment to ool FacilitatedJob Postings (MIT or Sloan)36.9%Interviews through On-campus Recruiting14.6%Faculty/CDO/Sloan Student Referral6.2%Alumni4.0%MIT/Sloan Sponsored Events3.7%Club Event3.0%Other School Facilitated1Student Facilitated1MIT SLOAN MBA EMPLOYMENT REPORT 2021-2022 Page 1470.3%1.9%29.7%Personal Network13.5%Contacted Directly7.8%Online Job Postings7.0%Previous Employer1.1%Other Student Facilitated0.3%Other School Facilitated includes Action Learning Labs, Martin Trust Center for MITEntrepreneurship, consortiums, and early recruiting events.
NONDISCRIMINATION POLICY: COMMITMENT TO EQUAL OPPORTUNITYThe Massachusetts Institute of Technology is committed to the principle of equal opportunity in education and employment. The Institute prohibitsdiscrimination against individuals on the basis of race, color, sex, sexual orientation, gender identity, pregnancy, religion, disability, age, genetic information,veteran status, national or ethnic origin in the administration of its educational policies, admissions policies, employment policies, scholarship and loanprograms, and other Institute administered programs and activities; the Institute, however, favor US citizens or residents in admissions and financial aid.*The Vice President for Human Resources is designated as the Institute’s Equal Opportunity Officer. Inquiries concerning the Institute’s policies, compliancewith applicable laws, statutes, and regulations, and complaints may be directed to Ramona Allen, Vice President for Human Resources, Building NE49-5000,617-324-5675. In addition, inquiries about Title IX (which prohibits discrimination on the basis of sex) may be directed to the Institute’s Title IX coordinator,Sarah Rankin, Room W31-223, 617-324-7526,titleIX@mit.edu. Inquiries about the laws and about compliance may also be directed to the US Department ofEducation, Office for Civil Rights, Region I, 5 Post Office Square, 8th Floor, Boston, MA 02109-3921, 617-289-0111, OCR.Boston@ed.gov.*TheROTC programs at MIT are operated under Department of Defense (DoD) policies and regulations, and do not comply fully with MIT’s policy ofnondiscrimination with regard to gender identity. MIT continues to advocate for a change in DoD policies and regulations concerning gender identity, and iscommitted to providing alternative financial assistance under a needs-based assessment to any MIT student who loses ROTC financial aid because of theseDoD policies and regulations.ACCURACY IN REPORTING EMPLOYMENT STATISTICSThe MIT Sloan School of Management adheres to the MBA Career Services & Employer Alliance(MBA CSEA) Standards for Reporting MBA Employment Statistics (mbacsea.org). Conformance tothis business school industry standard ensures accurate and comparable employment data.Currently, the majority of the leading MBA programs adhere to these accepted reporting standards.MIT Sloan takes a leadership role to promote the importance of accurate and comparableemployment and salary statistics to prospective students and employers.MIT SLOAN MBA EMPLOYMENT REPORT 2021-2022 Page 15
2 The Boston Consulting Group includes BCG Digital. 1922 Investment 1upHealth 22North Ventures A24 Abiomed The Action Network Activision Blizzard Adobe Advent International Corp Aeris Partners AES Corporation Agios Pharmaceuticals Airworks AlixPartners Alnylam Pharmaceuticals Altis S.A. Amaz