Transcription
PRIVATE INVESTMENTSAMAC PRIVATE INVESTMENTS SUBCOMMITTEESEPTEMBER 16, 2020
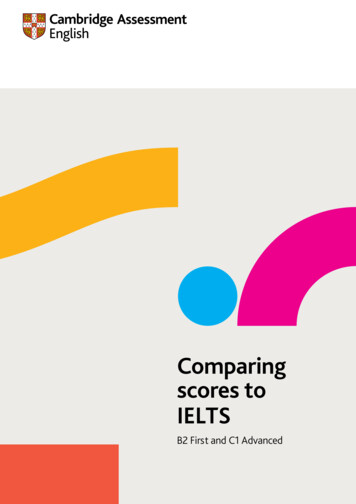
US Private Equity returns vs. public market returnsUS PRIVATE EQUITY: INTERNAL RATES OF RETURN AND MPME PUBLIC MARKET EQUIVALENTSAs of December 31, 2019Sources: Cambridge Associates LLC, Frank Russell Company, Standard & Poor's and Thomson Reuters Datastream.Notes: Pooled private investment periodic returns are net of fees, expenses and carried interest. Private equity includes buyouts and growth equity. Multi-year annualized returns aregenerated for time periods ending December 31, 2019 using Data Mode 2020 Q1.Copyright 2020 by Cambridge Associates LLC. All rights reserved.page 1
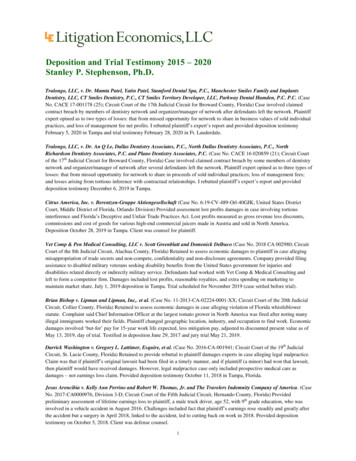
US Venture Capital returns vs. public market returnsUS VENTURE CAPITAL: INTERNAL RATES OF RETURN AND MPME PUBLIC MARKET EQUIVALENTSAs of December 31, 2019Sources: Cambridge Associates LLC Private Investments Database, Frank Russell Company, Standard & Poor’s and Thomson Reuters Datastream.Notes: Pooled private investment periodic returns are net of fees, expenses, and carried interest. Multi-year annualized returns are generated for time periods ending December 31, 2019using Data Mode 2020 Q1.Copyright 2020 by Cambridge Associates LLC. All rights reserved.page 2
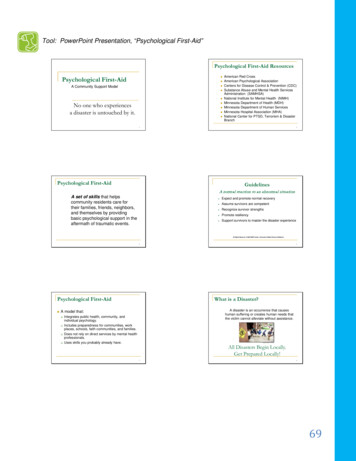
Private equity returns and risks vary by strategy and fund sizeUS PRIVATE EQUITY (VINTAGE YEARS 1986-2017): TVPIAs of March 31, 20203.5x3.0xNet to LP TVPI2.5x5% - 25%2.0x2nd Quartile3rd Quartile1.5x75% - 95%1.0xMedian0.5x0.0x 200mm 200mm- 500mm 500mm- 1.5bn 1.5bn- 5bn 5bn- 10bn nd 9X1.6X1.2X0.9XSource: Cambridge Associates LLC Private Investments Database.Notes: Pooled returns are net of fees, expenses and carried interest. Private equity includes buyouts and growth equity. Includes vintage years 1986-2017. Vintages after 2017 areconsidered too young to have meaningful returns.Copyright 2020 by Cambridge Associates LLC. All rights reserved.page 3
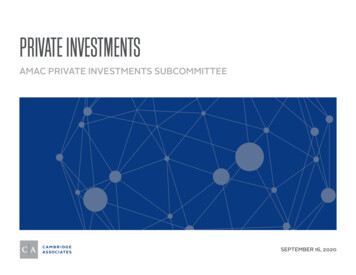
Return dispersion in alternative assets illustrates the opportunity . . . Selection is importantAVERAGE ANNUAL MANAGER RETURNS BY ASSET CLASSJanuary 1, 2005–December 31, 2019Average dispersion from median to 5th percentile:ALTERNATIVE ASSET STRATEGIES(available as active only)Average dispersion from median to 5th percentile:2.1%18.0%ACTIVELY MANAGEDLONG-ONLY STRATEGIESDispersion frommedian to 5th percentileManager re US Large Cap US Large Cap US Small CapPlus Global ex US US Small Cap Hedge Funds Global tyGlobalVentureCapital12231019Source: Cambridge Associates LLC. Copyright 2020 by Cambridge Associates LLC. All rights reserved.Notes: Returns for bond, equity, and hedge fund managers are average annual compound returns (AACRs) for the fifteen years ended December 31, 2019, and only managers withperformance available for the entire period are included. Returns for private investment managers are horizon internal rates of return (IRRs) calculated since inception toDecember 31, 2019. Time-weighted returns (AACRs) and money-weighted returns (IRRs) are not directly comparable. Cambridge Associates LLC’s (CA) bond, equity, and hedge fundmanager universe statistics are derived from CA’s proprietary Investment Manager Database. Managers that do not report in US dollars, exclude cash reserves from reported totalreturns, or have less than 50 million in product assets are excluded. Performance of bond and public equity managers is generally reported gross of investment management fees.Hedge fund managers generally report performance net of investment management fees and performance fees. CA derives its private benchmarks from the financial informationcontained in its proprietary database of private investment funds. The pooled returns represent the net end-to-end rates of return calculated on the aggregate of all cash flows andmarket values as reported to Cambridge Associates by the funds’ general partners in their quarterly and annual audited financial reports. These returns are net of management fees,expenses, and performance fees that take the form of a carried interest. Vintage years include 2005–2016.page 4
Correlations also vary by fund strategy and size, providing more diversification at lower endCORRELATION TO RESPECTIVE PUBLIC MARKET MPMEs: GLOBAL BUYOUTSAs of September 30, 2018S&P 500Russell 2000Russell 2500Russell MidcapMSCI ACWIGlobal Mega Cap PE Funds0.610.590.610.630.62Global Large Cap PE Funds0.590.540.570.580.60Global Mid Cap PE Funds0.270.170.200.230.28Global Small Cap PE Funds0.440.380.410.440.53CORRELATION TO RESPECTIVE PUBLIC MARKET MPMEs: US BUYOUTSAs of September 30, 2018S&P 500Russell 2000Russell 2500Russell MidcapMSCI ACWIUS Mega Cap PE Funds0.620.610.640.650.62US Large Cap PE Funds0.590.560.590.590.57US Mid Cap PE Funds0.420.350.370.380.43US Small Cap PE Funds0.380.360.370.360.41Source: Cambridge Associates LLC Private Investments Database. Copyright 2020 by Cambridge Associates LLC. All rights reserved.Notes: Data as of September 30, 2018. Vintage years included are 1995–2015 for Mega Cap and 1988–2015 for Large, Mid, and Small Cap. By Cambridge benchmark definitions, Megafunds don’t date back further than 1995. Funds raised after 2015 are considered to young to have produced meaningful results. Data shows the correlation between the return of eachsub grouping and the return of respective public mPME. Mega is defined as 10B from 2006–2015, 3.5B from 2000–2005, and 1B 1995–1999. Large is defined as 1B to 10B from2006-2015, 1B to 3.5B from 2000–2005, 750M to 1B from 1997–1999, 500M to 1B from 1995–1996, 500M from 1993–1994, and 300M from 1988–1992. Mid is defined as 350M to 1B from 2000–2015, 250M to 750M from 1997–1999, 200M to 500M from 1995–1996, 100M to 500M from 1993–1994, and 100M to 300M from 1988–1992. Small is defined as 350M from 2000–2015, 250M from 1997–1998, 200M from 1995–1996, and 100M from 1988–1994.page 5
It’s not just LBOs — The investable universe is expanding in all directionsPRIVATE INVESTMENTS 2.0 (2005–PRESENT)Capital Concentration Estimation – for illustration purposes onlyAsset ManagementInvesting(Mature/Seed)Public / PrivateSPACsPE/GP CapitalSolutionsBuy-and-BuildOperational PELong-Dated FundsDirectsPlain VanillaPrivate ingPrivate”VC/GESector FundsGrowth EquityUncorrelatedVenture CapitalDistressedValue Oriented(May include leverage as strategy)Sector-Focused DirectSecondaries (VC/PE)Growth BuyoutsPrivate CreditGDP- or NeutralDirect Secondaries (VC/PE)GDP /-Plain Vanilla(Leverage)GDP Growth Oriented(Low to no leverage)Company TrajectorySource: Cambridge Associates LLC.Copyright 2020 by Cambridge Associates LLC. All rights reserved.page 6
Private Equity is an expensive form of capital – GPs extract a lot of the valueIRR Spread- Gross to Net12009591000800IRR Spread(Basis Points)6226636166004002392000Pooled All Vintages(1986-2014)Average All Vintages(1986-2014)Average Worst 5 Vintages Average (VY 1986-2010) Average Best 5 VintagesSource: Cambridge Associates LLC Private Investments Database. Copyright 2020 by Cambridge Associates LLC. All rights reserved.Notes: Includes Growth Equity, Buyout, Subordinated Capital and Private Equity Energy funds and investments; Data as of 2015 Q4.page 7
Copyright 2020 by Cambridge Associates LLC. All rights reserved.This report may not be displayed, reproduced, distributed, transmitted, or used to create derivative works in any form, in whole or in portion, by any means,without written permission from Cambridge Associates LLC (“CA”). Copying of this publication is a violation of US and global copyright laws (e.g., 17 U.S.C.101 et seq.). Violators of this copyright may be subject to liability for substantial monetary damages.This report is provided for informational purposes only. The information does not represent investment advice or recommendations, nor does it constitutean offer to sell or a solicitation of an offer to buy any securities. Any references to specific investments are for illustrative purposes only. The informationherein does not constitute a personal recommendation or take into account the particular investment objectives, financial situations, or needs of individualclients. Information in this report or on which the information is based may be based on publicly available data. CA considers such data reliable but does notrepresent it as accurate, complete, or independently verified, and it should not be relied on as such. Nothing contained in this report should be construed asthe provision of tax, accounting, or legal advice. Past performance is not indicative of future performance. Broad-based securities indexes are unmanagedand are not subject to fees and expenses typically associated with managed accounts or investment funds. Investments cannot be made directly in an index.Any information or opinions provided in this report are as of the date of the report, and CA is under no obligation to update the information or communicatethat any updates have been made. Information contained herein may have been provided by third parties, including investment firms providing informationon returns and assets under management, and may not have been independently verified.The terms "CA" or "Cambridge Associates" may refer to any one or more CA entity including: Cambridge Associates, LLC (a registered investment adviserwith the US Securities and Exchange Commission, a Commodity Trading Adviser registered with the US Commodity Futures Trading Commission andNational Futures Association, and a Massachusetts limited liability company with offices in Arlington, VA; Boston, MA; Dallas, TX; Menlo Park, CA, New York,NY; and San Francisco, CA), Cambridge Associates Limited (a registered limited company in England and Wales, No. 06135829, that is authorised andregulated by the UK Financial Conduct Authority in the conduct of Investment Business, reference number: 474331); Cambridge Associates Limited, LLC (aregistered investment adviser with the US Securities and Exchange Commission, an Exempt Market Dealer and Portfolio Manager in the Canadian provincesof Alberta, British Columbia, Manitoba, Newfoundland and Labrador, Nova Scotia, Ontario, Québec, and Saskatchewan, and a Massachusetts limited liabilitycompany with a branch office in Sydney, Australia, ARBN 109 366 654), Cambridge Associates Investment Consultancy (Beijing) Ltd (a wholly ownedsubsidiary of Cambridge Associates, LLC which is registered with the Beijing Administration for Industry and Commerce, registration No.110000450174972), and Cambridge Associates Asia Pte Ltd (a Singapore corporation, registration No. 200101063G, which holds a Capital Market ServicesLicense to conduct Fund Management for Accredited and/or Institutional Investors only by the Monetary Authority of Singapore).
Hedge fund managers generally report performance net of investment management fees and performance fees. CA derives its priva te benchmarks from the financial information contained in its proprietary database of private investment funds. The pooled returns represent the net endto--end rat