Transcription
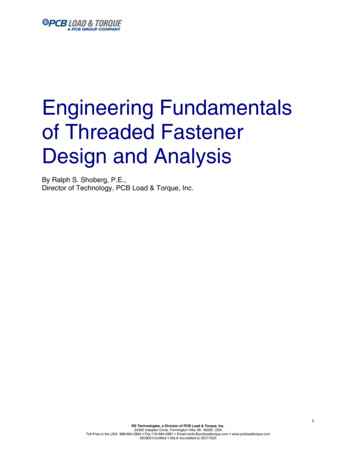
Engineering Fundamentalsof Threaded FastenerDesign and AnalysisBy Ralph S. Shoberg, P.E.,Director of Technology, PCB Load & Torque, Inc.1RS Technologies, a Division of PCB Load & Torque, Inc.24350 Indoplex Circle, Farmington Hills, MI 48335 USAToll-Free in the USA 888-684-2894 Fax:716-684-0987 Email:rsinfo@pcbloadtorque.com www.pcbloadtorque.comISO9001Certified A2LA Accredited to ISO17025
Table of Contents1.0 Introduction: Engineering Fundamentals of the Tightening Process . 31.1 Energy Transfer. 31.2 Modeling the Tightening Process . 31.3 Where Does the Torque Go? 41.4 Elastic Torque-Tension Relationship 51.5 Stress/Strain vs. Torque/Tension .51.6 Correlation of Stress-Strain and Turn . 61.7 Force-Deformation and Torque-Angle Diagrams 71.8 Preload-Preload Efficiency Factor .71.9 Torque-Tension Correlation Coefficient 81.10 Thread/Underhead Friction Measurements 81.11 Automated Tightening Process 92.0 Torque-Angle-Tension Control 92.1 Introduction . 92.2 Torque-Angle-Signature 102.3 Torque-Angle Signature Analysis 112.3.1 Tightening Curve 122.3.2 Elastic Origin . 122.3.3 Loosening Curve 122.3.4 Beyond Yield 132.3.5 Loosening Tendencies 132.3.6 Accurate Measurement 132.3.7 Torque-Angle Signature Analysis Summary .142.4 Clamp Force/Strength Considerations . 142.5 Modeling the Tightening Process 142.6 Torque-Tension Coefficient: Nut Factor, K . 162.7 Experimental Determination of Friction Coefficients . 172.8 Thread/Underhead Friction Coefficient Measurements 172.9 M-Alpha Diagram . 182.10 FM-Alpha Diagram . 192.11 Estimating the Tension-Angle Coefficient 202.11.1 Ultrasonic Stretch . 202.11.2 Strain-Gaged Bolt . 202.11.3 Force Washer . 212.11.4 Model-Calculation: Estimate of Angle-Tension Coefficient 212.11.5 Laboratory Measurement of Friction Coefficients . 222.11.6 Material Property-Yield . 232.12 Torque-Angle Tension Control Summary . 233.0 Torque-Tension Audits 253.1 Introduction . 253.2 Hand Torque Audit-Tool Torque Capability . 263.3 Tool Torque Capability/ISO 5393 . 263.4 Release Angle-Tension Audit . 263.5 Loosening-Embedment or Loss of Preload . 293.6 Measurements Verify Fastener Torque and Tension 294.0 Other Strategies . 334.1 Torque-Turn-To-Yield . 334.2 Prevailing Torque Locknut Signature Analysis 334.3 Hand Torque Tightness Quality Audits . 334.3.1 Redefining The Audit . 344.3.2 Hand Torque Audit Qualification 365.0 Using Torque Angle Records to Determine Joint Stiffness . 366.0 Material Yield Point 387.0 Glossary of Important Terms . 388.0 References . 392RS Technologies, a Division of PCB Load & Torque, Inc.24350 Indoplex Circle, Farmington Hills, MI 48335 USAToll-Free in the USA 888-684-2894 Fax:716-684-0987 Email:rsinfo@pcbloadtorque.com www.pcbloadtorque.comISO9001Certified A2LA Accredited to ISO17025
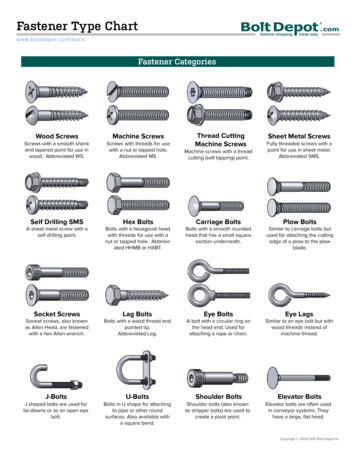
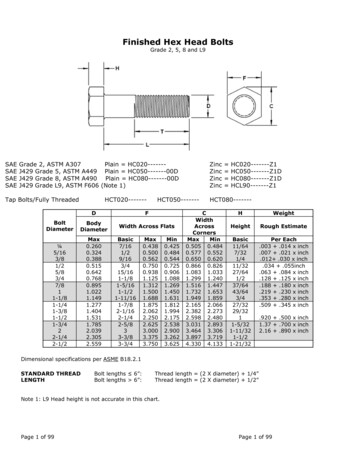
1.0 Introduction: Engineering Fundamentals of the Tightening ProcessThe process of tightening threaded fastener assemblies, especially for critical bolted joints, involvescontrolling both input torque and angle of turn to achieve the desired result of proper preload of the boltedassembly. Understanding the role of friction in both the underhead and threaded contact zones is the keyto defining the relationship between torque, angle, and tension.There can be as many as 200 or more factors that affect the tension created in a bolt when tighteningtorque is applied (refer to paragraph 2.2). Fortunately, torque-angle signature curves can be obtained formost bolted joints.By combining the torque-angle curves with a few simple calculations and a basic understanding of theengineering mechanics of threaded fasteners, you can obtain the practical information needed to evaluatethe characteristics of individual fastener tightening processes. The torque-angle curves can also providethe necessary information to properly qualify the capability of tightening tools to properly tighten a givenfastener.1.1 Energy TransferTightening threaded fasteners is basically an energy transfer process as shown in Figure 1. The areaunder the torque-angle curve is proportional to the energy required to tighten the fastener.Figure 1 Tightening Fasteners Transfers Energy1.2 Modeling the Tightening ProcessAchieving proper control of the tightening process ispossible only if you understand the relationship betweentorque and turn in the development of tension.Before studying tightening methods, it is necessary tobecome familiar with what actually happens when afastener is tightened. The process of tightening afastener involves turning, advance of the lead screw,and torque, turning moment, so that preload, tension, is produced in the fastener. The desired result is aclamping force to hold components together.Figure 2. Four Zones of the Tightening ProcessThe most general model of the torqueturn signature for the fastener tighteningprocess has four distinct zones asillustrated in Figure 2.The first zone is the rundown orprevailing torque zone that occurs beforethe fastener head or nut contacts thebearing surface.The second zone is the alignment orsnugging zone wherein the fastener andjoint mating surfaces are drawn intoalignment to achieve a “snug” condition.3RS Technologies, a Division of PCB Load & Torque, Inc.24350 Indoplex Circle, Farmington Hills, MI 48335 USAToll-Free in the USA 888-684-2894 Fax:716-684-0987 Email:rsinfo@pcbloadtorque.com www.pcbloadtorque.comISO9001Certified A2LA Accredited to ISO17025
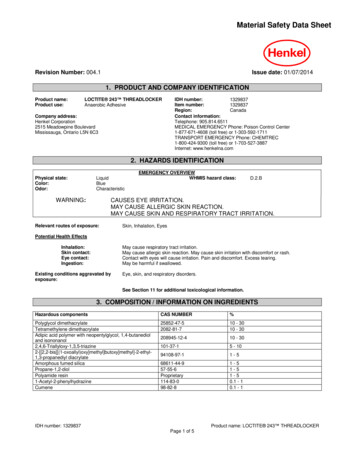
The third zone is the elastic clamping range, wherein the slope of the torque-angle curve is essentiallyconstant.The fourth zone is the post-yield zone, which begins with an inflection point at the end of the elasticrange. Occasionally, this fourth zone can be due to yielding in the joint or gasket, or due to yield of thethreads in the nut or clamped components or nut rather than to yield of the fastener.NOTE: A more detailed discussion of the four tightening zones is presented in section 2.5.In the special case where prevailing torque locking features are employed, the model includes anadditional prevailing torque zone. In a more general sense, the prevailing torque can be the result offrictional drag on the shank or threads due to the misalignment of the parts, to chips or other foreignmaterial in the threads, or due to out of tolerance threads with unintended interference.The nonlinear alignment zone is a complex function of the process of drawing together of the matingthreads, bending together of mating parts, and bending of the fastener as a result of non-parallelism ofthe bearing surface to the fastener underhead surface. These factors are referred to as macro effects.The alignment zone also has what is referred to as micro components. The micro effects include contactstress defections of plating and coatings as well as surface and thread deformations. These effects areillustrated in Figure 3.Figure 3. Alignment Zone1.3 Where Does the Torque Go?The basic torque distribution for a fastener is illustrated in Figure 4. The torque applied to a fastener isabsorbed in three main areas. First, there is underhead friction, which may absorb 50 percent or more ofthe total torque. Thread friction absorbs as much as 40 percent of the applied torque. The final 10 percent4RS Technologies, a Division of PCB Load & Torque, Inc.24350 Indoplex Circle, Farmington Hills, MI 48335 USAToll-Free in the USA 888-684-2894 Fax:716-684-0987 Email:rsinfo@pcbloadtorque.com www.pcbloadtorque.comISO9001Certified A2LA Accredited to ISO17025
of the applied torque develops the clamping force that holds the components together. Thus an increasein either friction component of 5% can reduce tension by half.Figure 4. Where Does the Torque Go?As shown previously, the area under the torque-angle curverepresents the total energy required to tighten a fastener. Asshown in Figure 5, the upper 10 percent of the area on thecurve represents the elastic clamping energy that is providingthe holding power to clamp the parts together. The elasticclamping energy shown on the torque-angle plot has thesame value as the areas under the bolt and clampedcomponent lines in the Force-Deformation Diagram (refer toFigure 9).Figure 5. Where Does the Fastening Energy Go?Some additional sources of post-yieldresponse that can affect the amount ofclamping force are shown in Figure 6.Figure 6. Sources of Post-Yield Response1.4 Elastic Torque-Tension RelationshipA practical starting point for all threaded fastener tighteninganalysis is to use the basic elastic torque-tension equation,T K*D*F, to estimate the relative magnitudes of torque and clamp force. Starting with this equation,which defines a linear relationship between torque and tension, you can develop models for the tighteningprocess.T KDFWhere:T Torque (in-lb)K Nut Factor (Ranges from 0.03 to 0.35)D Nominal Diameter (inches)F Force (lb)1.5 Stress/Strain vs. Torque/TensionIt is very helpful to picture the approximate equivalence of the stress-strain curve to the torque versusangle curve as illustrated in Figure 7 (note that the alignment zone has been removed from the torqueangle diagram). Deformation of the fastener and angle of turn are geometrically related by the followingformula.5RS Technologies, a Division of PCB Load & Torque, Inc.24350 Indoplex Circle, Farmington Hills, MI 48335 USAToll-Free in the USA 888-684-2894 Fax:716-684-0987 Email:rsinfo@pcbloadtorque.com www.pcbloadtorque.comISO9001Certified A2LA Accredited to ISO17025
Figure 7. Relationship of Stress-Strain vs. Torque-AngleThis relationship correlates directly with the stressinduced total strain in the fastener only when thefastener is tightened on a joint with infinite stiffness.Extensive testing has proven that the tensionproduced can be shown to be directly proportionalto the angle of turn from the Elastic Origin. Theelastic origin is located by projecting a line tangentto the elastic portion of the torque-angle curvebackward to zero torque. The total angle of turn isequal to the compression of the clampedcomponents plus the stretch of the fastener as shown in Figure 8.Figure 8. Angle of Turn is Proportional to Clamp Force1.6 Correlation of Stress-Strain and TurnThe basic relationship of stress to strain in theelastic region is given by the followingequation.The stretch of a bolt or metal rod loaded in tension is calculated by use of the following equation.If the turn-to-tension procedure is used to establish clamping load, it is necessary to know both the springrate of the bolt and the spring rate of the clamped components, since turning the bolt stretches thefastener and compresses the parts being clamped. A simple experimental procedure for estimating approximate joint and bolt stiffness is outlined in paragraph 5.0.The slope of the Force-Angle of Turn relationship can be represented by the following equation.Where:KB bolt spring rate (lb/in)KC joint spring rate (lb/in)Taking the first derivative of the basic equation T K*D*F yields the following relationship.6RS Technologies, a Division of PCB Load & Torque, Inc.24350 Indoplex Circle, Farmington Hills, MI 48335 USAToll-Free in the USA 888-684-2894 Fax:716-684-0987 Email:rsinfo@pcbloadtorque.com www.pcbloadtorque.comISO9001Certified A2LA Accredited to ISO17025
Substituting for F in the Force-Angle of Turn equation results in a Torque-Angle slope equation shownbelow that can be used to estimate the spring rate of bolted joints.The spring rate of the bolt is estimated by the following equation.Next, the slope of the elastic clamping region of the Torque-Angle Curve, T/ Θ, is determined from thecurve. If a value for K is assumed, then the spring rate for the joint is calculated as follows.1.7 Forcer-Deformation and Torque-Angle DiagramsSimilar to the correlation between the material Stress-Strain Diagram and the Torque-Angle Diagram, it ispossible to illustrate correlation between the classic Force-Deformation Diagram and a special TorqueAngle Diagram shown in Figure 9. This special diagram illustrates the relative angular motion required toboth stretch the fastener and compress the joint. The factors depicted in Figure 9 are identified in Table 1.Figure 9. Force-Deformation and Torque-Angle Diagrams1.8 Preload-Preload Efficiency FactorAs can be seen from the Force-Deformation Diagram, the bolted joint responds in a predictable mannerwhen subjected to external working loads. Preload efficiency factors, based upon the effective springrates of the bolt and the clampe
A practical starting point for all threaded fastener tightening analysis is to use the basic elastic torque-tension equation, T K*D*F, to estimate the relative magnitudes of torque and clamp force.File Size: 2MBPage Count: 39