Transcription
1The Older Populationin the United Stateslearning objectives1.1 Demonstrateknowledge of changingdemographics of the U.S.population, especially asrelated to aging.1.2 Describe the increasingdiversity among the olderpopulation and its socialimpact.1.3 Discuss the need to planand prepare for an agingpopulation.10M02 HOOY7643 01 SE C01.indd 103/7/14 10:55 AM
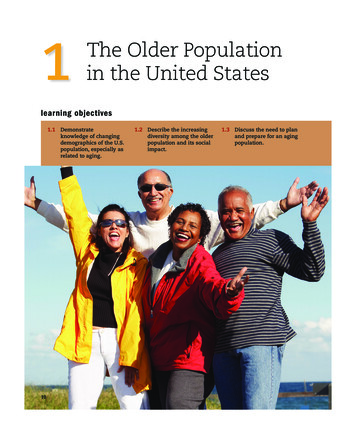
Chapter 1 The Older Population in the United StatesListen to the Chapter AudioYou have probably heard of baby boomers—the cohort orgroup of people born between 1946 and 1964, a periodstarting just after the end of World War II and one ofprosperity and growth for the United States. Perhaps yourparents or grandparents are part of this cohort, which aregroups of people born at approximately the same time spanand therefore share many common life and historical experiences and characteristics. This g eneration was born andspent their youth in an affluent, economically booming era.They experienced upheaval during their high school andcollege years, including protests against the Vietnam War;rock “n” roll, drugs and the sexual revolution; and the CivilRights and women’s movements. Having come of age during the tumultuous period of the 1960s and early 1970s,baby boomers may be the first U.S. generation to experience a mixture of national pride and cynicism about therole of their country in the world. They are more highlyeducated, are healthier, have a higher percent of womenin the labor force, are more likely to hold professional andmanagerial jobs, and are more diverse than prior cohorts.Of course, there are exceptions to these patterns, especiallybecause some baby boomers have seen their incomes andretirement savings markedly decline during the GreatRecession that began in 2008. Just as baby boomers redefined lifestyles when they were younger, they are nowchanging what it means to grow old in America. And aprimary reason that we hear so much about this generationis that since January 2011, 10,000 baby boomers turn age65 each day. Currently numbering 79 million, they are partThe baby boomers—or the young-old—tend to be healthier andmore active than previous generations of older adults.M02 HOOY7643 01 SE C01.indd 1111of a phenomenon sometimes also referred to as the “seniorboom” (Administration on Aging (AoA), 2012; Frey, 2010).In this chapter, we will provide you with an overview ofthe older adult population in the United States. This includes: Changing demographics of the U.S. populationLife expectancy and life spanRapid growth of the old-old and oldest-oldIncreasing diversity among the older populationTrends for the future: Increased longevity in health ordisease?Changing Demographicsof the U.S. PopulationThe senior boomers are changing the demographics of ourcountry. By this we mean the characteristics of our population, such as its size, distribution of the very old and thevery young, and geographic location. Demographic trendsdescribe the changes in such characteristics over time.The long-range trend—and the focus of this book—is population aging, which refers to the sheer increase in thesize of the population age 65 and older and a gain in theaverage age of a population. Population aging—fueled bybaby boomers—is one of the most dramatic demographicchanges in the United States and worldwide and is illustrated in Figure 1.1. Indeed, there is no historical p recedentfor population aging in any society around the world. Itis the result of declines in birthrates and death rates, anddiffers from the individual aging process—or the physiological, psychological, and social changes of aging that wediscuss throughout this book. We also consider other demographic characteristics such as race, ethnicity, gender, socialclass, education, sexual orientation, functional ability, andhealth status that impact the process of individual aging—sometimes more so than does chronological age. In 1900, people age 65 and older accounted for about4 percent of the U.S. population—less than 1 in 25. By 2011, slightly more than 100 years later, they hadgrown to over 40 million, or almost 13.1 percentof the population. People over age 65 increased byalmost 13 times during this period, compared with athreefold increase in the population under age 65. For the first time in history, by 2020, there will be morepeople age 65 and older than children under age 5.3/7/14 10:55 AM
12Chapter 1 The Older Population in the United States100 Year TimespanOver 65 Increase by 13xUnder 65 Increase by 3xPeople age 65 and older 4% of the U.S. populationPeople age 65 and older just under13% of the U.S. population190020092020More people age 65 and olderthan children under 5 years old2050People age 65 and older 20% of the U.S. population100% increase over 30 yearsCompared to 30% increase inoverall populationFigure 1.1Population Aging, 1900–2050Source: AoA 2012, “A Profile of Older Adults in America: 2011.” By 2050, people age 65 and older may comprise nearly87 million, more than twice their current number, orabout 21 percent of the population. This represents aprojected 147 percent increase since 2000, comparedwith a 49 percent growth in the overall populationduring the same time period (AoA, 2012; Howden &Meyer, 2011; U.S. Census Bureau News, 2011b).points to ponderTake a moment to reflect on what you know aboutthe generation that came of age during the 1960s.Are your parents or perhaps your grandparents babyboomers? What have they told you about that timeperiod? Were they engaged in any of the protests thatburst onto the national scene? How did their experiences in the 1960s affect them in middle age andnow in old age?Changes in Life ExpectancyWhy is the older population growing so rapidly? Chieflybecause of increasing life expectancy—quite simply, people are living longer. Keep the term life expectancyM02 HOOY7643 01 SE C01.indd 12(i.e., the average length of time one could expect to live ifone were born in a particular year and if death rates wereto remain constant) in mind as we refer to it throughoutthe book. In 1900, the average life expectancy at birth in theUnited States was 47 years. Today it is 30 years longer—slightly more than 78 years. It will be in the mid-eighties by 2050 (AoA, 2012;Federal Interagency Forum, 2012; U.S. Census BureauNews, 2011).But population aging is also due to falling birthrates; whenchildren are a smaller percent in the population, the averageage of the population increases. In recent years, the birthratein the U.S. has been declining. For teens ages 15–19 and forwomen in their early twenties, for example, the birthrate hitrecord lows in 2012 (Hamilton, Martin, & Ventura, 2013).Look around your classroom. Four out of five of yourclassmates can expect to reach age 65, at which point there isa better than 50 percent chance for them to live past age 80.In fact, people who make it to age 65 today have an averagelife expectancy of an additional 19.2 years. This is a dramaticimprovement from the early twentieth century, when it was12.3 more years (Federal Interagency Forum, 2012).The increase in life expectancy and the declining birthrate underlie an unusually rapid rise in the median age3/7/14 10:55 AM
Chapter 1 The Older Population in the United Statesof the U.S. population—from 28 in 1970 to over 37 yearscurrently. This means that half the population is older than37 years and half younger. The median age will rise as evenmore Americans live into their eighties and nineties by 2030(Howden & Meyer, 2011).The world’s oldest person changes often as verifiedrecord-holders die and are replaced by the next in line. Forexample, when Mr. Jiroemon Kimura, the world’s oldestperson—at the time—died in Japan in June 2013 at theage of 116, “the oldest person in the world” title passedon to another Japanese citizen, Ms. Misao Okawa, whowas verified to be 115 years old. Sometimes individualsclaim to be older than the person who is reported to bethe o ldest person in the world, but those claims cannotbe independently verified (Hume, 2013).points to ponderYou are learning about how people in the UnitedStates and many other parts of the world are living longer than they have in previous generations. Inyour opinion, is living a long life always a good thing?Or are there things that you would fear about living along time? Try completing this statement: “I would liketo live a long life—into my nineties or longer—if . . .”What are the personal and societal factors that wouldcontribute to the quality of a long life?It may surprise you to learn that the U.S. life expectancy lags behind that of 51 other countries. This is truedespite the fact that U.S. medical expenditures, often forgroundbreaking medical technology, are the highest in theworld. Why do you think this might be the case? Factorssuch as better prenatal and early childhood services, moreaccess to health care, and healthier foods in other countriescontribute to their higher life expectancy rates at birth thanthose in the United States. Life expectancy in the UnitedStates is not rising as fast as it once was and is actuallydeclining in the South. Increasing rates of poverty, obesity,heart disease, and diabetes along with past high rates ofcigarette smoking may be contributing factors. Life expectancy may also be related to growing income inequality.When compared with 32 other developed countries, theUnited States has the third greatest disparity between itsrichest and poorest citizens. Only Singapore and HongKong have worse disparities (The Commonwealth Fund,2011; Muennig & Glied, 2011).M02 HOOY7643 01 SE C01.indd 1313Calculating Your Own Life ExpectancyYou can calculate your own life expectancy online. Youwill see how important lifestyle factors, such as nutrition, exercise, and not smoking, are to how long you arelikely to live. Developed by Dr. Thomas Perls, a highlyregarded geriatrician who has studied centenarians, theLiving to 100 Life Expectancy Calculator not only tells youhow long you are likely to live, but it also offers personalized feedback from Dr. Perls on ways to live longer. TryGoogling this life expectancy calculator or another one onthe Web and plugging in your own numbers (Blow, 2011;Boyles, 2011; DyBunco, 2011).Throughout this book, we will give numerous examples of lifestyle choices that can increase your chances ofaging in a healthy manner. If you are a 20-year-old readingthis, you will probably live well into your eighties, b arringaccidents or natural disasters. Consider what your lifemight be like then by completing the “When I am age 80”exercise on page 14.Most gains in life expectancy have occurred in theyounger ages, largely due to the eradication of many diseases that caused high infant and childhood mortality.Maternal, infant, and early childhood death rates havedeclined considerably, primarily because of improvedsanitation, antibiotics, and advances in medicine. But theincrease in life expectancy is also due to medical advancesin middle and old age. A hundred years ago, adults generally died from acute diseases, particularly influenza andpneumonia. Few people survived long enough to needcare for chronic or long-term conditions. Today, deathfrom acute diseases is rare. The result is a growing number of people who survive to old age, but often with oneor more chronic diseases that require long-term services and supports. For example, heart disease and cancerhave become less fatal because of medical breakthroughs.Instead, they have become chronic illnesses, with manyolder adults who may keep on living for years with these“killer” conditions. Because of these shifts, health careproviders refer to the need for chronic disease management rather than a cure. Indeed, medical advances suchas stem cell therapy are likely to postpone deaths fromheart disease and cancer even more. In the near term,however, gender and racial differences in life expectancyare likely to persist.3/7/14 10:55 AM
14Chapter 1 The Older Population in the United StatesWhen I Am Age 80What will your life be like at age 80?Physical: Assume that you will get at least one major disease that runs in your family. You may already havesome signs of that illness or disability now. Look at themembers of your family, and extrapolate what physicalproblems you might have as well as physical advantages. Think about your five senses and which of them willhave been impacted by aging and to what degree. Willyou be able to communicate verbally or will you have torely on nonverbal means of communication?Social: What kind of a family and personal lifestyle willyou have when you are older? What type of living situation will you be in? Will you have any hobbies? Wherewill you go when/if you go out? How will you get thereand with whom (e.g., your spouse, partner, adult child,neighbor)?Financial: What will your finances be like when you areolder? Extrapolate from how you handle money currentlyin your life. Are you a saver or a spender? Will you havea retirement pension or will you have to rely entirely onSocial Security?Emotional/Mental: What kind of individual will you be?Research shows that our personalities do not changesignificantly as we age, but we become more like our“true selves” as a result of loss, change, stress, andillness. For example, if you now become irate fairly easily in traffic, what will you be like in the dining room ofa group-living situation as you wait for your food to beserved? How will you adapt to new technologies and social values? What will you do to keep your mind as sharpas possible?Spiritual: How important will religion or spirituality be toyou? Extrapolate from how important it is to you now.How will you practice your faith, or if you have none,what will be most important to you as you think aboutyour own death?Legacy: Since you are 80, you are thinking about whatyou will leave behind, in terms of both tangible itemsand intangible qualities about yourself. What will yoube remembered for or what would you like to be remembered for?Add in other things that you feel will be important to you atthat age, or concerns that you will have that are not on thelist. And then think about changes you might make in yourlife now to increase your chances of an active old age. Whatdid you learn from this that may affect how you view olderadults and aging?M02 HOOY7643 01 SE C01.indd 14Gender Differences in LifeExpectancyIf you are at a social gathering of older adults, you may seemore women in attendance than men—a sign men andwomen differ in how long they live: On average, females born today will live 5–6 years longer than men: 80.8 years compared to 75.7, respectively. Even at age 85, female life expectancy is an additional 6.8 years compared to 5.7 years for males(Federal Interagency Forum, 2012; U.S. CensusBureau, 2011).No one fully understands why women live longerthan men, but several different explanations are supported by research. Women’s longer life expectancy maybe due to a combination of biological factors, such asthe genetic theory that the female’s two X chromosomesmake her physiologically more robust, and of lifestylefactors, such as women’s greater likelihood of preventive health behaviors and their lower rates of smoking, substance abuse, and other high-risk behaviors acrossthe life course. However, men who survive beyond age85 are also likely to be “ hardier”—to have fewer chronicillnesses or disabilities (AoA, 2012; Federal InteragencyForum, 2012).As a result of these differences in life expectancy: Women represent 58 percent of the population age 65and older, and nearly 70 percent of those over age 85.This means that there are approximately 135 womenfor every 100 men age 65 and older. Women at age 85 and over outnumber their malecounterparts by five to two and among centenariansby three to one (AoA, 2012; Federal InteragencyForum, 2012; U.S. Census Bureau, 2011).This pattern of increasing proportions of women relativeto men after age 65 in 2010, 2030, and 2050 is shown inFigure 1.2 on page 15.Racial Differences in LifeExpectancyGiven their experiences of historical disadvantage acrossthe life course, it is not surprising that elders of color inour country have a lower life expectancy than whites. Forexample, life expectancy at birth is approximately fiveyears higher for white people than for African Americans.3/7/14 10:55 AM
Chapter 1 The Older Population in the United States1580%Percent Female of the Population70%60%675755 555854 535262 6156 5550%40%30%20%10%0%65 Years and Older65 to 74 Years201075 to 84 Years203085 Years and Older2050Figure 1.2 Percent Female for the Older Population by Age for the UnitedStates: 2010, 2030, and 2050Source: U.S. Census Bureau, 2010, “The Next Four Decades: The Older Population in the U.S.:2010–2050.”Figure 1.3 on p. 16 shows life expectancy at birth, by raceand sex in the United States. One factor that underliesAfrican Americans’ shorter life expectancy is health caredisparities—the current cohort of elders of color generallyhad unequal access to health care and preventive health services earlier in life. Consistent with the concept of the lifecourse, inequities experienced as children and young adultsin poverty, education, and health care are often intensifiedin old age, as reflected in lower life expectancy and morechronic illness. On the other hand, African Americans(especially men) who survive to age 75 tend to be the mostrobust of their cohort, so that their life expectancy after age75 is longer than for whites. This is known as the crossovereffect (Center for American Progress, 2010; FederalInteragency Forum, 2012; Sinn, 2011).As is true with the total population of elders, women ofcolor generally live longer than their male counterparts, withAsian American women living the longest. Among AfricanAmericans, the ratio of men to women age 65–75 is slightlylower than among other groups, because of higher deathrates among African American men at every age. Tragically,M02 HOOY7643 01 SE C01.indd 15some African American men do not live long enough toever collect Social Security, because of their high rates ofhomicides and accidents in young and mid-adulthood andof chronic illness in their early sixties. Oldest-old women arethe most rapidly growing group of African American elders,and they have the longest average remaining life expectancy.In contrast, there are proportionately more Latinomen to women over age 65 than among the white olderpopulation, even though Latina women live longer andoutnumber men. The slight increase in proportion ofmen is due to the higher mortality rate of Latinas thanwhite women at earlier ages, not to greater life expectancy among Latino men. Older Latino men marry orremarry more often than men in other groups of color:over 65 percent of older Latino males are married, butonly 39 percent of older Latinas. Latinas more oftenremain widowed and live alone than their male counterparts. Nevertheless, the percentage of older Latinas living alone is lower than that of the general population,while the percentage living with other relatives is almosttwice as high. This living arrangement points to the3/7/14 10:55 AM
16Chapter 1 The Older Population in the United States8580White femaleAge in Years75Black female70White male65600Black male1970Figure 1.31975198019851990Year199520002010Life Expectancy at Birth, by Race and Sex: United States, 1970–2010Source: U.S. National Center for Health Statistics, 2009.importance of extended family among Latinos (CDC,2011a; Russell, 2011).Compared to other older adults of color and towhite older persons, Asian-Pacific Islander (API) menoutnumber their female counterparts until they reach age75 and older. They also constitute a large percent of eldersliving alone. This pattern reflects the continuing influence of more API men than women immigrating in theearly part of the twentieth century to the United States,and past restrictions on female immigration, rather than ahigher life expectancy for men.Maximum Life SpanWomen across racial and ethnic groups tend to live longer than men.M02 HOOY7643 01 SE C01.indd 16Maximum life span is different from life expectancy; itis the length of years a given species could expect to liveif all environmental hazards were eliminated. Many scientists posit that there is a “soft limit” to the human lifespan in the range of 85–90 years, unless there was someway to alter the basic biological process of aging—a conclusion that has not changed in the past 20 years. Thereappears to be a maximum biologically determined lifespan for human cells, so that even with the eliminationof all diseases, we cannot expect to live much beyond120 years—despite what you may hear in the media. Forthese reasons, more persons will expect to live longer inthe future, but the maximum number of years they can3/7/14 10:55 AM
Chapter 1 The Older Population in the United StatesPercent Surviving100%TRAUMAIDEAL75%1980190050%25%0%0Figure 1.410203040 50 60Age in Years708090 100Ideal Rectangularization of the Survival CurveSource: Fries, 1980expect to live will not be increased dramatically, unlesssome extraordinary and unanticipated biological discoveries occur. The longest documented human life is ofJeanne Calment, a Frenchwoman who died at age 122(Olshansky, 2010).The ideal situation is one where all people wouldsurvive to the maximum life span, creating what is calleda “rectangular survival curve” (shown in Figure 1.4).About 50 percent of all babies born after 2000 in developed countries are expected to reach age 85, more thantwo-thirds of the maximum life span of 120 years. Wewill not achieve the ideal survival curve until the diseases of middle and young-old age—including cancer,heart disease, diabetes, and kidney diseases, along withobesity—can be totally prevented or at least effectively managed as chronic conditions, which is a scenario farin the future (Kochanek, Xu, Murphy, Minino, & Kung,2011; Pallarito, 2011).Population PyramidsPopulation pyramids visually capture the changing agedistribution of the American population—the shift inthe proportion of older adults in relation to youngerpersons. In 1900, when 4 percent of the U.S. population wasage 65 and over, 40 percent was under age 17. By 2005, reduced birthrates in the 1970s and 1980shad resulted in a decrease of young persons as a percent of the total population. By 2030, the percentages of young and old personsare predicted to be similar, with those under age 17M02 HOOY7643 01 SE C01.indd 1717forming 23.5 percent of the population, and olderadults almost 20 percent. After 2030, the median age will be around 39 years,and the death rate will be greater than the birthratebecause baby boomers will then be age 85 and older(U.S. Census Bureau, 2011).Figure 1.5 on p. 18 contrasts the population pyramids for the years 2010, 2030, and 2050. The hori zontalbars reflect birth cohorts and illustrate the importanceof the baby boom generation in shaping the future population of the United States. By 2030, all of the babyboomers will have transitioned to the ranks of olderadulthood.Reaching the Maximum Life SpanResearchers worldwide are intrigued with JeanneCalment for both her longevity and vitality. Whenyounger, her life revolved around tennis, bicycling, swimming, roller-skating, piano, and opera. She took up fencing lessons at 85 and rode a bicycle until age 100. At age121, she released two CDs, one in French and another inEnglish, which featured Calment’s reminiscing to a scoreof rap and other tunes. Researchers attribute her longevity to her extraordinary immunity to stress. But genes mayalso be a factor since both her parents were long-lived.She once said, “If you can’t do anything about it, don’tworry about it.” Calment herself credited her longevityto an occasional glass of port wine, a diet rich in oliveoil, and lots of laughter. She used to eat two pounds ofchocolate per week until her doctor persuaded her to giveup sweets at the age of 119. She quit smoking only at119, largely due to pride rather than health—she wastoo blind to light up herself, and hated asking someoneto do it for her. In later years, Calment lived mostly offthe income from her apartment, which she sold cheaplyto a lawyer when she was 90. The lawyer signed a contingency contract with Calment and agreed to pay a lifeannuity of 2,500 francs ( 500) a month until she diedand he became owner. He lost this gamble. When hedied at age 77, his family was left still paying for the flatuntil Calment died several years later! How does one ferret out the role of genetics and lifestyle with someonelike Jeanne Calment? Many researchers and others whohave studied those who live to 100 years or more haveattempted to figure this out as you will see in some of thestudies reported below.3/7/14 10:55 AM
18Chapter 1 The Older Population in the United StatesAge100 25201510503Figure 1.52Millions1001Millions23Population Pyramids Changing Age and Sex Structure of the U.S. Population: 2010, 2030, and 2050Source: U.S. Census Bureau, 2010, “The Next Four Decades: The Older Population in the U.S.: 2010–2050.”M02 HOOY7643 01 SE C01.indd 183/7/14 10:55 AM
Chapter 1 The Older Population in the United StatesPopulation pyramids that show the known and projected resident population of the United States during keypoints in time show a bulge in the area of the pyramidrepresenting those residents born during the baby boomperiod. As years pass, that bulge moves higher up thepyramid—sometimes referred to as “the pig in a pythonphenomenon”—changing the shape of the pyramid intoone that widens at the top. Declining birthrates andreduced death rates for older cohorts also contribute tothis change in shape.Support and DependencyRatiosThe changing age distribution in our population isalso reflected in what is variously called the old-age support ratio or the “dependency ratio.” You may haveseen these terms in media coverage of the future of SocialSecurity and Medicare. The dependency ratio refersto the number of people age 65 and older to every 100people of traditional working ages (defined as 18–64).What Causes Longevity?Genes or Behavior?Journalist Dan Buettner has traveled to world regions whereit is not unusual to find vigorous, active c entenarians—those who live to age 100 and older. He labeled these “BlueZones,” places with large numbers of long-living residentswho share healthy lifestyles, diets, engagement in their community, and a positive worldview. Yet these elders in different parts of the world—Okinawa, Sardinia, the northwestern region of Costa Rica, and Loma Linda, California—share genetic qualities and cultural norms that have tiedthe community together for hundreds of years. These BlueZones are generally more remote, less stressful environments than typical communities. While some aspects oftheir lifestyles may be adopted—such as strong connections with family and friends, engaging in physical labor intoadvanced old age, walking and exercise, a low-calorie, plantbased diet, and a positive outlook—some are fundamentalsocietal and genetic factors and cannot be replicated bythose in other communities (Buettner, 2008).M02 HOOY7643 01 SE C01.indd 1919In 2010, this ratio was 22 people age 65 and older toevery 100 people age 18–64. This will rise from 35older adults in 2030 to 37 in 2050 for every 100 “working age” adults. The higher this ratio, the greater thepotential burden of “dependent” older adults (Vincent &Velkoff, 2010).Another way of measuring this burden is the s upportratio. This indicates the relationship between the proportion of the population that is employed (defined as “productive” and able to support others) and the percentage that is not in the workforce (viewed as “dependent” oras “requiring support”). This ratio has decreased steadilyin the past 100 years, which means that proportionatelyfewer employed persons support retired older personstoday. In 1910, there were 10 employed people per retiredolder person; today there are fewer than 5 employed. Itis projected that there will only be about three employedpeople per retired person by 2030 (Orr, 2010; Vincent &Velkoff, 2010).Such changes fuel public perceptions about olderadults as a “burden” on the younger population. However,the population under age 16—not older adults—will continue to be the largest “dependent” group. As more eldersremain in the workforce longer, there will be fewer retiredelders who require economic support from younger adults.What is unknown, however, is how the Great Recessionthat started in 2008 and the increasing numbers of unemployed adults will affect this ratio in the next 10–20 years.There are likely to be fewer employed persons of all agesto support those who are not employed. The rapid growthof the population age 85 and older also has numerousimplications for public perceptions that older adults area burden.These trends are also captured in Figure 1.6 on p. 20.The Rapid Growth of theOld-Old and Oldest-OldDo you know anyone who is between the ages of 75and 84? They fall into the old-old age group as definedby gerontologists. Or perhaps you have a grandparentor great- grandparent who are among the oldest-old—p eople age 85 and older. These categories represent animportant demographic distinction, because it is the oldest-old who are g rowing most rapidly, even though the3/7/14 10:55 AM
20Chapter 1 The Older Population in the United Statesinstitutions, housing, and communities. In other words,population aging affects all of us throughout our lives(AoA, 2012; Vincent & Velkoff, 2010).25%20%PercentWho Are the Oldest-Old?15%10%5%0%1900195065 and Older2010205085 and OlderFigure 1.6 Population Age 65 and Over and Age 85 andOver: 1900, 1950, 2010, and Projected 2050Source: www.aoa.gov, “Projected Future Growth of the Older Population”young-old are over 50 percent of the older population inthe United States. In other words, the older po
population aging, which refers to the sheer increase in the size of the population age 65 and older and a gain in the average age of a population. Population aging—fueled by baby boomers—is one of the most dramatic demographic changes in the United States and worldwide and is illus-trate