Transcription
USMLE STEP 1Lecture Notes2016Behavioral Scienceand Social Sciences
USMLE is a joint program of the Federation of State Medical Boards (FSMB) and the National Board ofMedical Examiners (NBME), neither of which sponsors or endorses this product.This publication is designed to provide accurate information in regard to the subject matter covered asof its publication date, with the understanding that knowledge and best practice constantly evolve. Thepublisher is not engaged in rendering medical, legal, accounting, or other professional service.If medical or legal advice or other expert assistance is required, the services of a competent professionalshould be sought. This publication is not intended for use in clinical practice or the deliveryof medical care. To the fullest extent of the law, neither the Publisher nor the Editors assume any liabilityfor any injury and/or damage to persons or property arising out of or related to any use of the materialcontained in this book. 2016 by Kaplan, Inc.Published by Kaplan Medical, a division of Kaplan, Inc.750 Third AvenueNew York, NY 10017Printed in the United States of America10 9 8 7 6 5 4 3 2 1Course ISBN: 978-1-5062-0775-9All rights reserved. The text of this publication, or any part thereof, may not be reproduced in any mannerwhatsoever without written permission from the publisher. This book may not be duplicated or resold,pursuant to the terms of your Kaplan Enrollment Agreement.Retail ISBN: 978-1-5062-0048-4Kaplan Publishing print books are available at special quantity discounts to use for sales promotions,employee premiums, or educational purposes. For more information or topurchase books, please call theSimon & Schuster special sales department at 866-506-1949.
EditorsEpidemiology, Statistics, Behavioral ScienceCharles Faselis, M.D.Chairman of MedicineVA Medical CenterWashington, DCAlina Gonzalez-Mayo, M.D.PsychiatristDepartment of Veterans AdministrationBay Pines, FLMark Tyler-Lloyd, M.D., M.P.H.Executive Director of AcademicsKaplan MedicalNew York, NYBasic Science of Patient SafetyTed A. James, M.D., M.S., F.A.C.S.Medical Director, Clinical Simulation and Patient SafetyDirector, Skin & Soft Tissue Surgical OncologyAssociate Professor of SurgeryUniversity of Vermont College of MedicineBurlington, VT
ContentsPreface . . . . . . . . . . . . . . . . . . . . . . . . . . . . . . . . . . . . . . . . . . . . . . . . . . . . . viiSection I: Epidemiology and BiostatisticsChapter 1: Epidemiology . . . . . . . . . . . . . . . . . . . . . . . . . . . . . . . . . . . . . . . . 3Chapter 2: Biostatistics . . . . . . . . . . . . . . . . . . . . . . . . . . . . . . . . . . . . . . . . . 19Section II: Behavioral ScienceChapter 3: Life in the United States . . . . . . . . . . . . . . . . . . . . . . . . . . . . . . 43Chapter 4: Substance-Related Disorders . . . . . . . . . . . . . . . . . . . . . . . . . . 55Chapter 5: Human Sexuality . . . . . . . . . . . . . . . . . . . . . . . . . . . . . . . . . . . . 65Chapter 6: Learning and Behavior Modification . . . . . . . . . . . . . . . . . . . . 75Chapter 7: Defense Mechanisms . . . . . . . . . . . . . . . . . . . . . . . . . . . . . . . . . 87Chapter 8: Psychologic Health and Testing . . . . . . . . . . . . . . . . . . . . . . . . . 99Chapter 9: Human Development . . . . . . . . . . . . . . . . . . . . . . . . . . . . . . . 105Chapter 10: Sleep and Sleep Disorders . . . . . . . . . . . . . . . . . . . . . . . . . . 123Chapter 11: Physician-Patient Relationship . . . . . . . . . . . . . . . . . . . . . . . . 133Chapter 12: Diagnostic and Statistical Manual (DSM 5) . . . . . . . . . . . . . 145Chapter 13: Organic Disorders . . . . . . . . . . . . . . . . . . . . . . . . . . . . . . . . . 169Chapter 14: Psychopharmacology . . . . . . . . . . . . . . . . . . . . . . . . . . . . . . . 183Chapter 15: Ethical and Legal Issues . . . . . . . . . . . . . . . . . . . . . . . . . . . . . 197Chapter 16: Health Care Delivery Systems . . . . . . . . . . . . . . . . . . . . . . . . 211Section III: Social SciencesChapter 17: Basic Science of Patient Safety . . . . . . . . . . . . . . . . . . . . . . . 217Index . . . . . . . . . . . . . . . . . . . . . . . . . . . . . . . . . . . . . . . . . . . . . . . . . . . . . . . . . . . . . . 245v
PrefaceThese volumes of Lecture Notes represent the most-likely-to-be-tested materialon the current USMLE Step 1 exam.We want to hear what you think. What do you like about the Notes? What couldbe improved? Please share your feedback by e-mailing us at medfeedback@kaplan.com.Best of luck on your Step 1 exam!Kaplan Medicalvii
SECTIONIEpidemiology andBiostatistics
Epidemiology1Learning Objectives Answer questions about epidemiologic measures Use knowledge of understanding screening tests Explain information related to study designsEPIDEMIOLOGIC MEASURESEpidemiology is the study of the distribution and determinants of health-relatedstates within a population.l Epidemiology sees disease as distributed within a group, not as a propertyof an individual.l The tools of epidemiology are numbers. Numbers in epidemiology areratios converted into rates.l The denominator is key: who is “at risk” for a particular event or diseasestate.l Compare the number of actual cases with the number of potential casesto determine the rate.lActual casesNumerator Potential casesDenominator RATERates are generally, but not always, per 100,000 persons by the Centersfor Disease Control and Prevention (CDC), but can be per any multiplier. (Vital statistics are usually per 1,000 persons.)Incidence and Prevalence1. Incidence rate (IR): the rate at which new events occur in a population.The numerator is the number of NEW events that occur in a definedperiod; the denominator is the population at risk of experiencing thisnew event during the same period.Incidence rate Number of new events in a specified periodNumber of persons “exposed to risk” of becoming new cases during this period 10n3
USMLE Step 1lBehavioral Science and Social SciencesRemember, IR:l Should include only new cases of the disease that occurred duringthe specified period.l Should not include cases that occurred or were diagnosed earlier.l This is especially important when working with infectious diseasessuch as tuberculosis and malaria.Examples:a. Over the course of one year, 5 men are diagnosed with prostate cancer, out of a total male study population of 200 (who do not haveprostate cancer at the beginning of the study period). We would thensay the incidence of prostate cancer in this population was 0.025 (or2,500 per 100,000 men-years of study).b. A population at risk is composed of 100 medical students. Twentyfive medical students develop symptoms consistent with acute infectious diarrhea and are confirmed by laboratory testing to have beeninfected with campylobacter. If 12 students developed campylobacterin September and 13 developed campylobacter in October, what isthe incidence rate of campylobacter for those 2 months?In this case, the numerator is the 25 new cases.The denominator (person-time at risk) could be calculated by:[(100 students at risk at the beginning of Sept. 75 studentsat risk at the end of Oct.) / 2 ] 2 months [(175 / 2) 2] months 175 person-months of risk Since 25 students got campylobacter in September or October, thereare 75 students remaining at risk at the end of October.The incidence rate would then be: (25 new cases) / (175 person-months of risk) 14% of the studentsare getting campylobacter each monthl ttack rate is the cumulative incidence of infection in a groupAof people observed over a period of time during an epidemic,usually in relation to food borne illness. It is the number ofexposed people infected with the disease divided by the totalnumber of exposed people. It is measured from the beginning of an outbreak to the end of theoutbreak. It is often referred to as an attack ratio. For instance, if there are 70 people taken ill out of 98 in an outbreak,the attack rate is 70/98 0.714 or about 71.4%. Consider an outbreak of Norwalk virus in which 18 persons in 18 different households all became ill. If the population of the communitywas 1,000, then the overall attack rate was 18 1,000 100% 1.8%.2. Prevalence rate: all persons who experience an event in a population.The numerator is ALL individuals who have an attribute or disease ata particular point in time (or during a particular period of time); thedenominator is the population at risk of having the attribute or diseaseat this point in time or midway through the period.4
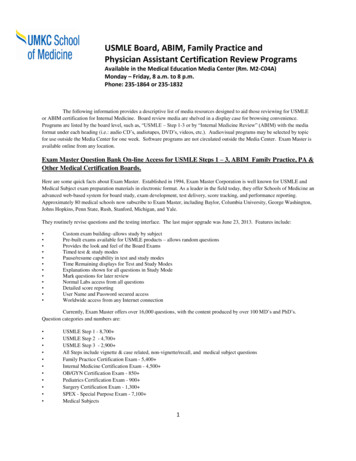
Chapter 1Prevalence rate All cases of a disease at a given point/periodTotal population “at risk” for being cases at a given point/periodlEpidemiology 10nPrevalence is the proportion of people in a population who have a particular disease at a specified point in time, or over a specified period of time.l The numerator includes not only new cases, but also old cases(people who remained ill during the specified point or periodin time). A case is counted in prevalence until death or recoveryoccurs.l This makes prevalence different from incidence, which includesonly new cases in the numerator.l Prevalence is most useful for measuring the burden of chronic diseases such as tuberculosis, malaria and HIV in a population.For example, the CDC estimated the prevalence of obesity amongAmerican adults in 2001 at approximately 20%. Since the number (20%)includes ALL cases of obesity in the United States, we are talking aboutprevalence.Prevalence is distinct from incidence. Prevalence is a measurement ofall individuals (new and old) affected by the disease at a particular time,whereas incidence is a measurement of the number of new individualswho contract a disease during a particular period of time.Point vs. Period Prevalence The amount of disease present in a population changes over time. Sometimes, we want to know how much of aparticular disease is present in a population at a single point in time,a sort of ‘snapshot view’.a. Point prevalence: For example, we may want to find out the prevalence of Tb in Community A today. To do that, we need to calculate the point prevalence on a given date. The numerator wouldinclude all known TB patients who live in Community A that day.The denominator would be the population of Community A thatday.Point prevalence is useful in comparing different points in time to helpdetermine whether an outbreak is occurring.b. Period prevalence: prevalence during a specified period or span oftimec. Focus on chronic conditions3. Understanding the relationship between incidence and prevalencea. Prevalence Incidence Duration (P I D)b. “Prevalence pot”i. Incident cases or new cases are monitored over time.ii. New cases join pre-existing cases to make up total prevalence.iii. Prevalent cases leave the prevalence pot in one of twoways: recovery or death.5
USMLE Step 1lBehavioral Science and Social SciencesIncident CasesGeneralPopulationat RiskRecoveryPrevalentCasesMortalityFigure 1-1. Prevalence Pot4. Morbidity rate: rate of disease in a population at risk; refers to bothincident and prevalent cases5. Mortality rate: rate of death in a population at risk; refers to incidentcases onlyTable 1-1. Incidence and PrevalenceWhat happens to incidence and prevalence if:IncidencePrevalenceNew effective treatment is initiated?N New effective vaccine gains widespread use? Number of persons dying from the conditionincreases?N Additional Federal research dollars are targetedto a specific condition?NNBehavioral risk factors are reduced in thepopulation at large? N NRecovery from the disease is more rapid than itwas 1 year ago?N Long-term survival rates for the disease areincreasing?N Contacts between infected persons andnoninfected persons are reduced:For airborne infectious disease?For noninfectious disease?N no change; decrease; increase6
Chapter 1lEpidemiologyLung Cancer Cases in a Cohort of Heavy SmokersDisease course, if any, for 10 onTerminal EventFigure 1-2. Calculating Incidence and PrevalenceCrude, Specific, and Standardized Rates1. Crude rate: actual measured rate for whole population2. Specific rate: actual measured rate for subgroup of population, e.g.,“age-specific” or “sex-specific” rate. A crude rate can be expressed as aweighted sum of age-specific rates. Each component of that sum has thefollowing form:(proportion of the population in the specified age group) (age-specific rate)3. Standardized rate (or adjusted rate): adjusted to make groups equal onsome factor, e.g., age; an “as if ” statistic for comparing groups. The standardized rate adjusts or removes any difference between two populationsbased on the standardized variable. This allows an “uncontaminated” orunconfounded comparison.7
USMLE Step 1lBehavioral Science and Social SciencesTable 1-2. Types of Mortality RatesCrude mortality rateDeathsPopulationCause-specific mortality rateDeaths from causePopulationCase-fatality rateDeaths from causeNumber of persons with the disease/causeProportionate mortality rate (PMR)Deaths from causeAll deathsPractice Question1. Why does Population A have a higher crude rate of disease compared withPopulation C? (Hint: Look at the age distribution.)Table 1-3. Disease Rates Positively Correlated with AgePopulation A8Population BPopulation CCasesPo
USMLE Step 1 l Behavioral Science and Social Sciences General Population at Risk Incident Cases Prevalent Cases Recovery Mortality Figure 1-1.Prevalence Pot 4. Morbidity rate: rate of disease in a population at risk; refers to both incident and prevalent cases 5. Mortality rate: rate of death in a population at risk; refers to incident cases only Table 1-1.