Transcription
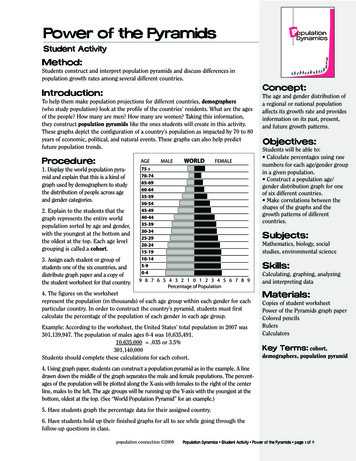
Power of the PyramidsStudent ActivityMethod:Students construct and interpret population pyramids and discuss differences inpopulation growth rates among several different countries.Concept:Introduction:To help them make population projections for different countries, demographers(who study population) look at the profile of the countries’ residents. What are the agesof the people? How many are men? How many are women? Taking this information,they construct population pyramids like the ones students will create in this activity.These graphs depict the configuration of a country’s population as impacted by 70 to 80years of economic, political, and natural events. These graphs can also help predictfuture population trends.Procedure:AGE1. Display the world population pyramid and explain that this is a kind ofgraph used by demographers to studythe distribution of people across ageand gender categories.75 20-2415-1910-145-90-42. Explain to the students that thegraph represents the entire worldpopulation sorted by age and gender,with the youngest at the bottom andthe oldest at the top. Each age levelgrouping is called a cohort.3. Assign each student or group ofstudents one of the six countries, anddistribute graph paper and a copy ofthe student worksheet for that country.MALEWORLDFEMALEThe age and gender distribution ofa regional or national populationaffects its growth rate and providesinformation on its past, present,and future growth patterns.Objectives:Students will be able to: Calculate percentages using rawnumbers for each age/gender groupin a given population. Construct a population age/gender distribution graph for oneof six different countries. Make correlations between theshapes of the graphs and thegrowth patterns of differentcountries.Subjects:Mathematics, biology, socialstudies, environmental scienceSkills:9 8 7 6 5 4 3 2 1 0 1 2 3 4 5 6 7 8 9Percentage of Population4. The figures on the worksheetrepresent the population (in thousands) of each age group within each gender for eachparticular country. In order to construct the country’s pyramid, students must firstcalculate the percentage of the population of each gender in each age group.Example: According to the worksheet, the United States’ total population in 2007 was301,139,947. The population of males ages 0-4 was 10,635,491.10,635,000 .035 or 3.5%301,140,000Students should complete these calculations for each cohort.Calculating, graphing, analyzingand interpreting dataMaterials:Copies of student worksheetPower of the Pyramids graph paperColored pencilsRulersCalculatorsKey Terms: cohort,demographers, population pyramid4. Using graph paper, students can construct a population pyramid as in the example. A linedrawn down the middle of the graph separates the male and female populations. The percentages of the population will be plotted along the X-axis with females to the right of the centerline, males to the left. The age groups will be running up the Y-axis with the youngest at thebottom, oldest at the top. (See “World Population Pyramid” for an example.)5. Have students graph the percentage data for their assigned country.6. Have students hold up their finished graphs for all to see while going through thefollow-up questions in class.population connection 2008Population Dynamics Student Activity Power of the Pyramids page 1 of 4
Discussion Questions:1. Where are you represented on the tables and on thegraphs?If you live in the United States and were between 10and 15 years old in 2007, you are represented on line3 in the U.S. data under either male or female. On thegraph, you and your cohort made up the percentagepresented by the third bar from the bottom, males onthe left, females on the right.2. Can you tell from the data if there are more male orfemale babies in each country?Yes, there are more male babies. There is a slightlygreater probability of giving birth to male children.For every 100 girls born, there are about 105 boysborn.3. Are there more elderly women or men? Why mightthat be the case?There are more elderly women. Throughout theworld, life expectancy for women is higher than formen. This is due to a number of genetic and socialfactors. In general, men are more predisposed to certain health risks than women. Also, men make up thevast majority of the military and are more likely todie during wars.4. Can you tell from the graphs which country has themost people?No. The graphs represent 100 percent of the population of each country broken down by age groups.Demographers use the percentage data instead of theraw data so that each graph fits on the same sizepaper and can be compared to the graphs of othercountries.5. Which country has the most people? How can youtell?From the TOTAL line on the data sheet you can tellthat China has more people than any other country.6. Of the six graphs, which two look most like pyramids? What does that indicate about their populationgrowth rates? What factors would change the shape ofthe pyramids in the future?The graphs for Nigeria and India look most like pyramids. This indicates a high growth rate. Populationgrowth occurs when the segment of the populationcurrently in its childbearing years (ages 15-44; bars4-9 on the graphs) has produced a generation largerthan itself (bars 1-3). If the birth rate goes down, thiswould change the shape of the graph over time frompopulation connection 2008a pyramid to more of a rectangle, indicating a morestable population.7. Looking at the pyramids, which country appears tohave the slowest rate of population growth? How canyou tell?France. The graph is closer to a rectangle than apyramid, showing more uniform population sizeacross the age groups. France has a birth rate anddeath rate that are roughly equal, which demographers call zero population growth.8. Which are the largest age groups in the U.S.?People aged 40-49 (in 2007) made up the biggest portion of the United States, with babies a close second.The people who were born between 1946 to 1964 arecalled “Baby Boomers.” This “boom” began shortlyafter World War II, when many husbands and wiveswere reunited and the country experienced greatereconomic prosperity than it did during the years ofthe Great Depression and the war. Couples felt confident of the ability to support families, and the birthrate soared as a result. The children of Baby Boomerscomprise a cohort sometimes called a “BabyBoomlet” or an “Echo Boom.”9. In which country do children make up the largestpercentage of the population?You can see on the graph that the bottom of theNigerian and the Indian pyramids go out the farthest,representing the largest percentage. The percentagesthat you calculated show that Nigerian babies (malesand females combined) make up about 16 percent(8 8) of the population, and the older children alsomake up a big percentage.10. Some cultures have traditionally favored boychildren over girl children (as can be seen in thepyramids for India and China). Why might couplesprefer to have boys rather than girls in these countries? What are some consequences that may ariseif a generation has a gender imbalance?Parents may favor boys over girls in order to carry onan ancestral line, to avoid the high costs of a daughter’s dowry, or from the traditional belief that boys aremore valuable. In developing countries, boys areexpected to take care of their parents in old age, asgirls will marry and live with their husbands’ families.As a generation matures, a shortage of girls leads to ashortage of women for men to marry. This conditioncan cause instability and result in kidnappings andviolence towards women, massive migration of menseeking mates, the sale of women for marriage, etc.Population Dynamics Student Activity Power of the Pyramids page 2 of 4
11. If you had a business and wanted to capitalize onyour information about the population age distribution for the U.S., what would you sell?Answers might include any products for people of theBaby Boom generation or their children.12. If you had a business in Nigeria and wanted tocapitalize on your information about the Nigerianpopulation, what would you sell?Answers might include any products for children andinfants.13. How would you expect the Mexican pyramid tolook if you graphed it 40 years from now?The graph shows that the Mexican population wasgrowing rapidly about 30 years ago, when the rateof growth slowed. If this trend continues unchanged,the Mexican “pyramid” will gradually become morerectangular.Assessment Idea:Provide students with a population pyramid for afictitious (or unlabeled) country. Population pyramidscan be accessed and printed from the “Pyramids”section of the International Data Base at the U.S.Census website, www.census.gov. Have them explainwhat the pyramid shows, what sort of growth patternsthey expect in the future, and what sort of concernsthe government might have based on the populationinformation.population connection 2008Population Dynamics Student Activity Power of the Pyramids page 3 of 4
MALE UNITED STATESFEMALEpopulation connection 2008MALEINDIAFEMALE9 8 7 6 5 4 3 2 1 0 1 2 3 4 5 6 7 8 9Percentage of Population75 20-2415-1910-145-90-4AGE9 8 7 6 5 4 3 2 1 0 1 2 3 4 5 6 7 8 9Percentage of Population75 AFEMALE9 8 7 6 5 4 3 2 1 0 1 2 3 4 5 6 7 8 9Percentage of Population75 20-2415-1910-145-90-4AGE9 8 7 6 5 4 3 2 1 0 1 2 3 4 5 6 7 8 9Percentage of Population75 EMALE9 8 7 6 5 4 3 2 1 0 1 2 3 4 5 6 7 8 9Percentage of Population75 20-2415-1910-145-90-4AGE9 8 7 6 5 4 3 2 1 0 1 2 3 4 5 6 7 8 9Percentage of Population75 20-2415-1910-145-90-4AGEPower of the PyramidsStudent ActivityPopulation Dynamics Student Activity Power of the Pyramids page 4 of 4
population connection 5455-5960-6465-6970-7475 TotalPopulation Dynamics Student Worksheet 1 Power of the Pyramids page 1,143%Source: U.S. Census Bureau, International Database, www.census.gov.TotalMAgeGroupUnited on in Thousands 9440,69239,0211,320,848%China%Power of the PyramidsStudent Worksheet 1
population connection 950-5455-5960-6465-6970-7475 TotalPopulation Dynamics Student Worksheet 2 Power of the Pyramids page 27F1,129,865%Source: U.S. Census Bureau, International Database, 5,031%Nigeria%Population in Thousands 9721,9551,8701,9341,972F32,57863,718%France%Power of the PyramidsStudent Worksheet 2
population connection 970-7475 3.43.43.5%Source: U.S. Census Bureau, International Database, 440-4410,1565-910,55810,6350-435-39MAgeGroupUnited tion in Thousands 3.22.74.54.63.93.64.04.33.53.03.1%Power of the PyramidsAnswers to Student Worksheet 1Population Dynamics Answers to Student Worksheet 1 Power of the Pyramids page 1
population connection 5-6970-7475 4.34.74.95.35.65.7%Source: U.S. Census Bureau, International Database, 41,3361,6501,9262,3202,7983,3344,2
Power of the Pyramids graph paper Colored pencils Rulers Calculators Key Terms:cohort, demographers, population pyramid population connection 2008 Population Dynamics Student Activity Power of the Pyramids page 1 of 4 9876543210123456789 AGE MALE WORLD FEMALE 75 70-74 65-69 60-64 55-59 50-54 45-49 40-44 35-39 30-34 25-29 20-24 15 .