Transcription
National Aeronautics andSpace AdministrationARSETApplied Remote Sensing Traininghttp://arset.gsfc.nasa.gov@NASAARSETBasics of Synthetic Aperture RadarErika Podestwww.nasa.gov
Learning ObjectivesBy the end of this presentation, you will be able to: Understand the physics of SAR image formation Describe the interaction of SAR with the land surface Describe the necessary data preprocessing Explain what information is available from SARNational Aeronautics and Space AdministrationApplied Remote Sensing Training Program2
The Electromagnetic Spectrum Optical sensors measurereflected solar light andonly function in the daytime The surface of the Earthcannot be imaged withvisible or infrared sensorswhen there are clouds Microwaves can penetratethrough clouds andvegetation, and canoperate in day or nightconditionsNational Aeronautics and Space AdministrationApplied Remote Sensing Training Program3
Advantages and Disadvantages of Radar Remote Sensing OverOpticalAdvantagesDisadvantages Nearly all weather capability Information content is different thanoptical and sometimes difficult tointerpret Day or night capability Penetration through the vegetationcanopy Penetration through the soil Minimal atmospheric effects Speckle effects (graininess in theimage) Effects of topography Sensitivity to dielectric properties(liquid vs. frozen water) Sensitivity to structureNational Aeronautics and Space AdministrationApplied Remote Sensing Training Program4
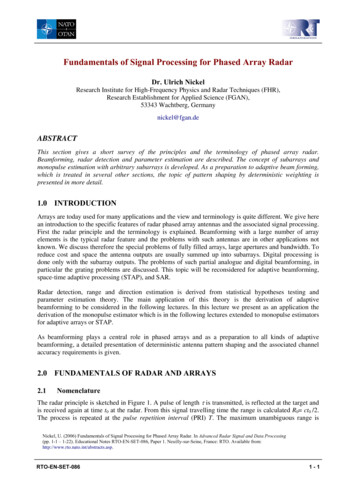
Global Cloud Coverage Total fractional cloud coverannual averaged from 19831990, compiled using data fromthe International Satellite CloudClimatology Project (ISCCP)Source: ISCCP, NASA Earth ObservatoryNational Aeronautics and Space AdministrationApplied Remote Sensing Training Program5
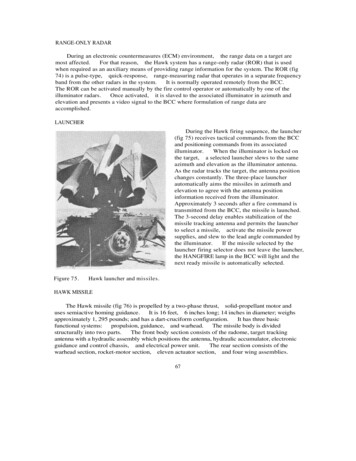
Optical vs. RadarVolcano in Kamchatka, Russia, Oct 5, 1994Image Credit: Michigan Tech VolcanologyNational Aeronautics and Space AdministrationApplied Remote Sensing Training Program6
Active and Passive Remote SensingPassive Sensors: The source of radiant energyarises from natural sources e.g. the sun, Earth, other “hot”bodiesActive Sensors Provide their own artificialradiant energy source forillumination e.g. radar, syntheticaperture radar (SAR), LIDARNational Aeronautics and Space AdministrationApplied Remote Sensing Training Program7
Basic Remote Sensing SystemNational Aeronautics and Space AdministrationApplied Remote Sensing Training Program8
Basic Concepts: Down Looking vs. Side Looking RadarNational Aeronautics and Space AdministrationApplied Remote Sensing Training Program9
Basic Concepts: Side Looking Radar Each pixel in the radar image represents a complex quantity of the energy thatwas reflected back to the satellite The magnitude of each pixel represents the intensity of the reflected echoCredit: Paul Messina, CUNY NY, after Drury 1990, Lillesand and Kiefer, 1994National Aeronautics and Space AdministrationApplied Remote Sensing Training Program10
Review of Radar Image Formation1. Radar can measure amplitude(the strength of the reflectedecho) and phase (the position ofa point in time on a waveformcycle)2. Radar can only measure the partof the echo reflected backtowards the antenna(backscatter)3. Radar pulses travel at the speedof lightSource: ESA- ASAR HandbookNational Aeronautics and Space AdministrationApplied Remote Sensing Training Program11
Radar Parameters to Consider for a Study Wavelength Polarization Incidence AngleNational Aeronautics and Space AdministrationApplied Remote Sensing Training Program12
Radar Parameters: WavelengthWavelength Speed of lightfrequency* Wavelengths most frequently used in SAR are inparenthesisNational Aeronautics and Space AdministrationApplied Remote Sensing Training Program13
Radar Parameters: Wavelength Penetration is the primaryfactor in wavelength selection Penetration through the forestcanopy or into the soil isgreater with longerwavelengthsImage Credit: DLRNational Aeronautics and Space AdministrationApplied Remote Sensing Training Program14
Penetration as a Function of Wavelength Waves can penetrate into vegetationand (in dry conditions) soilVegetation Generally, the longer the wavelength,the stronger the penetration into thetargetDryAlluviumDry SnowIceX-band3 cmNational Aeronautics and Space AdministrationC-band5 cmL-band23 cmImage based on ESA Radar Course 2Applied Remote Sensing Training Program15
Example: Radar Signal Penetration into Dry Soils Different satellite images oversouthwest LibyaSIR-C C-BandSIR-C L-Band The arrows indicate possible fluvialsystemsImage Credit: A PeregoNational Aeronautics and Space AdministrationApplied Remote Sensing Training Program16
Example: Radar Signal Penetration into Dry SoilsNational Aeronautics and Space AdministrationApplied Remote Sensing Training Program17
Example: Radar Signal Penetration into VegetationNational Aeronautics and Space AdministrationApplied Remote Sensing Training Program18
Example: Radar Signal Penetration into Wetlands L-band is ideal for the study ofwetlands because the signalpenetrates through the canopy andcan sense if there is standing waterunderneathSMAP Radar Mosaic of the Amazon Inundated areas appear white in theimage to the rightNational Aeronautics and Space AdministrationApplied Remote Sensing Training Program19
Radar Parameters: Polarization The radar signal is polarized The polarizations are usually controlled between H and V:– HH: Horizontal Transmit, Horizontal Receive– HV: Horizontal Transmit, Vertical Receive– VH: Vertical Transmit, Horizontal Receive– VV: Vertical Transmit, Vertical Receive Quad-Pol Mode: when all four polarizations aremeasured Different polarizations can determine physicalproperties of the object observedNational Aeronautics and Space AdministrationApplied Remote Sensing Training Program20
Example of Multiple Polarizations for Vegetation StudiesPacaya-Samiria Forest Reserve in PeruImages from UAVSAR (HH, HV, VV)National Aeronautics and Space AdministrationApplied Remote Sensing Training Program21
Radar Parameters: Incidence Angle The angle between the direction ofillumination of the radar and theEarth’s surface plane Depending on the height of thesensor, the incidence angle willchange This is why the geometry of an imageis different from point to point in therange direction Local Incidence Angle:– accounts for local inclination of thesurface– influences image brightnessNational Aeronautics and Space Administration1 cm wavelengthSignal fromtops, trunks,groundSignal from soiland subsoilSignal fromtops, trunksSignal from wheatand soilImage Credit: Left: Ulaby et al. (1981a), Right: ESAApplied Remote Sensing Training Program22
Radar Backscatter
Radar Backscatter The radar echo contains information about the Earth’s surface, which drives thereflection of the radar signal This reflection is driven by:– The frequency or wavelength: radar parameter– Polarization: radar parameter– Incidence angle: radar parameter– Dielectric constant: surface parameter– Surface roughness relative to the wavelength: surface parameter– Structure and orientation of objects on the surface: surface parameterNational Aeronautics and Space AdministrationApplied Remote Sensing Training Program24
Backscattering MechanismsDensitySize in relation to thewavelengthDielectric ConstantSize and OrientationNational Aeronautics and Space AdministrationApplied Remote Sensing Training Program25
Surface Parameters: Dielectric ConstantNational Aeronautics and Space AdministrationApplied Remote Sensing Training Program26
Dielectric Properties of the Surface and its Frozen or Thawed State During the landsurfacefreeze/thawtransition there isa change indielectricproperties of thesurface This causes anotable increasein backscatterNational Aeronautics and Space AdministrationApplied Remote Sensing Training Program27
Radar Signal Interaction The radar signal is primarily sensitive to surface structure The scale of surface relative to the wavelength determine how rough or smooththey appear and how bright or dark they will appear on the imageBackscattering MechanismsNational Aeronautics and Space AdministrationBackscattering MechanismsApplied Remote Sensing Training Program28
Radar Backscatter in ForestsNational Aeronautics and Space AdministrationApplied Remote Sensing Training Program29
Examples of Radar InteractionSmooth Surface Reflection (Specular Reflection)SMAP Radar Mosaic of the Amazon BasinApril 2015 (L-band, HH, 3 km)Pixel ColorSmooth, level surface(open water, road)National Aeronautics and Space AdministrationApplied Remote Sensing Training Program30
Examples of Radar InteractionRough Surface ReflectionSMAP Radar Mosaic of the Amazon BasinApril 2015 (L-band, HH, 3 km)Pixel Colorrough bare surface(deforested areas, tilled agricultural fields)National Aeronautics and Space AdministrationApplied Remote Sensing Training Program31
Examples of Radar InteractionVolume Scattering by VegetationSMAP Radar Mosaic of the Amazon BasinApril 2015 (L-band, HH, 3 km)Pixel ColorVegetationNational Aeronautics and Space AdministrationApplied Remote Sensing Training Program32
Examples of Radar InteractionDouble BounceSMAP Radar Mosaic of the Amazon BasinApril 2015 (L-band, HH, 3 km)21Pixel ColorInundated VegetationNational Aeronautics and Space AdministrationApplied Remote Sensing Training Program33
Example: Detection of Oil Spills on WaterUAVSAR (2 meters):HH, HV, VVNational Aeronautics and Space AdministrationApplied Remote Sensing Training Program34
Example: Land Cover Classification Brazil JERS-1 L-band 100 meter resolutionNational Aeronautics and Space AdministrationApplied Remote Sensing Training Program35
Geometric and Radiometric Distortion ofthe Radar Signal
Slant Range DistortionSlant RangeGround RangeSource: Natural Resources CanadaNational Aeronautics and Space AdministrationApplied Remote Sensing Training Program37
Geometric DistortionLayoverForeshorteningSource: Natural Resources CanadaNational Aeronautics and Space AdministrationApplied Remote Sensing Training Program38
ForeshorteningBefore CorrectionAfter CorrectionSource: ASFNational Aeronautics and Space AdministrationApplied Remote Sensing Training Program39
ShadowSource: Natural Resources CanadaNational Aeronautics and Space AdministrationApplied Remote Sensing Training Program40
Radiometric Distortion The user must correct for the influence of topography on backscatter This correction eliminates high values in areas of complex topographyBefore CorrectionAfter CorrectionImage Credits: ASFNational Aeronautics and Space AdministrationApplied Remote Sensing Training Program41
Speckle
SpeckleSpeckle is a granular 'noise' that inherently exists in and degrades the quality ofSAR imagesImage Credit: ESANational Aeronautics and Space AdministrationImage Credit: Natural Resources CanadaApplied Remote Sensing Training Program43
Speckle Reduction: Multi-Look Processing Divides radar beam into several, narrower sub-beams– e.g. 5 beams on the right Each sub-beam is a “look” at the scene These “looks” are subject to speckle By summing and averaging the different “looks” together,the amount of speckle will be reduced in the final outputimageSource: Natural Resources CanadaNational Aeronautics and Space AdministrationApplied Remote Sensing Training Program44
Speckle Reduction: Spatial Filtering Moving window over each pixel in the image Applies a mathematical calculation on the pixelvalues within the window The central pixel is replaced with the new value The window is moved along the x and y dimensionsone pixel at a time Reduces visual appearance of speckle and appliesa smoothing effectSource: Natural Resources CanadaNational Aeronautics and Space AdministrationApplied Remote Sensing Training Program45
Radar Data from Different Satellite SensorsSensor NameRADARSAT-2Sentinel-1ARISAT-1AgencyCanadian SpaceProgram (CSP)European SpaceAgency (ESA)Indian Space ResearchOrganization (ISRO)InstrumentC-band SAR (5.4 GHz)C-band SAR (5.4 GHz)C-band SAR (5.35 GHz)Incidence AngleSide-looking, 15-45 offnadirSide-looking, 15-45 offnadir36.85 PolarizationHH, HV, VV, & VH(VV & VH) or (HH & HV)HH & HVSensor Height atEquator798 km693 km542 kmOrbitSun Synchronous(dusk/dawn)Sun Synchronous(dusk/dawn)Sun Synchronous(dusk/dawn)Revisit Time (OrbitRepeat Cycle)24 days12 days25 daysNational Aeronautics and Space AdministrationApplied Remote Sensing Training Program46
Radar Data from Different SatellitesSensor NameRADARSAT-2Sentinel-1ARISAT-1Resolution100 m5 m x 20 m 25 mSwath Width500 km (ScanSARmode)250 km (IWS mode)115 km (MRS)Mean Local Time6:00 a.m. descending6:00 a.m. descending6:00 a.m.Launch14 Dec 20073 April 201426 Apr 2012Planned Lifetime7 years minimum7 years5 yearsNational Aeronautics and Space AdministrationApplied Remote Sensing Training Program47
SAR Sources at the Alaska Satellite FacilityNational Aeronautics and Space AdministrationApplied Remote Sensing Training Program48
NASA-ISRO SAR Mission (NISAR) High spatial resolution with frequentrevisit time Earliest baseline launch date: 2021 Dual frequency L- and S-band SAR– L-band SAR from NASA and S-bandSAR from ISRO 3 years science operations (5 yearsconsumables) All science data will be made availablefree and openSlide Courtesy of Paul Rosen (JPL)National Aeronautics and Space AdministrationApplied Remote Sensing Training Program49
NISAR Hydrology & Subsurface Reservoir ApplicationsFlood ResponseSpecific ApplicationsDirection of InundationNISAR Data Product (L1 or L2)Needed Information Product* Geocoded and calibrated product Geocoded/calibrated SLC wouldbe ok InSAR coherence and repeatpass coregisted imagery Change in open water extent Flooded forest inundationextentChange in Water Level inForested and Urban AreasInSAR phase and coherenceMeasure change in water levelin areas where forests andurban areas are inundatedHurricane & TyphoonInundation (precipitationand storm surge)Geocoded coherence mapAerial map of inundationFlooding from Runoff andSnowmeltGeocoded coherence mapAerial map of inundationNational Aeronautics and Space AdministrationApplied Remote Sensing Training Program50
NISAR Hydrology & Subsurface Reservoir ApplicationsSurface Deformation from Volumetric Changes in Subsurface ReservoirsSpecific ApplicationsAquifer Drawdown andRecharge (both natural andanthropogenic)Oil and Natural GasExtraction from OnshoreFieldsExtent and Degree of MineCollapseNational Aeronautics and Space AdministrationNISAR Data Product (L1 or L2) Geocoded unwrappedinterferograms Geocoded coherence maps Geocoded LOS vector mapsNeeded Information Product*Rates and time series ofvertical surface displacementRates of vertical surfacedisplacement Raw SAR data (rapid response)Vertical surface displacement Geocoded unwrappedfor the time period bracketinginterferograms Geocoded coherence mapsthe event Geocoded LOS vector mapsApplied Remote Sensing Training Program51
NISAR Hydrology & Subsurface Reservoir ApplicationsSpecific ApplicationsNISAR Data Product (L1 or L2)Needed Information Product*Gas & Fluid ReservoirsCO2 SequestrationSLC InSARTime series deformationUnderground Gas Storage(UGS)SLC InSAR Time series deformation Deformation from leaksFluid Withdrawal & InjectionAquifer Production TriggeredEarthquakesSLC InSAR Time series deformation Deformation from leaksSnow Water EquivalentEstimate Snow WaterEquivalent by GroundwaterBasinNational Aeronautics and Space Administration Geocoded and calibratedproduct InSAR and PolSAR Snow water equivalentApplied Remote Sensing Training Program52
Basic Concepts: Side Looking Radar Each pixel in the radar image represents a complex quantity of the energy that was reflected back to the satellite The magnitude of each pixel represents the intensity of the reflecte