Transcription
16 January 2015No. 1ECG Made EASIERG W JonesModerator: Prof SommervilleSchool of Clinical MedicineDiscipline of Anaesthesiology and Critical Care
CONTENTSWHAT IS AN ECG? . 3ELECTROPHYSIOLOGY OF THE CONDUCTION SYSTEM . 4WHY DO AN ECG PRE-OPERATIVELY – IS IT NECESSARY? . 5TECHNICAL ASPECTS OF AN ECG. 6TEN STEP METHOD FOR READING ECGS . 71. Rate . 72. Rhythm . 73. Axis . 74. P waves (Atria) . 95. PR interval . 106. Q waves. 107. QRS Complexes . 108. T waves . 109. ST Segment . 1010.QT interval . 10MORE COMMON ECG ABNORMALITIES . 11Hypertrophy and Enlargement . 11Abnormalities of Rhythm . 13Myocardial Ischaemia / Infarction . 15Electrolyte Disturbances . 17Miscellaneous . 17TABLE WITH NORMAL VALUES . 19REFERENCES / USEFUL RESOURCE / TEXTBOOKS . 20Page 2 of 20
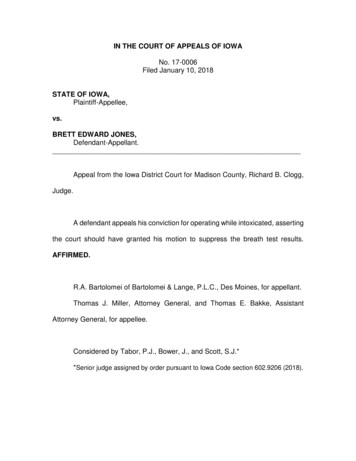
ECG MADE EASIERWHAT IS AN ECG?The electrocardiogram (ECG) is a powerful tool which is both easy to use and applicable tonumerous clinical scenarios. An ECG can be used to diagnose myocardial injury, identify one ofmany arrhythmias, highlight the acute effects of a large pulmonary embolus or the chroniceffects of establised hypertension, or simply provide reassurance to an executive having anannual medical checkup1.Figure 1: Normal ECGAn ECG is the primary monitor for diagnosis of cardiac conduction abnormalities and rhythmdisturbances. An ECG is a tracing created with electrodes on the skin that amplify cardiacelectrical potentials. The normal ECG tracing is a complex composed of three waveforms: P wave (atrial depolarization), QRS complex (ventricular depolarization), and T wave (ventricular repolarization)The direction of the electrical signal relative to a ground electrode determines the direction ofthe deflection seen on the ECG. Positive signals are represented by deflections above theisoelectric line and negative signals are represented as deflections below the isoelectric line 2.The PR interval is the time between atrial depolarization and initiation of ventriculardepolarization. The QRS complex corresponds to the wave of depolarization moving downwardfrom the AV node to the right and left ventricles.The ST segment starts from the end of the S wave (end of ventricular contraction /depolarisation) and ends at the beginning of the T wave and represents the period fromventricular depolarization to the initiation of ventricular repolarization. Even though it is usuallyisoelectric, there may be a 1mm elevation without any cardiac abnormality. ST segmentdepression on the other hand is never normal.The T wave and the QRS complex should both deflect in the same direction and the T waveamplitude should be a maximum of 5 mm in standard leads or 10 mm in precordial leads.Normal values for the QT interval should be corrected for the heart ratePage 3 of 20
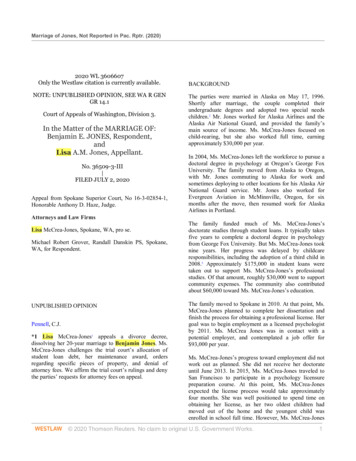
ELECTROPHYSIOLOGY OF THE CONDUCTION SYSTEM 2In the resting state, the outside of a cardiac cell is positive relative to the inside (and vice versa).Impulses are conducted through the heart by progressive depolarization. Cardiac muscle cellshave a resting membrane potential of -80 to -90 mV. The resting gradient is maintained bymembrane bound Na K ATPase that amasses potassium intracellularly and moves sodiumextracellularly. When the sodium and calcium channels open in response to neighbouring cellmembrane charge shifts the membrane potential increases. When the membrane potentialreaches 20 mV, an action potential (or depolarization) occurs after which cells are refractory tosubsequent action potentials for phases 1, 2 & 3 of the depolarization potential.2Figure 2: Transmembrane action potential generated by an automatic cardiac cell and therelationship of this action potential to the ECG trace.Phase 4 undergoes spontaneous depolarization from the resting membrane potential (-90 mV)until the threshold potential (broken line) is reached, whence depolarization (phase 0) occurs,corresponding to the QRS complex on the ECG.Phases 1, 2 and 3 represent repolarisation, with phase 3 corresponding to the T wave on theECG. The effective refractory period (ERP) is the time during which cardiac impulses cannot beconducted, regardless of the intensity of the stimulus (Phase 1).During the relative refractory period (RRP) (Phases 2&3), a strong stimulus can initiate anaction potential.Page 4 of 20
WHY DO AN ECG PRE-OPERATIVELY – IS IT NECESSARY?ACC/AHA 2007 Recommendations for Preoperative Resting 12-Lead ECG3Class I1.Preoperative resting 12-lead ECG is recommended for patients with at least 1 clinical riskfactor who are undergoing vascular surgical procedures. (Level of Evidence: B) 32.Preoperative resting 12-lead ECG is recommended for patients with known CHD,peripheral arterial disease, or cerebrovascular disease who are undergoing intermediaterisk surgical procedures. (Level of Evidence: C) 3Class IIa1.Preoperative resting 12-lead ECG is reasonable in persons with no clinical risk factors whoare undergoing vascular surgical procedures. (Level of Evidence: B) 3Class IIb1.Preoperative resting 12-lead ECG may be reasonable in patients with at least 1 clinical riskfactor who are undergoing intermediate-risk operative procedures. (Level of Evidence: B) 3Class III1.Preoperative and postoperative resting 12-lead ECGs are not indicated in asymptomaticpersons undergoing low-risk surgical procedures. (Level of Evidence: B) 3The decision to perform a preoperative EGC should be based on the patient's history, comorbidities and examination. Appropriate testing should be performed on all patients with signsor symptoms of cardiovascular disease, regardless of their preoperative status4.A normal ECG adds little to preoperative evaluation apart from providing a baseline forcomparison postoperatively. Although abnormal tracings are quite common, few are likely tochange management.According to ACC/AHA guidelines3, in major non-cardiac surgery, the presence of apathological Q wave on the preoperative ECG (found in 17% of the population) was associatedwith an increased risk of major cardiac complications (myocardial infarction, pulmonaryoedema, heart block, ventricular fibrillation or cardiac arrest). ECG abnormalities other than Qwaves are minor predictors of complications and may incur costly evaluation (the yield of whichis quite low) and delay necessary surgery.A normal ECG does not exclude cardiac disease because the specificity of an abnormal ECGfor predicting postoperative cardiac complications is only 26%5Ideally, a 12-lead ECG should be obtained within 30 days of surgery, in patients with stablecardiac pathology in whom a preoperative ECG is indicated3.Page 5 of 20
TECHNICAL ASPECTS OF AN ECG Patient name Date and time Quality- Baseline wandering- Interference Times and speeds- Standard sweep speed 25mm/sec small square 0.04 s (1mm) large square 0.2 s (5mm or 5 small squares)- Rhythm strip 25cm or 10 seconds Standard voltage setting- 1mV and should move the stylus vertically 10mm (2 large squares)Figure 3: Normal Cardiac Cycle1Page 6 of 20
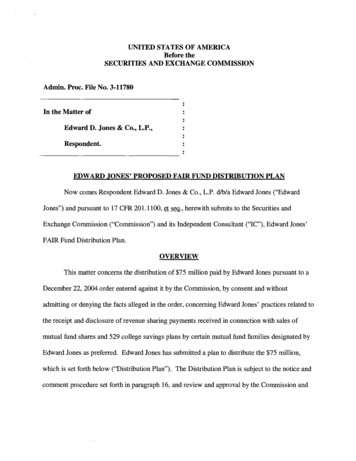
TEN STEP METHOD FOR READING ECGS1.Rate300 / (R-R interval)(R-R interval in big squares)OR (for AF) (# QRS complexes in rhythm strip) x6 (10 sec strip - speed 25mm/sec)Tips- Find an R wave that falls on one of the heavy lines- Tally the number of large squares before the next R wave 2.3.Rhythm Always ask 4 questions1:- Are normal P waves present?- Are QRS complexes narrow or wide?- What is the relationship between P waves and QRS complexes?- Is rhythm regular or irregular? Check if rhythm is sinus- P-waves must be normally shaped and constant- There must be a P-wave before every QRS complex- There must be a QRS complex after every P-wave- Rhythm should be regular (R-R intervals are a constant distance apart)- May be sinus tachycardia ( 100) or sinus bradycardia ( 60)- Sinus arrhythmia: 10% variation of heart rate with respiration Card method- Place an index card above the first two R waves on the left side of the rhythm strip.Using a sharp pencil, mark on the index card above the two R waves. Measure fromR wave to R wave across the rhythm strip, marking on the index card any variation inR wave regularity. If the rhythm varies by 0.12 second (3 small squares) or morebetween the shortest and longest R wave variation marked on the index card, therhythm is irregular. If the rhythm doesn’t vary or varies by less than 0.12 second, therhythm is considered regular.AxisFigure 4: Calculation of Axis6Figure 5: Average movement of depolarization7The axis is the direction of the mean electrical vector6 representing the average movement ofdepolarization (direction of current flow), which spreads through the heart to stimulate themyocardium to contract.Page 7 of 20
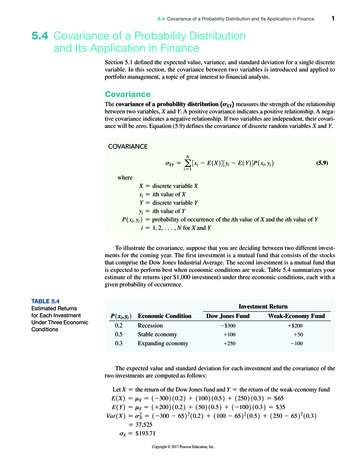
The usual direction of ventricular depolarization is downward and to the patient’s left which isthe direction of the mean QRS vector. Axis is calculated using the following:a. Rule of thumbNormal axisLeft axis deviationRight axis deviationExtremeRightaxisdeviationLead IPositivePositiveNegativeNegativeLead aVFPositiveNegativePositiveNegativeVectors-30 to 90 -30 to 90 90 to 180 180 to -90 b. Standard vector diagramFigure 6: Standard vector diagram to calculate QRS axis8c. To more accurately calculate the axis, first identify the axis quadrant. The axis liesat 90 to the limb lead in that quadrant where the QRS is the most isoelectric.Page 8 of 20
Figure 7: Methodology for locating the axis more precisely6 Mean QRS Vector tends to point:- Toward ventricular hypertrophy- Away from myocardial infarctionAxis deviation frontal planeAxis rotation horizontal plane Causes of LAD (Left Axis Deviation)11 Inferior MI Left anterior hemiblock WPW Syndrome VT from LV focus Causes of RAD (Right Axis Deviation)12 Right ventricular hypertrophy Pulmonary embolization Anterior lateral MI Left posterior hemiblock WPW Syndrome4.P waves (Atria) Morphology- P waves should all have the same shape as they normally all originate from theSA node. Varying shape implies different areas of origin e.g. ectopic beats- Normal height 2.5mm- Normal width 0.11secPage 9 of 20
5.PR interval 6.Time taken for the AV node to depolarizeFrom start of P wave to start of QRS complexNormally 0.12-0.2 sec (3 -5 small squares)PR interval 0.12sec – abnormally rapid AV node conduction down an accessorypathway eg. Wolf-Parkinson-White Syndrome (see later), Lawn-Ganong-Levinesyndrome or nodal rhythm. Look for slurring of the upstroke (delta waves)Q waves 7.Initial negative deflection of the QRS complex – may or may not be presentNormal occurrence in septal leads (V3 and V4)Significant Q waves – 0.04sec (1 small block) wide and 25% of the height of thesubsequent R waveQRS Complexes 8.Examine QRS complex for size / height, shape and durationNormal width / duration 0.12 sec (3 small squares). Longer duration indicatesconduction delaysLook for R wave progression with increasing size from V1 to V6At V3 – V4 usually get transition from dominant negative to dominant positiveVarious measurements of QRS will indicate either right or left ventricular hypertrophyT waves 9.Should be upright in leads V2-5May be flat or inverted in V1 or V2 – However if upright in V1 must also be upright in V2Height should be 1/8 – 2/3 of preceding R-waveAbnormal if inverted in leads I, II, V4-6U-wave: if present should be 25% of preceding T-waveST Segment Should not deviate from iso-electric line by 1mmElevation 1mm implies infarctionDepression 0.5mm implies ischaemia10. QT interval From the beginning of the QRS complex to the termination of the T-waveUsually 400msecVaries inversely with rateCorrected QT interval [(QT interval in sec)/ R-R’ interval]Normal corrected QT interval 0.35-0.42sec ( 420msec)Page 10 of 20
MORE COMMON ECG ABNORMALITIESHypertrophy and Enlargement 1The ECG can reveal whether a certain ventricular or atrial chamber is hypertrophied or enlargedin conditions such as valvular diseases, sustained hypertension, and inherited cardiac muscledisorders.Hypertrophy refers to an increase in muscle mass and is usually caused by pressure overload.Enlargement refers to dilatation of a particular chamber and is usually caused by volumeoverload.Enlargement and hypertrophy often co-exist.Three changes can occur on a wave of the ECG when a chamber hypertrophies or enlarges:a. Increase duration of wave: chamber can take longer to depolarize.b. Increase amplitude of wave: chamber can generate more current and thus a largervoltagec. Mean electrical vector / axis may shift: larger percentage of the total electrical current canmove through the expanded chamber.ATRIAL HYPERTROPHY (look at leads II and V1)Figure 8: Normal p waves in lead II and lead V11Right Atrial Hypertrophy – p pulmonale (increased height p wave) P wave height 2.5mm in II, III, aVFReferred to as p-pulmonale because caused by severe lung pathologyLeft Atrial Hypertrophy – p mitrale (increased duration p wave) P wave duration longer than 0.12 s (3 small blocks) in II Bifid p wave in I, II, aVF, aVL Biphasic P wave in V1 (negative component area than that of positive component)Page 11 of 20
VENTRICULAR HYPERTROPHYRight Ventricular Hypertrophy (RVH) Dominant R in V1 (R, Rs, RR’, qR or qRs) frontal plane axis 90oPersistent S wave V6RADStrain pattern of ST segment depression and T-wave flattening / inversion stronglysuggests hypertrophy (V1-3)Causes of a dominant R wave in V1: RVH RBBB Dextrocardia Duchenne’s muscular dystrophy Variants of WPW Dextrocardia Incorrect lead placementLeft Ventricular Hypertrophy (LVH)There are numerous criteria used for diagnosing LVH. The more criteria that are positive, thegreater the reliability of ECG diagnosis of LVH. Sum of S wave in V1 (or V2) R wave in V5 (or V6) 35 mm (Sokolow’s criteria) *S wave in V1, V2, V3 30 mmR wave in V6 26 mmR wave in V6 18 mmR wave in aVL 13 mm *R wave in aVF 20 mmR wave in I 14 mmStrain pattern of ST segment depression and T-wave flattening / inversion stronglysuggests hypertrophy (V4-6 ) ST segment depression, T wave flattening / inversion in leads facing left ventricle (V5, V6)May see LADPage 12 of 20
Abnormalities of RhythmThere are numerous ways to classify abnormalities of rhythm. A simple classification can befound in the book “Rapid Interpretation of EKG’s” by Dr D Dubin6.1. Irregular Rhythmsa. Sinus arrhythmia – irregular rhythm that varies with respiration. Identical p waves.b. Wandering pacemaker & Multifocal atrial tacchycardiac. Atrial fibrillation - irregular baseline and no recognizable P-waves, QRScomplexes are irregularly irregular2. Escape Rhythmsa. Atrial, junctional, ventricular - with progressively decreasing rate:60-80/min 40-60/min 20-40/min3. Premature beats – from an irritable automaticity focus may suddenly discharge andproduce a:a. Premature atrial beatb. Premature junctional beatc. Premature ventricular contraction – may be: multiple, multifocal, in runs, orcoupled with normal cycles4. Tacchyarrhythmiasa. Paroxysmal (sudden) tachycardia (150-250/min)i. Supraventricular tachycardia (SVT)ii. Ventricular tachycardiab. Flutter (250-350bpm)i. Atrial flutter – ‘saw tooth’ pattern. Many flutter waves needed to produce aventricular responseii. Ventricular flutter – rapid series of smooth sine waves Torsades de Pointesc. Fibrillationi. Atrial fibrillationii. Ventricular fibrillation5. Conduction blocksa. AV block – delay / prevent atrial impulses reaching ventriclesi. 1o AV block Consistently prolonged PR interval 0.2 s ( 1 large block)ii. 2o AV block Wenckebach (Type I): progressive lengthening of PR interval until aP wave is not followed by a QRS. Cycle then repeats Mobitz (Type II): Regular, punctual P waves but some not followedby a QRS. Can be quantified ie. 2:1, 3:1oiii. 3 (complete) AV block Complete atrioventricular dissociation. P-waves and QRS complexesare completely independent of each other.Page 13 of 20
Figure 9: Anatomy of the ventricular bundle branches1b. Bundle Branch Blocki. RBBB QRS 0.12 s plus, 2nd R wave in V1 rSR Reciprocal deep S waves in I, aVL, V5, V6 T-wave inversion leads V1-V3 MaRRoW Normal criteria for QRS complexes and for frontal plane axis applyii. LBBB QRS 0.12 s plus, Large T waves in opposite direction to main complex Wide R in V6 ( /- notched) Absent Q wave in V5, V6, WiLLiaM Normal criteria for QRS complexes, ST segments and T waves doNOT apply thus beware of making incorrect diagnosis of myocardialinfarction or LVH Normal criterion for frontal plane axis does applyc. Hemiblock (Essentially normal QRS duration)i. LAHB (Left Anterior Hemiblock) LAD more negative than - 30o Small Q wave in V1 and aVL Small R waves are visible in II, III and aVF (ie, absence of Q waveevidence of inferior infarction) LAHB and Inferior MI are the two commonest causes of LADPage 14 of 20
ii. LPHB (Left Posterior Hemiblock) Usually associated with inferior infarction RAD Deep or wide S wave in I Q wave in IIId. Bifasicular blocki. RBBB and left anterior hemiblock LAD (-30o to 90o)ii. RBBB and left posterior hemiblock RAD RBBB and left axis deviatione. Trifasicular block bifasicular block and first degree heart blockPRE-EXCITATION SYNDROMESWolff-Parkinson-White Syndrome (accessory conduction pathways) Accessory Bundle of Kent causes ventricular pre-excitation and paroxysmal tacchycardia PR interval less than 0.12 seconds Wide QRS complexes: 0.12 s Delta wave seen in some leads ie. Slurring of initial 0.03-0.05 s of QRS complex creates impression of a ‘shortened’ PR interval and lengthened QRS In the presence of ventricular pre-excitation the normal criteria for QRS complexes, STsegments and T waves do not apply Do not make incorrect diagnosis of LBBB or MIThe pneumonic HIS DEBS can be used to identify treatable, precipitating HypoxiaIschaemia & IrritabilitySympathetic stimulationDrugsElectrolyte disturbancesBradycardiaStretch (enlargement / hypertrophy)Myocardial Ischaemia / InfarctionAs blood flow to the heart is compromised, the ECG evolves from an ischaemic pattern to thatof injury and necrosis. The following 3 aspects of the ECG can be used to assess myocardialinjury.1. Q waves Significant Q wave is 1mm wide (0.04 s duration) OR 1/3 amplitude of QRS complexOld Q waves persist so must assess ST segments and T waves to determine if acutePage 15 of 20
2. T waves Inverted T wave of ishaemia is symmetrical (left half and right half are mirror images). Asymmetrical T wave inversion implies other pathology eg. LVH Normally T wave is upright when QRS is upright, and vice versa.3. ST segments ST segment changes imply an acute processElevation 1mm implies infarction (associated with significant Q waves)A tiny ‘non-Q wave infarction’ can occur with significant ST segment elevation but withoutassociated Q wavesDepression 0.5mm implies ischaemia or can represent ‘subendocardial’ infarctionMyocardial infarction- T wave becomes abnormally tall and ST segment begins to rise within a few hours- Within 24 hrs T-waves invert and ST elevation begins to decrease- Q waves occur within a few days, usually persist but may resolve in 10% ofpatients- T wave inversion may or may not persist- ST elevation rarely persists but may remain elevated in ventricular aneurysmInfarction location / Coronary Vessel Involvement: Posterior- Right coronary artery- Tall R waves with ST depression in V1 & V2- Mirror image changes in V1-2 Lateral- Circumflex coronary artery- Q waves in I & aVL Inferior- Right or Left coronary artery- Q waves in II, III, aVF Anterior- Anterior descending coronary artery- Q waves in V1-4 Anterolateral- V4-6, I, aVLPage 16 of 20
Electrolyte DisturbancesBecause the electrical events of the heart are dependent on electrolytes, it follows thatvarious electrolyte disorders can affect cardiac conduction and even lead to sudden death ifuntreated.1. Potassium (K )a. HyperK - Progressive changes in the ECG that can end with ventricular fibrillationand death- Likened to tying a piece of string to the T wave and gradually pulling up- T waves peak, PR interval prolonged, P waves gradually flatten anddisappear- QRS widens and combines with the T wave eventually producingventricular fibrillationb. HypoK - ST segment depression- Flattening of the T wave- U waveFigure 10: U wave12. Calcium (Ca2 )a.HyperCa2 - Increased Ca2 acceleratesrepolarisation – manifests as- shortened QT intervalb.HypoCa2 - Prolonged QT ous1. Hypothermia1 ECG changes occur when body temperature drops below 30 oC. Everything slows leading to sinus bradycardia and prolongation of all thesegments and intervals J wave (Osborne wave) is an abrupt ST segment elevation at the J point with anequally rapid drop to baselinePage 17 of 20
Figure 11: J wave of hypothermia12. Pulmonary Embolus (PE)1 Right ventricular hypertrophy with repolarization changes, due to acute rightventricular dilatation1 RBBB1 A large S wave in lead I, a deep Q wave in lead III and an inverted T wave in lead IIIis called the S1Q3T3 pattern1 Sinus tachycardia and atrial fibrillation are not uncommon1Figure 12: S1Q3 pattern of a massive PE3. COPD Low voltage Right axis deviation Poor R wave progression in precordial leads If progression to cor pulmonale and right sided heart failure:- P pulmonale & RVH with repolarisation abnormalitiesPage 18 of 20
TABLE WITH NORMAL VALUESPARAMETERNORMAL VALUESTime horizontal axisOne small square 0.04 sOne large square 0.2 s (5 small squares)25mm/s – strip length 25cm or 10 sStandard sweep speedVoltage vertical axisStandard voltage settingRhythmQRS axisP wavePR intervalQRS complexQT intervalST segmentT waveU waveOne small square 0.1 mVOne large square 0.5 mV (5 small squares)10 mm 1 mVEach p-wave followed by a QRSRate 60 – 100 bpm 10% variation with respiration-30 to 90 Height 2.5 mm in lead IIWidth 0.11 s in lead II0.12 – 0.2 s (3 – 5 small squares) 0.12 s (3 small squares) 0.42 s (corrected QTc)QTc QT interval in sec / R-R’ interval 1mm elevation / depressionUpright and asymmetrical (except AVR)Not usually seen. UprightPage 19 of 20
REFERENCES / USEFUL RESOURCE / TEXTBOOKS1.2.3.4.5.6.7.8.9.10.11.12.The Only EKG Book you will ever need 6th Ed, Thaler M, Lippincott, 2010Stoelting's Anesthesia and Co-Existing Disease, 5th Ed, Hines & Marschall, ChurchillLivingstone, 2008ACC/AHA 2007 Guidelines on Perioperative Cardiovascular Evaluation and Care forNoncardiac Surgery; Circulation-2007-Fleisher-e418-500Preoperative Testing Before Noncardiac Surgery: Guidelines and Recommendations,Feely M et al, Mayo Clinic, Rochester, Minnesota. Am Fam Physician. 2013 Mar 15;87(6): 414-418Preoperative electrocardiogram abnormalities do not predict postoperative cardiaccomplications in geriatric surgical patients, Liu LL et al, J Am Geriatr Soc. 2002;50:1186–1191Rapid Interpretation of EKG’s 6th Ed, Dubin D, Cover Publishing Co, 200012-Lead ECG: The Art of Interpretation, Garcia T, Jones and Bartlett Publishers, Inc, en.htm, last accessed 04 Jan 2015Reading an ECG in 10 Easy Steps, Prof James M, Part II FCA Refresher Course, UCT,2008ECG Workshop, Dr Lines D, Part II FCA Refresher Course, CH Baragwanath ary/basics/left-axis-deviation/ last accessed 4 Jan s/right-axis-deviation/ last accessed 4 Jan2015Acknowledgements for assistance:1.Prof Ted Sommerville2.Dr Leanne Drummond3.Dr Jorge CardosoPage 20 of 20
Figure 1: Normal ECG An ECG is the primary monitor for diagnosis of cardiac conduction abnormalities and rhythm disturbances. An ECG is a tracing created with electrodes on the skin that amplify cardiac electrical potentials. The normal ECG tracing is a complex composed of three waveforms: P wave (atrial depolarization),