Transcription
Talanta 86 (2011) 208–213Contents lists available at SciVerse ScienceDirectTalantajournal homepage: www.elsevier.com/locate/talantaFlow–batch miniaturizationSeverino S. Monte-Filho a , Marcelo B. Lima a , Stéfani I.E. Andrade a , David P. Harding a ,Yebá N.M. Fagundes a , Sergio R.B. Santos b , Sherlan G. Lemos a , Mario C.U. Araújo a, abUniversidade Federal da Paraíba, CCEN, Departamento de Química, Caixa Postal 5093, 58051-970, João Pessoa, Paraíba, BrazilInstituto Federal de Educação Ciência e Tecnologia da Paraíba – IFPB, Avenida 1 de maio, 720, Jaguaribe, 58015-430, João Pessoa, Paraíba, Brazila r t i c l ei n f oArticle history:Received 21 June 2011Received in revised form 29 August 2011Accepted 30 August 2011Available online 3 September 2011Keywords:Flow–batch analyzerUrethane–acrylate photo-resistMicrofabricationDeep ultraviolet-lithographyUV–vis spectrophotometryDetermination of Fe(II)a b s t r a c tThis study introduces the first micro-flow–batch analyzer ( FBA). A simple, low-cost, deepurethane–acrylate photo-resist ultraviolet-lithographic technique was used in its development. Detailsof the microfabrication process are presented including; the use of two superimposed photo-masksto improve the micro-channel and stop chamber border definition, as well as integration of anLED/phototransistor photometric pair, while using an open nylon-thread (fishing line) micro-mixingsystem for solutions homogenization. The system was used for photometric determination of Fe(II) inoral solution iron supplements employing the well-known 1,10-phenanthroline method, with instantaneously prepared micro-chamber calibration solutions. All analytical processes were accomplished bysimply changing the timing parameters in the control software. It must be emphasized here that there wasno outside preparation of the standard calibration solutions; the mixing was all done in-chamber/in-line,with all solutions maintained flowing while being proportioned for the measurement processes. The FBAresults were acceptable when compared to the reference method, and comparable to normal flow-batchsystems. It was possible both to project and build a low-cost probe with high sample throughput (about120 h 1 ), low relative standard deviations (about 1.1%), and reduced reagent consumption (30 times lessthan the reference method). The FBA system based on urethane–acrylate presented satisfactory physicaland chemical properties while keeping the flexibility, versatility, robustness, and multi-task characteristics of normal flow–batch analyzers. The FBA system contributes to the advance of micro-analyticalinstrumentation, while realizing the basic principles of “Green Chemistry”. 2011 Elsevier B.V. Open access under the Elsevier OA license.1. IntroductionFonseca et al. [1,2] have recently, developed micro-devicesfor flow injection analysis (FIA) using deep UV-lithography andurethane–acrylate photo-resist. Cured urethane–acrylate photoresin presents good chemical solvent resistance, and has highresistance to acids (37% HCl) and concentrated alkalis (40% KOH,80 C) [3].Given the large number of papers exploring FIA miniaturization, its success has been proven [4]. However, for each particularmethod, FIA systems require a specific apparatus assembly, whichlimits their widespread acceptance for routine laboratory analyses.The washing times, flow rates, reactors, tubing lengths and diameters are all critical. Moreover, the sample is injected by carrier thattransports it to the detector, the flow reaching the detector has concentration gradients, which exclude discrete measurements (i.e.there is a sample zone in the flow), and decreases the analytical sig- Corresponding author. Tel.: 55 833 216 7438; fax: 55 833 216 7437.E-mail address: laqa@quimica.ufpb.br (M.C.U. Araújo).0039-9140 2011 Elsevier B.V. Open access under the Elsevier OA license.doi:10.1016/j.talanta.2011.08.063nal. To circumvent these drawbacks, flow–batch analyzers (FBAs)are a good alternative and have now been miniaturized.During the last ten years versatile and flexible flow-batchanalyzers have been explored to automate various analytical processes including screening [5–7]; titration [8–13]; analyte addition[13–16]; internal standard solution addition [17]; and in linematching of pH [18], salinity [19] or acidity [20] between standardsolutions and samples. Flow–batch has been used for prior assays[9]; for developing titration concentration gradients [10], and concentration gradients for nonlinear calibrations [21]. Also includedare enzymatic [22], chemiluminescence [23], nephelometric [24],and UV–vis photometric [25] analyses of pharmaceutical formulations, as well as, in-line coulometric generation of standardsand titrants [11,13,14]. Liquid–liquid extractions [26] in-line univariant [23,24,27] and multivariate [22,28] calibrations have alsobeen accomplished. Flow–batch systems have begun to be mentioned in flow analysis textbooks as well [4,29].Flow–batch analyzers are instantaneous stop-chamber flow systems, which integrate batch and flow analysis methods into a singleapproach, through the use of programmed multi-commutation.The main component of the manifold is the mixing chamber (MC)into which different solutions can optionally be defined, added,
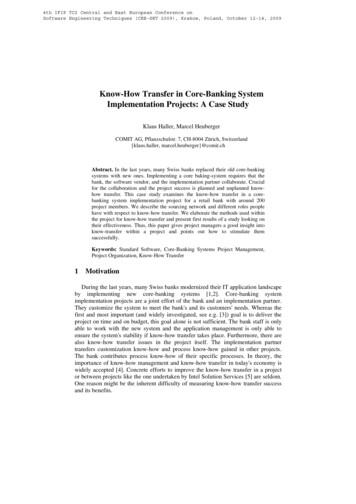
S.S. Monte-Filho et al. / Talanta 86 (2011) 208–213or removed with complete control [30]. This hybridization retainsthe reliability of classical batch mode methods, within a fullycomputer-controlled (in flow) system. A flow–batch system canbe viewed as a multi-purpose analytical accessory, easily attachedto conventional equipment for instrumental analyses. The mainadvantage of the flow–batch analyzer is that classical (discrete)methods can be utilized (in-flow) with precision and speed, and theanalytical methods can be chosen and developed on software. FBA’spresent precision and accuracy equal to FIA systems with comparably high sampling frequencies, yet with discrete throughput,less consumption, less reagent/sample manipulation, less chemicalwaste, and less chance of human error which results in a lower costper analysis.Since the introduction of “lab-on-a-chip” devices in the early1990s [31], miniaturization of analytical assays has become thereality for analytical instrumentation [32–36]. Besides portability,simpler operation, and time savings, miniaturization of analyticalinstrumentation brings dramatic volume reductions for reagents,samples, and waste. Miniaturization itself has become as importantto analytical chemistry as the microchip is to electronics.The first studies proposing micro-fabrication were based onthe existing techniques of the microelectronics industry, or usingthe silicon substrate. These were adapted to quartz and glass, andalthough glass is the preferred material for use in micro-fluidic systems, the cost of producing systems in glass has driven the searchfor other materials.The use of polymeric materials brings many benefits for simplified manufacturing. Microfluidic systems based on polymericmaterials produced by photolithography [37], hot molding [38],laser ablation [39] and direct printing with polyester–toner systems [40] are already in general use. Fernandes and Ferreira [3]developed an alternative micro-fabrication method using photosensitive urethane–acrylate oligomer resin. The resin polymerizeswhen exposed to ultraviolet radiation at 330 nm, and results in theformation of channels from 100 to 1000 m deep. Two sheets ofurethane–acrylate photo-resist were fabricated using deep ultraviolet lithography and then joined and sealed with UV, to form aunique micro-fluidic device.In this study, a micro-fabrication technique based on deep ultraviolet lithography and photo-polymerizable urethane–acrylatephoto-resist was used to develop a micro-flow–batch analyzer( FBA). It included an integrated photometer (light emitting diode(LED)/(PT) phototransistor pair) used for detection, and an insertednylon thread micro-mixing/homogenizing system. The proposed FBA was used to determine Fe(II) in iron-based supplements (oralsolutions) using the 1,10-phenanthroline method [41–43], and theresults were compared to a manual UV–vis photometric procedure(as reference) with the same oral samples. Details of the microfabrication process are presented.2. Experimental2.1. Reagents, solutions and samplesAll the reagents were of analytical grade unless otherwise stated,and all dilutions were carried out using double distilled, de-ionizedwater (18 M cm 1 ).A stock solution of 100.0 mg L 1 Fe(II) was prepared by dissolving 0.702 g of (Fe(NH4 )2 (SO4 )2 ·6H2 O), 1 g of ascorbic acid and20 mL of concentrated H2 SO4 in a 1 L volumetric flask. The acetatebuffer pH 5.5 was prepared from 0.10 mol L 1 of acetic acid and0.10 mol L 1 of sodium acetate. The reagent solution (0.10% (w/v)of 1,10-phenanthroline) was prepared by dissolving 0.100 g of 1,10phenanthroline in 1 mL of concentrated HCl and 50 mL of water andthen diluted quantitatively to the mark in a 100 mL volumetric flask.209Fig. 1. (a) Schematic diagram of the FBA and (b) photograph of the micro-chamberwith its dimensions. Micro-chamber ( CH); peristaltic pump (PP); mini-solenoidvalves for reagent (VR ), sodium acetate/acetic acid buffer pH 5.5 (VB ); standard working solution or samples (VS ); water (VW ) and waste discard (VD ); CD/DVD-ROM drivemotor (DM); nylon thread micro-mixer (NT M); electronic actuator (EA); microcomputer (MC); light emitting diode (LED); phototransistor (PT); electronic circuitryfor the LED/PT photometric pair (EC).urethane–acrylate photo-resist (Macdermid, trademark Flexlight M050) was acquired from Carimbos Medeiros Ltda, São Paulo– Brazil.Before analysis with the proposed FBA and the referencemethod, each iron-based supplement (oral solution) sample wasdiluted 1:2500 with 2% (v/v) of H2 SO4 .2.2. ApparatusFor construction of the FBA, a commercial photo-exposuremachine (Fotolight-MD2-A4, Carimbos Medeiros Ltda, Brazil), withtwo sets of mercury lamps (F15 W T12 Sylvania black light) wereused to expose the urethane–acrylate photo-resist to UV radiation.Overhead transparencies used as photo-masks were printed witha laser printer (HP LaserJet P2014). The micro-device was designedusing CorelDRAW X3. The revelation of the polymeric substrateafter UV exposition was done by removing the non-exposed resinwith an ultrasonic bath (model Ultracleaner 800A, Unique, Brazil).A model 8453 Hewlett-Packard (HP) diode array UV–vis spectrophotometer, equipped with cuvette (with an inner volumeof about 4 mL and an optical path of 1.0 cm) was used for theabsorbance measurements employing the reference method.2.3. The FBAFig. 1a presents the schematic diagram of the FBA. Topropel the solutions, an 8-channel peristaltic pump (Ismatec ,Switzerland) operating at 10 rpm was used. Minisolenoid valves(model LHDA 0531415H, Lee Company, USA) were employed to
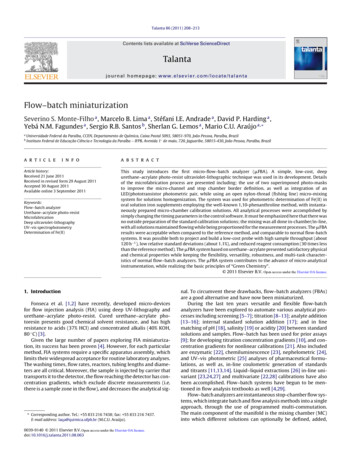
210S.S. Monte-Filho et al. / Talanta 86 (2011) 208–213Fig. 2. Manufacturing process diagram of the FBA.control flow directions and volumes. Teflon tubes with 0.5 mminternal diameters were used to transport fluids.A nylon 0.4 mm fishing line was used to ensure adequate mixingof the solutions inside the micro-chamber. The nylon thread wasadapted to a CD/DVD-ROM drive motor (model MDN3GT3CPAC,2000 rpm, 5 V d.c.), which controlled the mixing. Of course, thenylon thread entrance into the micro-chamber is left unsealed. Sothat, when solutions are introduced or removed from the microchamber, the inner air escapes by this air passage (in/out).A simple laboratory-made photometer [44] using a 5.0 mmdiameter LED (light emitting diode) as light source, and a 5.0 mmdiameter phototransistor as detector was built in to the FBAand employed for absorbance measurements. Its performance wasevaluated for photometric determinations of Fe(II) in iron-basedsupplements (oral solutions) with 1,10-phenanthroline (Phen) asa complexing agent [41–43]. Due to the broad absorption spectrum of the Fe(II)–Phen complex (about 510 nm), a green LED withmaximum emission at 522 nm was used as the light source.All related FBA tasks, such as data acquisition, valve, anddrive motor activation, were performed through a USB interface(USB6009, National Instruments , USA), which activates a lab madecontroller module. The controlling software was developed inLabVIEW 5.1 (National Instruments , USA).Fig. 1b presents an image of the FBA ready for use,which is inserted in a closed plastic black box with dimensions8.5 cm 10.0 cm 4.0 cm, to prevent effects of spurious radiationwhen the FBA is in operation.2.4. The manufacturing process of the FBAThe manufacturing process of the FBA was based on thatdescribed by Fernandes and Ferreira [3]. As shown in Fig. 2, identicalphotolithographic masks were printed on overhead transparencies using a laser printer (HP LaserJet P2014), and afterwards weresuperimposed and visually aligned employing a stereomicroscope(Carl Zeiss, model Stemi 2000C). They were then placed betweena 2 mm acrylic plate, and a 3.4 mm rubber frame to form a mold(Fig. 2a), that defines the thickness of one layer of the microchamber. The urethane–acrylate photo-resist was then spread(Fig. 2b) into the mold, which was closed using another acrylic plateas presented in Fig. 2c. The mold was subjected to exposition underUV radiation for 50 s using the upper lamps of the photo-exposureunit (Fig. 2d), and then for 100 s using the lower lamps (Fig. 2e).After exposure, the unexposed resin was removed in an ultrasonicbath with a 2% (v/v) detergent solution for 10 min, and dried undera nitrogen flow.Two different layers were prepared so that, when joined, theywould form the channels, micro-chamber, and cavities to supportthe LED and the PT (Fig. 2f). Then, both layers were joined and sealedby exposure to UV radiation in a nitrogen atmosphere for 15 min(Fig. 2g). The process causes irreversible plate adhesion. Finally, athin layer of liquid resin sealer was applied to the exterior surfacesof the Teflon tubes, LED and PT, adapted to FBA and exposed toUV for 15 min (Fig. 2h). The nylon thread micro-mixer (fishing line)is inserted after the resin sealer is applied. The optical path of the FBA photometer is about 0.6 cm.2.5. Analytical procedure for the FBABefore starting the procedure, the working solutions of eachchannel are pumped and recycled towards their flasks (Fig. 1a).Afterwards, valves VW VS , VR and VB are simultaneously switchedON for a time interval of 3.00 s, and the working solutions arepumped towards the micro-chamber ( CH) to fill the channelsbetween the valves and the CH. Then, immediately, valve VD isswitched ON for 5.00 s, and the excess solution in the CH is discarded by peristaltic pump (PP) aspiration. This channel filling and CH evacuation process should be performed whenever changingfluids or reservoirs to avoid superfluous air in the channels.The FBA analytical procedure for Fe(II) determination in ironbased supplements (oral solutions) using the 1,10-phenanthrolinemethod is briefly described using the FBA diagrams and controltimelines presented in Fig. 3. This procedure carries out in-linepreparations in the micro-chamber ( CH) of the blank (Fig. 3a),the calibration solutions (Fig. 3b), and the sample (Fig. 3c). Thetime intervals employed for each in-line preparation are for thedriver motor (DM), valve switchings (VW , VS , VR , VB and VD ), andabsorbance measurements (A). Each preparation Fig. 3a–c includesthe required programmed mixing/homogenization of the CH contents, absorbance measurements, emptying, and cleaning of thechamber. In Fig. 3b, tW and tS represent water and working solution addition times. These times vary in proportion to the standardsolution concentration being prepared. Homogenization is carriedout by switching ON the drive motor, and after absorbance measurements, the CH is emptied by switching ON valve VD , It is thencleaned by simultaneously switching ON valve VW and DM, to addwater to the CH and agitate. Soon afterwards, valve VD is switchedON to discard the contents of the CH. This cleaning/evacuationprocedure should be performed at least three times in order toguarantee efficient cleaning of the CH. All preparations are doneusing a peristaltic pump flow-rate of 32.0 0.2 L s 1 (n 10) forall channels.For in-line blank preparation, valves VW , VR and VB are simultaneously switched ON at the times indicated. Water, reagent andbuffer are brought into the CH, mixed and the blank absorbanceis measured.The in-line preparations of calibration solutions with 1.0, 2.0,4.0, 6.0, 8.0 and 10.0 mg L 1 of Fe2 were completed using astandard working solution of 20.0 mg L 1 Fe(II), which itself wasprepared by adequate dilution (1:5) of a standard stock solution100.0 mg L 1 Fe(II). In these preparations, valves VW , VS , VR andVB are simultaneously switched ON at the indicated times. Water,standard working solution, reagent and buffer are sent into the
S.S. Monte-Filho et al. / Talanta 86 (2011) 208–213211Fig. 3. The FBA diagrams and control timelines for in-line preparations in the micro-chamber of (a) blank, (b) calibration solutions with 1.0–10.0 mg L 1 Fe2 , and (c)sample. In (b), tW and tS represent water and working solution addition times. These times vary in proportion to the standard solution concentration being prepared. Thetime intervals (in seconds) are for the driver motor (DM), switching valves (VW , VS , VR , VB and VD ), and absorbance measurements (A). CH, homogenized, and the absorbencies of the calibration solutions are measured.For in-line preparation of the samples, previously diluted(1:2500) iron-based supplement (oral solutions) samples wereused. The procedure is similar to the in-line preparation of calibration solutions. The difference is that the samples are used insteadof the standard working solution.2.6. Analytycal procedure of the reference methodFor comparison, the proposed FBA performance was evaluatedagainst a manual reference UV–vis spectrophotometric methodanalyzing the same oral supplement samples. In the manualprocedure calibration solutions with 1.0, 2.0, 4.0, 6.0, 8.0 and10.0 mg L 1 Fe2 were prepared by taking 20 mL of reagent (1,10phenanthroline), 10 mL of buffer (acetate buffer pH 5.5) and 1.0,2.0, 4.0, 6.0, 8.0 and 10.0 mL of 100.0 mg L 1 Fe(II) standard stocksolution and completed with water to the mark of a 100 mL volumetric flask. Afterwards, 50 mL of each previously diluted (1:2500)iron-based supplement (oral solution) sample, 20 mL of reagentand 10 mL of buffer were transferred to a 100 mL volumetric flaskand completed with water to the mark. Finally, about 3 mL of eachcalibration solution and each of the sample Fe–Phen complexesproduced were transferred to the cuvette and their absorbenciesmeasured at 510 nm.3. Results and discussion3.1. Characterization of the FBADeep UV-lithography is easily reproducible and utilizes adhesive sealing in which two layers, partially cured by exposure to UV,are put in contact and polymerized. Due to the risk of clogging, thetechnique requires caution and optimization of the exposure times[2]. The resin was first submitted to an infrared analysis to verifythe minimum time required for polymerization of a 3.0 mm thicklayer with constant UV exposure. The absorbance at 8840 cm 1was measured from 20 s to 600 s of exposure time. The chosenwavelength is dependent on the vibrations of acrylate groups CHand CH2 at the second overtone. The absorbance decreases as thepolymer is produced, and acrylate groups located at the end of theoligomer chain are consumed [45]. After about 400 s absorbancereaches a minimum value, which does not change significantly during the exposure. A minimum time of 15 min is stipulated to ensureeffective sealing of the layers. After curing the photo-resist, a colorless and transparent material is obtained that does not absorbradiation in the visible range, allowing the use of optical detectors[3].Fonseca et al. [1] demonstrated the necessity of using photomasks with lines wider than 200 m to produce channels, whichwill not clog during the sealing process (due to irregularities intoner deposition). They also observed that the depth of the channels depends on the relative position of the photo-mask (a parallelexposure to the lamps leads to deeper channels) and the channelwidth is always narrower than the photo-mask line, which wasattributed to the light scattering and the use of a non-collimatedradiation beam.Considering the above, we proposed the use of two superimposed photo-masks to obtain the deeper and wider channelsrequired for the micro-chamber of the FBA (Fig. 4). This figureshows a simplified illustration of the effect of two photo-masksoverlapping in relation to seal perfection (unfilled portion of anideal printed line). Fonseca et al. [1] demonstrated that a tonerprinted line has imperfections in the printed limit of this line,which can be considered as random (noise). Consequently, onecan assume that with two superimposed transparencies the definition of the borders of the channels and the micro-chamber isimproved (Fig. 4a). This overlapping acts on the non-collimatedbeam (Fig. 4b) by minimizing radiation with a smaller angle ofincidence ( 1) on the resin at the expense of radiation witha higher angle of incidence ( 2). This phenomenon combinedwith parallel positioning of the design to the lamp overlappingallows the formation of deeper channels with better defined edges.By eliminating the use of printed photo-masks and phototypesetter technology the construction process becomes simpler andcheaper.
212S.S. Monte-Filho et al. / Talanta 86 (2011) 208–213Table 1Results for Fe(II) determinations (mg L 1 ) in iron-based supplements (oral solutions)by using the FBA and the manual UV–vis spectrophotometric method.Samples FBAManual12345R.S.D. (n 3)3.94.44.14.34.11.1%3.94.34.14.34.10.2%the reference method, absorbance measurements were performedusing 510 nm, and a cuvette with an optical path of 1.0 cm. Thespectrum of the Fe(II)–Phen complex has a maximum absorptionat 510 nm. We believe that using a 510 nm LED, and increasingthe optical path to 1.0 cm will give similar results to our referencemethod by augmenting sensitivity.Table 1 shows the results obtained in the determinations of Fe(II)for the iron-based supplements (oral solutions) using the FBA,and the reference method. No statistically significant differences ata confidence level of 95% were observed between the results whenapplying the paired t-test.The FBA presented a high analytical frequency of120 samples h 1 , low relative standard deviations (about 1.1%), andreduced reagent consumption (30 times less than the referencemethod).4. ConclusionsFig. 4. (a) Simplified illustration of the effect of two photo-masks overlappingin relation to seal perfection (unfilled portion of an ideal printed line), with twosuperimposed transparencies the definition of the borders of the channels and themicro-chamber is improved. (b) Simplified illustration of the effect of two superimposed photo-masks on the non-collimated UV beam with a smaller ( 1) and larger( 2) angle of incidence.The micro-chamber depth is twice the supporting layer depth ofthe LED and the PT. Fitting of the photometric components dependson the elastomeric properties of the material. However, both theLED and the PT had to be cut and polished to provide the correctoptical path, and to prevent any dead space between the components and the micro-chamber wall.In the macroscopic FBA, the dilution/mixing/reaction chamber contains a magnetic stirring bar to allow all the chemicals tobe thoroughly mixed similarly to classical batch analysis methods. Mixing and dilution of reagents, samples, and other solutionscan be easily controlled through software. For the FBA, reduceddimensions made it impossible to use a magnet bar inside themicro-chamber. To overcome this difficulty, a stirring rod with aflat end (shovel-shaped) was formed from a nylon thread. The complete mixing of solutions within the micro-chamber was obtainedin under 2 s, due to the high speed of the CD/DVD-ROM drive motor.Fig. 2h shows, in perspective, the three-dimensional model developed accommodating the stirring rod, tubing, LED, and PT.3.2. The FBA evaluationThe equations for the analytical curves obtained using the FBAand the reference method are respectively: A 0.018CFe(II) 0.023(r2 0.998) and A 0.14CFe(II) 0.14 (r2 0.9993). Both curves arelinear in the 1.0–10.0 mg L 1 Fe(II) range. The analytical curve ofthe FBA presents less slope or sensitivity, because the absorbancemeasurements are carried out using a LED/phototransistor pair,which has a shorter optical path (about 0.6 cm) and uses a greenLED with a maximum emission of 522 nm as its light source. InThis study proposed the fabrication of a micro-flow–batch analyzer, which was accomplished by employing deep UV-lithographywith photo-polymerizable urethane–acrylate photo-resist. Themicro-fabrication technique proved to be simple and reproducible.The use of two superimposed overhead transparencies enablesdeep micro-channel and micro-chamber creation and avoids clogging. The system was accurate when applied to the determinationof Fe(II) in iron-based supplements. With few manufacturing steps,it was possible to both project and build a low-cost microprobe, displaying high frequency discrete sampling throughput comparablewith normal flow-batch systems [5–28].AcknowledgementsThe authors would like to thank Dr. Alexandre Fonseca and Dr. I.M. Raimundo Jr. for their important suggestions, and the Brazilianagencies CNPq (for research fellowships) and CAPES (for scholarships).References[1] A. Fonseca, I.M. Raimundo Jr., J.J.R. Rohwedder, L.O.S. Ferreira, Anal. Chim. Acta603 (2007) 159–166.[2] A. Fonseca, I.M. Raimundo Jr., J.J.R. Rohwedder, R.S. Lima, M.C.U. Araújo, Anal.Bioanal. Chem. 396 (2009) 715–723.[3] J.C.B. Fernandes, L.O.S. Ferreira, J. Braz. Chem. Soc. 17 (2006) 643–647.[4] F.A. Iñón, M.B. Tudino, in: M. Trojanowicz (Ed.), Advances in Flow Analysis,Wiley-VCH, Weinheim, 2008, pp. 3–42.[5] R.A.C. Lima, S.R.B. Santos, R.S. Costa, G.P.S. Marcone, R.S. Honorato, V.B. Nascimento, M.C.U. Araújo, Anal. Chim. Acta 518 (2004) 25–30.[6] J.A. Nascimento, A.G.G. Dionísio, E.C.L. Nascimento, S.K.B. Freitas, M.C.U. Araújo,Quim Nova 33 (2010) 351–357.[7] E.C.L. Nascimento, M.C.U. Araújo, R.K.H. Galvão, J. Braz. Chem. Soc. 22 (2011)1061–1067.[8] R.S. Honorato, M.C.U. Araújo, R.A.C. Lima, E.A.G. Zagatto, R.A.S. Lapa, J.L.F.C. Lima,Anal. Chim. Acta 396 (1999) 91–97.[9] R.S. Honorato, E.A.G. Zagatto, R.A.C. Lima, M.C.U. Araújo, Anal. Chim. Acta 416(2000) 231–237.[10] E.P. Medeiros, E.C.L. Nascimento, A.C.D. Medeiros, J.G. Veras Neto, E.C. Silva,M.C.U. Araújo, Anal. Chim. Acta 511 (2004) 113–118.[11] C. Pasquini, E.V. Aquino, M.V. Rebouças, F.B. Gonzaga, Anal. Chim. Acta 600(2007) 84–89.
S.S. Monte-Filho et al. / Talanta 86 (2011) 208–213[12] M.B. Silva, C.C. Crispino, B.F. Reis, J. Braz. Chem. Soc. 21 (2010) 1854–1860.[13] S.C.B. Oliveira, E.C.S. Coelho, T.M.G. Selva, F.P. Santos, M.C.U. Araújo, F.C. Abreu,V.B. Nascimento, Microchem. J. 82 (2006) 220–225.[14] V.B. Nascimento, T.M.G. Selva, E.C.S. Coelho, F.P. Santos, J.L.S. Antônio, J.R. Silva,E.N. Gaião, M.C.U. Araújo, Talanta 81 (2010) 609–613.[15] L.F. Almeida, V.L. Martins, E.C. Silva, P.N.T. Moreira, M.C.U. Araújo, Anal. Chim.Acta 486 (2003) 143–148.[16] L.F. Almeida, V.L. Martins, E.C. Silva, P.N.T. Moreira, M.C.U. Araújo, J. Braz. Chem.Soc. 14 (2003) 249–253.[17] J.E. da Silva, F.A. da Silva, M.F. Pimentel, R.S. Honorato, V.L. da Silva, M.C.B.S.M.Montenegro, A.N. Araújo, Talanta 70 (2006) 522–526.[18] R.S. Honorato, J.M.T. Carneiro, E.A.G. Zagatto, Anal. Chim. Acta 441 (2001)309–315.[19] J.M.T. Carneiro, A.C.B. Dias, E.A.G. Zagatto, R.S. Honorato, Anal. Chim. Acta 455(2001) 327–333.[20] J.M.T. Carneiro, R.S. Honorato, E.A.G. Zagatto, Fresenius J. Anal. Chem. 368(2000) 496–500.[21] M.C. Souza, V.L. Martins, L.F. Almeida, O.D. Pessoa Neto, E.N. Gaião, M.C.U.Araujo, Talanta 82 (2010) 1027–1032.[22] M. Grünhut, M.E. Centurión, W.D. Fragoso, L.F. Almeida, M.C.U. Araújo, B.S.F.Band, Talanta 75 (2008) 950–958.[23] M. Grünhut, V.L. Martins, M.E. Centurión, M.C.U. Araújo, B.S.F. Band, Anal. Lett.44 (2010) 67–81.[24] C.C. Acebal, M. Insausti, M.F. Pistonesi, A.G. Lista, B.S.F. Band, Talanta 81 (2010)116–119.[25] S.K.B. Freitas, V.L. Silva, A.N. Araújo, M.C.B.S.M. Montenegro, B.F. Reis, A.P.S.Paim, J. Braz. Chem. Soc. 22 (2011) 279–285.[26] J.M. Silva, E.V. Anjos, R.S. Honorato, M.F. Pimentel, A.P.S. Paim, Anal. Chim. Acta629 (2008) 98–103.[27] L.F. Almeida, M.G.R. Vale, M.B. Dessuy, M.M. Silva, R.S. Lima, V.B. Santos, P.H.D.Diniz, M.C.U. Araújo, Talanta 73 (2007) 906–912.[28] V. Visani, S.R.R.C. Barros, H.A. Dantas Filho, L.F. Almeida, R.A.C. Lima, W.D.Fragoso, T.C.B. Saldanha, M.C.U. Araújo, Ecl. Quím. 34 (2009) 37–47.213[29] C. Pasquini, M.V. Rebouças, in: S.D. Kolev, I.D. Mckelvie (Eds.), ComprehensiveAnalytical Chemistry Advances in Flow Injection Analysis and Related Techniques, Elsevier, Amsterdam, 2008, pp. 617–638.[30] E.A.G. Zagatto, J.M.T. Carneiro, S. Vicente, P.R. Fortes, J.L.M. Santos, J.L.F.C. Lima,J. Anal. Chem. 64 (2009) 524–532.[31] A. Manz, D.J. Harrison, E.M.J. Verpoorte, J.C. Fettinger, A. Paulus, H. Ludi, H.M.Widmer, J. Chromatogr. 593 (1992) 253–258.[32] H. Becker, C. Gärtner, Electrophoresis 21 (2000) 12–26.[33] M.A. Schwarz, P.C. Hauser, Lab Chip 1 (2001) 1–6.[34] Q. Xue, F. Foret, Y.M. Dunayevskiy, P.M. Zavracky, N.E. McGruer, B.L. Karger,Anal. Chem. 69 (1997) 426–430.[35] M.H. Sorouraddin, M. Amjadi, M. Safi-Shalamzari, Anal. Chim. Acta 589 (2007)84–88.[36] S.I. Ohira, K. Toda, Anal. Chim. Acta 619 (2008) 143–156.[37] M.J. Madou, Fundamentals of Microfabrication, second ed., CRC Press, NewYork, 2002.[38] L. Martynova, L.E. Locascio, M. Gaitan, G.W. Kramer, R.G. Christensen, W.A.Maccreham, Anal. Chem. 69 (1997) 4783–4789.[39] M.A. Roberts, J.S. Rossier, P
laser printer (HP LaserJet P2014). The micro-device was designed CorelDRAW X3. The revelation of the polymeric substrate after UV exposition was done by removing the non-exposed resin an ultrasonic bath (model Ultracleaner 800A, Unique, Brazil). A model 8453 Hewlett-Packard (HP) diode a