Transcription
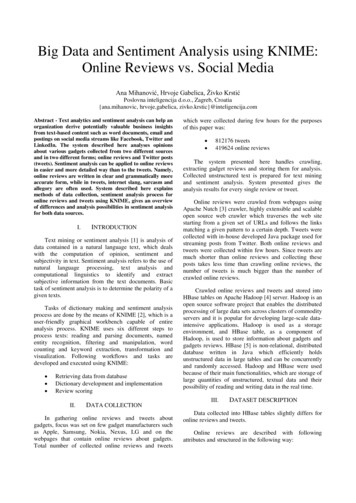
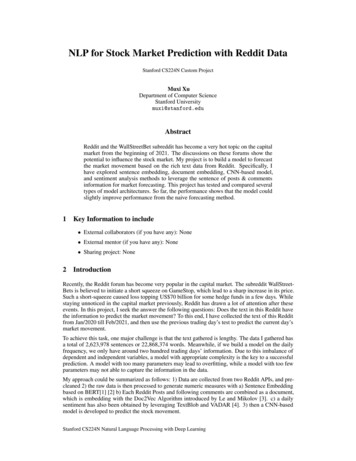
Algorithmic Trading using Sentiment Analysis and Reinforcement LearningSimerjot Kaur (SUNetID: sk3391 and TeamID: 035)the average of the profit/returns generated at time t normalizedover the standard deviation of the profit/returns generated at timet. Thus for this trading system, the performance criterion will bebased on Sharpe Ratio. The oracle [1] in terms of Sharpe Ratio isthat usually, any Sharpe ratio greater than 1 is consideredacceptable to good by investors. A ratio higher than 2 is rated asvery good, and a ratio of 3 or higher is considered excellent.AbstractThis work presents a novel algorithmic trading system based onreinforcement learning. We formulate the trading problem as aMarkov Decision Process (MDP). The formulated MDP is solvedusing Q-Learning. To improve the performance of Q-Learning,we augment MDP states with an estimate of current market/assettrend information and sentiment analysis of news articles of eachasset which are estimated using Neural Networks. Our proposedalgorithm is able to achieve a Sharpe Ratio of 2.4 when we invest 10,000 as compared to a baseline Sharpe Ratio of -0.2 and anestimated oracle Sharpe Ratio of 3.0.In our first approach, described in Section 4, we formulated theMDP consisting of historical price, number of stocks, cash inhand as states and solved using reinforcement learning. In section5, we extend our approach by augmenting the states with currentmarket/industry trend information and then solve the MDP usingreinforcement learning. In Section 6, we further extend ourapproach by augmenting the states with Sentiment Analysisperformed on news articles. Section 7 provides a summary andcomparison of our results. Section 8 further identifies the currentlimitations of our model. Finally, section 9 summarizes andconcludes this paper and lays foundation for our future work.1. IntroductionAlgorithmic trading also called as automated trading is theprocess of using computers programmed to follow a defined setof instructions for placing a trade in order to generate profits at aspeed and frequency that is impossible for a human trader. Animportant factor affecting the trading decisions is the ability ofpredicting stock market movement. The prediction of stockmarkets movement is considered to be a challenging task offinancial time series prediction due to the complexity of the stockmarket with its noisy and volatile environment, considering thestrong connection to numerous stochastic factors such as politicalevents, newspapers as well as quarterly and annual reports.2. Literature ReviewVarious different techniques have been implemented in literatureto train ML agents to do automated trading using machinelearning techniques. For instance, [Pierpaolo G. Necchi,2016][2], [David W. Lu, 2017][3], [Xin Du, Jinjian Zhai, KoupinLv, 2009][4], [Jae Won Lee, Jangmin O][5] all describe differentmachine learning techniques like deep q-learning, recurrentreinforcement learning, etc to perform algorithmic trading.[James Cumming, 2015][6] also wrote a book on the use ofdifferent reinforcement learning techniques within theAlgorithmic Trading Domain. The major strength of theseresearches is that they are trying to investigate the best possiblelearning algorithm so that automated trading can be performedwith minimum human intervention.In this project, I want to explore the possibility of building amachine learning agent that tries to learn an optimal tradingpolicy/strategy using several machine learning techniques likereinforcement learning. The problem we are trying to solve inthis project can be summarized as: “Train a ML Agent to learnan optimal trading strategy based on historical data and stockmarket news in order to maximize the generated profits.”In particular, the project would involve the following sub-steps,as shown in Figure 1 below:1. Formulate the trading problem as a Markov Decision Process(MDP) which is then solved using Q-learning withfunctional approximations. The states of the MDP not onlyinvolve historical price, number of stocks, cash in hand butalso trend information (step 2) and sentiment score (step 3).2. Perform Trend Analysis using technical market indicators asinput to neural networks and obtain stock market trend as theoutput signal.3. Perform Sentiment Analysis on news articles of each asset.Rather than maximizing profits, most modern fund managersattempt to maximize risk-adjusted return as advocated by ModernPortfolio Theory. The Sharpe Ratio is the most widely-usedmeasure of risk-adjusted return (Sharpe) and can be calculated asOn the other hand, a large number of implementations have beendone to perform sentiment analysis on news articles and twitterfeeds. The paper of [Gyozo Gidofalvi, 2011][7] predicts theshort-term stock price movements using financial news articles.The paper of [Naveed Ahmad, Aram Zinzalian, 2010][8]explores stock volatility forecasting from quarterly earnings calltranscripts of the 30 DOW component stocks. The paper of[Qicheng Ma, 2008][9] presents a scheme in which 29 stocknames are picked from DJI and related articles and are classifiedas positive or negative using Naive Bayes and Maximum Entropyclassifier. The paper [Ravi Parikh, Matin Movassate, 2009][10]uses Unigram and Multi-nomial Bigram Naive Bayes to detectsentiment. The paper of [Gabriel Fung, Jeffrey Yu, Hongjun Lu,Figure 1: Proposed Approach1
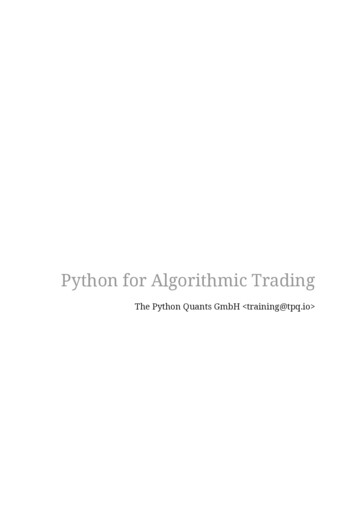
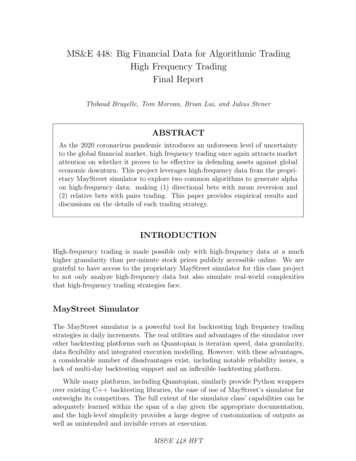
2005][11] predicts the movements of stock prices based on thecontents of the news stories. All these researches are trying toclassify the news more accurately, thereby trying to obtainsignificant accuracy.Rewards: The reward at any point is calculated as the[Current Value of the Portfolio - Initial Investment].Discount Factor: In this project, the discount factor is assumedto be 1 always.In this project we follow a novel approach of combining both theimplementations where we gather information from varioussources that have big impact on the stock market and supplyingthis additional information to better learn an optimalpolicy/strategy. Thus the ML agent not only just learns an optimaltrading strategy based on historical prices but also on additionalinformation based on sentiment and trend of the market to makean informed decision.Solving the MDP:The MDP described above was solved using vanilla Q-Learningalgorithm with functional approximations[17].The algorithm can be described as:On each (s, a, r, 𝑠ʹ):𝑄 %& 𝑠, 𝑎 1 𝜂 𝑄 %& 𝑠, 𝑎 𝜂(𝑟 𝛾𝑉 %& 𝑠′ )where: 𝑉 %& 𝑠′ 3. Dataset Used𝑚𝑎𝑥89 ; & ?(? @ )𝑄 %& 𝑠′, 𝑎′s current state, a action being taken, 𝑠′ next state, 𝛾 discountfactor, r reward, 𝜂 exploration probability.5-years of daily historical closing prices (2011-2016) for variousstocks were obtained from Yahoo Finance[12] to form thedataset. For this project, the results are restricted to a portfolioconsisting of 2 stocks [Qualcomm (QCOM), Microsoft (MSFT)].As Q-learning doesn’t generalize to unseen states/actions,function approximation has been used which parameterizes 𝑄 %&by a weight vector and feature vector which can be described as:On each (s, a, r, 𝑠ʹ):10-years of news articles have also been obtained from ReutersKey Development Corpus[13] for both Qualcomm andMicrosoft. 5-years of these news articles (2006-2010) are used astraining dataset and the remaining (2011-2016) are used as testdataset to perform Sentiment Analysis. The headlines weremanually classified to obtain the ground truth sentiment score: 1if the news provides a positive sentiment and -1 if the newsprovides a negative sentiment.𝑤 𝑤 𝜂 𝑄 %& 𝑠, 𝑎; 𝑤 𝑟 𝛾𝑉 %& 𝑠′𝜙(𝑠, 𝑎)where: 𝑄 %& 𝑠, 𝑎; 𝑤 prediction and 𝑟 𝛾𝑉 %& 𝑠′ targetFor our problem, we used the following feature vectors: (a)Number of Stocks of each asset, (b) Current Stock Price of eachasset and, (c) Cash in Hand.Also, in order to deploy the tradeoff between exploration andexploitation, epsilon-greedy algorithm has been used whichexplores with probability ε and exploits with probability 1 ε. Anexploration probability of 0.2 has been chosen for this project.4. Problem FormulationThis section describes how the problem of choosing when toBUY/HOLD/SELL a portfolio of stocks is formulated as aMarkov Decision Process (MDP). The section further elaborateson how the MDP is solved by learning an optimal policy usingQ-learning with functional approximations. It may be noted thatsince the state space with real valued stock prices is really huge,the state space has been discretized for the stock prices.Results:This section discusses the performance of the above implementedQ-learning system. The Q-learning system was run on a datasetcontaining 5-year stock prices and number of trials as 10,000.The plot below shows how the Sharpe Ratio evolves withincreasing historical time period. As can be observed, the MLagent slowly but steadily learns an optimal strategy that increasesthe Sharpe Ratio as more historical data is provided, thusdisplaying incremental performance and is successful inachieving the Sharpe Ratio of 0.85.MDP Formulation:MDP[16] can be formulated by describing its States, Actions,Transition Probability, Rewards, and discount factor.States: [(#of Stocks for each asset), (Current Stock Price for eachasset), Cash in Hand]The first part of the state consists of a tuple containing number ofstocks for each asset. The second part of the state consists of atuple containing the daily closing stock price for each asset.Finally, the third part of the state consists of cash in hand whichis evaluated at every time step based on the action performed.Initial State: [(0, 0.), (𝑆1, 𝑆2.), 10,000] i.e. the agent has 0stocks for each asset and only 10,000 as an initial investment.Actions: At any point the agent chooses from three actions: BUY,SELL, and HOLD. Action BUY buys as many stocks for eachasset as possible based on the current stock price and cash inhand. Action SELL sells all the stocks in portfolio and adds thegenerated cash to cash in hand. Action HOLD, does nothing, i.e.neither sells nor buys any stock of an asset.Transition Probability: The transition probability is chosen tobe 1 always as whenever the action is BUY/SELL we are sure toBUY/SELL the stocks of an asset. Here the randomness in thesystem comes from the fact that the stock price changes just aftera stock is bought or sold i.e. after every time step.Figure 2: Sharpe Ratio vs historical time period using Q-LearningTo validate that the algorithm was effective in learning theoptimal strategy, Monte-Carlo simulation has been performed asbaseline. In this simulation, the agent is forced to choose anaction at random. As can be observed in the plot below, the MLagent generates negative Sharpe Ratio, hence validating the Qlearning algorithm for this problem.2
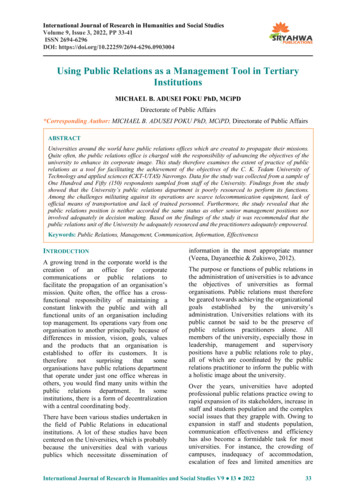
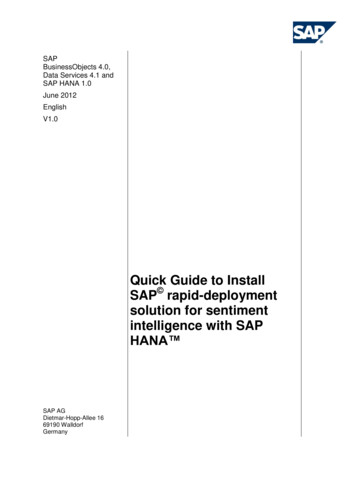
4.Stochastic D𝐷% 𝑖 5.𝐾% 𝑖 2 𝐾% 𝑖 1 𝐾% 𝑖3Relative Strength Index100)1 𝑅𝑆𝐴𝑣𝑒𝑟𝑎𝑔𝑒 𝑜𝑓 𝑡 𝑑𝑎𝑦 9 𝑠 𝑢𝑝 𝑐𝑙𝑜𝑠𝑒𝑠𝑤ℎ𝑒𝑟𝑒 𝑅𝑆 𝐴𝑣𝑒𝑟𝑎𝑔𝑒 𝑜𝑓 𝑡 𝑑𝑎𝑦𝑠 9 𝑠𝑑𝑜𝑤𝑛 𝑐𝑙𝑜𝑠𝑒𝑠𝑅𝑆𝐼 100 (6.Larry William’s R%𝑅% 𝑖 Figure 3: Sharpe Ratio vs historical time period using MCS𝐻& 𝑐𝑝 𝑖 100𝐻& 𝐿&Where cp(i) is the closing price, 𝐿& is the lowest price of last tdays, 𝐻& is the highest price of last t days. Also, the six technicalindicator values represent continuous values in different ranges.So the input data is scaled in the range 0–1 using the min maxnormalization as follows:5. Problem Formulation Augmented with Trend AnalysisWhen a human trader makes a trading decision, in addition to thestock price, his decision is also based on his view of themarket/industry’s trend so that he is able to profit from theupward movement and avoid the downfall of a stock. In thissection, we are trying to capture the market’s current trend anduse this trend information as an additional feature in the statedefinition of our MDP formulation. The practical implementationof the above approach entails two steps: (A) Finding the currenttrend information (B) Augmenting the trend information intoMDP formulation.𝑦 𝑥 𝑥f 𝑥f8g 𝑥f Where y normalized value, x value , 𝑥f minimum valueand 𝑥f8g maximum value of the series to be normalized.The scaled technical indicators are then inputted into the neuralnetwork. An inbuilt neural network toolbox in python, HPELM[14], has been used in this project to get the output tradingsignal (OTS) in range 0-1. The uptrend and down trend areclassified using the following methodology:If OTS Mean (OTS), predicted trend is up (1) else down (0).5.A Using Market Technical Indicators and Neural Networkto find Trend InformationTo identify the trend information, six popular market technicalindicators[15] calculated from the historical stock price are usedas the input features for the neural network. The output of thisneural network is used to perform the classification into twostates, 1 if an upward trend is observed and 0 if downward trendis observed.The chart below shows historical price (blue) and predicted trendstates(orange) ( 2 years) by the neural network for test data(QCOM 52572893213533854174494810Figure 5: Trend States vs Historical Price for QCOM stock5.B Augmenting the trend information into MDP formulationThe above section described how we can identify current trend instock data using neural networks. To provide this information toour ML agent, we augmented the state of the system with thisinformation and the new state implemented was [(#of Stocks foreach asset), (Current Stock Price for each asset), Cash in Hand,(trend of each asset)]. All other aspects of the MDP definition aresame as before.Figure 4: Trend Analysis performed using neural networksThe six technical indicators that are used as input for the neuralnetwork can be calculated as shown below:1. Simple Moving Average: t 15&1𝑐𝑝(𝑖)𝑡 JKMoving Average Convergence and Divergence𝑀𝐴𝐶𝐷 𝐸𝑀𝐴KO 𝐸𝑀𝐴OP𝑀𝐴& 2.𝑤ℎ𝑒𝑟𝑒 𝐸𝑀𝐴 𝑖 𝑐𝑝 𝑖 𝐸𝑀𝐴 𝑖 1 𝐸𝑀𝐴(𝑖 1)3.Stochastic K𝐾% 𝑖 The MDP was still solved using Q-learning approach as insection 4, with the only difference being that the trend of asset isalso being used as feature in our function approximation basedQ-Learning.2𝑡 1Similar to Section 4, MDP was run over the data-set consistingof 5-year time period and 10,000 trials and Sharpe Ratio wasreported for each data point. The plot below shows that theSharpe Ratio of 1.4 is obtained and is much higher and stable ascompared to Section 4.𝑐𝑝 𝑖 𝐿& 100𝐻& 𝐿&3
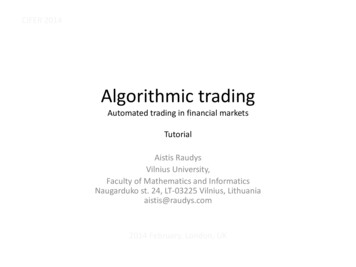
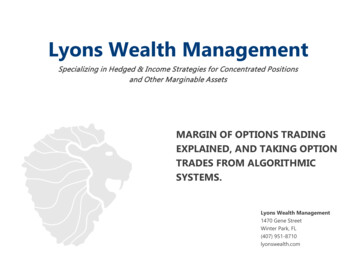
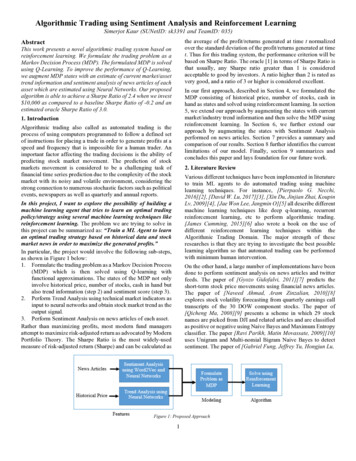
networks that are trained to reconstruct linguistic contexts ofwords. Word2vec takes as its input a large corpus of text andproduces a vector space, typically of several hundred dimensions,with each unique word in the corpus being assigned acorresponding vector in the space. Word vectors are positionedin the vector space such that words that share common contextsin the corpus are located in close proximity to one another in thespace.We use the pre-trained Word2Vec model to obtain a 100dimensional vector for each of the headline obtained forQualcomm and Microsoft (2006-2016) from Reuters KeyDevelopment Corpus.Figure 6: Sharpe Ratio vs historical time period using Q-LearningSimilar to section 4, Monte-Carlo Simulation was considered asa baseline. The plot below shows that providing the trendinformation also does not help in improving the performanceobtained from random actions and Monte-Carlo Simulation.Figure 7: Sharpe Ratio vs historical time period using MCS6. Problem Formulation Augmented with Sentiment Analysisand Trend InformationDue to the volatility of the stock market, price fluctuations basedon sentiment and news reports are common. As humans, we caneasily interpret the sentiment of a news article. However, theproblem lies when we have multiple stocks in our portfolio, mostof which are being mentioned frequently in the news or socialmedia sites. The average adult reads 300 wpm and takesapproximately 2 minutes to read an article with 600 words.Within 2 minutes, 10 of the portfolio stocks generate over 100articles. It is impossible for humans to keep up with the massivedata overload which is where sentiment analysis comes into play.Figure 8: Sentiment Analysis using Word2Vec Model and Neural NetworksNeural Network:Subsequently, we use these 100-dimensional vectors as input toa neural network with a single hidden layer (120 dimensions) andcross entropy loss. The sigmoid function has been used asactivation for the hidden layer, and softmax function for theoutput layer. The forward-propagation and back-propagation[20]for the cross entropy loss with regularization (λ 0.0001) areimplemented to perform the classification.The model was trained on news from year 2006 to 2010. Thenews headlines from year 2011 to 2016 acted as a test set. Thefigure 9 below shows the training and test set accuracy using theproposed method. As is evident, the model is able to achieve atraining accuracy of 100% with the test set accuracy being 80%. It may be noted that finding the sentiment from just theheadline is rather a difficult task as headlines can often beambiguous.In this section, sentiment analysis is being performed on the newsarticles of each stock and use this sentiment score as an additionalfeature in the state definition. The practical implementation of theabove approach entails two steps: (A) Perform sentiment analysis(B) Augmenting the sentiment score into MDP formulation.6.A Sentiment Analysis using News Articles of each assetThe sentiment analysis has been performed in two steps, asshown in the figure 8 below. The first step involves passing thenews articles through a pre-trained Word2Vec model andobtaining N-Dimensional Vector for each headline. The secondstep involves passing these vectors as inputs to a neural networkand obtaining the classification also known as sentiment score.Word2Vec Model:As a first step, we used a pre-trained Word2Vec Model forReuters News Corpus (using NLTK Library[18]). Word2Vec[19]is a group of related models that are used to produce wordembeddings. These models are shallow, two-layer neuralFigure 9: Accuracy of training(red) and test(blue) set vs the number of epochs4
6.B Augmenting the sentiment score into MDP formulationThe above section described how we can obtain the sentimentscore using Word2Vec model and neural networks.Consequently, we augmented the state of the system with thisinformation and the new state implemented was [(# of Stocks foreach asset), (Current Stock Price for each asset), Cash in Hand,(trend of each asset), (sentiment score of each asset)]. All otheraspects of the MDP definition are same as before.achieved when we use Q-Learning to solve MDP augmented withtrend and sentiment analysis. This is expected because adding thetrend information and sentiment scores to our state helps the MLagent to make much more informed decisions.8. Challenges and Error AnalysisWe observed that while our proposed approach works well in alot of scenarios, there are still significant challenges that need tobe solved to build high performing autonomous trading system.Some of the major challenges/limitations in our current approachare:a. Large State Space: The exponential increase in the stateaction pair space as the number of assets in our portfolioincreases. Since our state definition consists of (number ofstocks for each asset, stock prices of each asset, cash inhand, trend path followed by each asset, sentiment score ofeach asset), as the number of assets increase, the action spaceincreases exponentially. This increases the run-time of oursystem considerably, and limits the performance of thesystem.b. Accuracy Improvement of Sentiment Analysis: Theaccuracy of our proposed method of estimation of sentimentscore can be improved by taking the content of news articlesrather than just taking the headlines as headlines can often beambiguous.9. Conclusion and Future WorkThe MDP was still solved using Q-learning approach as insection 4 and 5, with the only difference being that the trend ofasset and sentiment scores are also being used as feature in ourfunction approximation based Q-Learning.Similar to Section 4 and 5, MDP was run over the data-setconsisting of 5-year time period and 10,000 trials and SharpeRatio was reported for each data point. The plot below shows howthe Sharpe Ratio evolves with increasing historical time period.It may be noted that the Sharpe Ratio of 2.4 is obtained and ismuch higher and stable as compared to Section 5.In this paper, we implemented reinforcement learning algorithmparticularly Q-Learning with functional approximations, to traina ML agent to develop an optimal strategy to perform automatedtrading. In the first section, the ML agent was successful inlearning the optimal policy, achieving a Sharpe Ratio of 0.85. Inorder to improve the learning efficiency of the agent, TrendAnalysis using Neural Networks was performed and the MDPwas augmented with trend information. The agent performedbetter and was successful in achieving the Sharpe Ratio of 1.4.Furthermore, in order to capture the volatility in the market dueto news reports, Sentiment Analysis using Word2Vec model andNeural Networks was performed. The sentiment score was thenaugmented to the MDP formulation and solved. The agentperformed significantly better and achieved a Sharpe Ratio of 2.4.Figure 10: Sharpe Ratio vs historical time period using Q-LearningSimilar to previous sections, Monte-Carlo Simulation isconsidered as a baseline. The plot below shows that providing thetrend and sentiment information also does not help in improvingthe performance obtained from random actions and MCS.However, although the average profit generated in 10,000 trialsis closer to Oracle (Sharpe Ratio 3.0 being excellent), we stillsee a significant run-to-run variation. The run-to-run variationscould be because of limited data set, i.e. we only have stock dataand news articles test data for 5-year time period.Figure 11: Sharpe Ratio vs historical time period using MCSFinally, our current work can be extended in various ways. Forinstance, while performing Sentiment Analysis, only the newsheadlines have been used. This can be further extended to includethe content of news article which will help the model to classifythe news more accurately, thereby increasing the accuracy.Further, given the large state space, it might be worthwhile to tryto use policy gradient methods which directly try to estimate thebest policy without really generating the Q-Value. Deep QLearning and Deep Reinforcement learning methods haverecently been applied to many different problems and haveachieved very good performance. Based on the initial resultsfrom this report, we feel it could be a good idea to try toimplement Deep-Reinforcement learning methods for thisproblem too.7. Summary of ResultsThe table below summarizes the Sharpe Ratio achieved from10,000 trials using the various proposed algorithms.MethodsSharpe RatioQ-Learning0.85RLMCS-0.5Q-Learning1.4RL TrendMCS-0.2Q-Learning2.4RL Trend Sentiment ScoreMCS-0.2Table 1: Summary of Results from various proposed algorithmsWhile all algorithms are better than our baseline Monte-Carlosimulations (MCS), as expected, the best performance is5
10. References[1] at-goodsharpe-ratio.asp[2] Pierpaolo G. Necchi, Reinforcement Learning For AutomatedTrading, 2016[3] David W. Lu, Agent Inspired Trading Using RecurrentReinforcement Learning and LSTM Neural Networks, July 2017.[4] Xin Du, Jinjian Zhai, Koupin Lv, Algorithm Trading using Q Learning and Recurrent Reinforcement Learning, Dec 2009[5] Jae Won Lee, Jangmin O, A Multiagent Approach to Q-Learningfor Daily Stock Trading, Nov 2007[6] James Cumming, An Investigation into the Use of ReinforcementLearning Techniques within the Algorithmic Trading Domain, June2018[7] Győző Gidófalvi, Using News Articles to Predict Stock PriceMovements, University of California, San Diego La Jolla, CA92037, 2001[8] Naveed Ahmad, Aram Zinzalian, Predicting Stock Volatility fromQuarterly Earnings Calls and Transcript Summaries using TextRegression, June 2010[9] Qicheng Ma, Stock Price Prediction Using News Articles, CS224NFinal Report, 2008[10] Ravi Parikh, Matin Movassate, Sentiment Analysis of UserGenerated Twitter Updates using Various ClassificationTechniques, June 2009[11] Gabriel Fung, Jeffrey Yu, Hongjun Lu, The Predicting Power ofTextual Information on Financial Markets, IEEE IntelligentInformatics Bulletin, Vol. 5. No. 1, June 2005.[12] Yahoo Finance, https://finance.yahoo.com/[13] Reuters Key Development .O/keydevelopments[14] http://hpelm.readthedocs.io/en/latest/index.html, HP-ELM[15] Rajashree Dash and Pradipta Kishore Dash, A hybrid stock tradingframework integrating technical analysis with machine learningtechniques, March 2016.[16] Markov Decision Process, Lecture Notes[17] Q-Learning and Epsilon Greedy Algorithm, Lecture Notes[18] NLTK Library, http://www.nltk.org/[19] Word2Vec Model, https://en.wikipedia.org/wiki/Word2vec[20] Forward-propagation and back-propagation, Lecture Notes6
Algorithmic trading also called as automated trading is the process of using computers programmed to follow a defined set of instructions for placing a trade in order to generate profits at a speed and frequency that is impossible for a human trader. An important factor affecting