Transcription
R ProgrammingRobin Evansrobin.evans@stats.ox.ac.ukMichaelmas 2014This version: November 5, 2014AdministrationThe course webpage is athttp://www.stats.ox.ac.uk/ evans/teaching.htmLectures are at 10am on Mondays and Wednesdays, and practicals at 9amon Tuesdays and Thursdays; in reality, there will be rather a lot of overlapbetween these two formats.Please bring your own laptop to use during all classes, and ensure that youhave R working (see below). If you don’t have access to a laptop, let meknow and we will try to provide one.I will hold office hours each week during Michaelmas term on Wednesdaysbetween 12pm and 1pm; my office is on the first floor of 2 SPR, room204. I’m very happy to help with any difficulties or problems you are havingwith R, but please take steps to help yourselves first (see below for alist of resources).SoftwareYou should install R on your own computer at the first opportunity. Visithttp://cran.r-project.org/for details. Ensure you have the latest version (as of the start of Michaelmas2014, this was version 3.1.1). Try to spend some time getting used to thebasics of the software, including arithmetic operations and functions. Thereare many excellent online tutorials for this purpose.1
ResourcesA strength of R is its help files, which we will discuss. These are accessedwith the ? and ? commands.The internet has almost all the answers, and knows much more about Rthan I do. If you have a problem, it’s extremely likely that someone willhave had the same difficulty already, and posted a question on an internetforum.Books are useful, though not required. Here are a some of them with briefcomments.1. Venables, W.N. and Ripley, B.D. (2002) Modern Applied Statistics withS. Springer-Verlag. 4th edition.The classic text.2. Chambers (2010) - Software for Data Analysis: Programming with R,Springer.One of few books with information on more advanced programming (S4,overloading).3. Wickham, H. (2014) Advanced R. Chapman and Hall.A great new book on the more advanced features: a good follow up to thisclass.4. Crawley, M. (2007) The R Book. Wiley.Very thorough.5. Fox, J. (2002) A R and S-PLUS Companion to Applied Regression. Sage.Does what it says.6. Ligges, U. (2009) Programmieren mit R. Third edition. Springer.In German(!)7. Rizzo, M. L. (2008) Statistical Computing with R. CRC/Chapman &Hall.More computational – different examples to the other books.8. Braun, W. J. and Murdoch, D. J. (2007) A First Course in StatisticalProgramming with R. CUP.Detailed and well written, but at a rather low level. A bit redundant giventhe above.2
9. Maindonald J. and Braun, W. J. (2003) Data Analysis and Graphicsusing R Second or third edition CUP.Advanced statistical graphics10. Spector, P. (2008) Data Manipulation with R. SpringerEspecially for data manipulation.11. Dalgaard, P. (2009) Introductory Statistics with R. Second Edition. Springer.Probably redundant given the above.Getting the Most out of the ClassLearning R has much in common with learning a natural language: it’s easyto get going with a few simple phrases, though you’ll find some idiosyncrasies in the syntax, and occasional aspects are downright illogical. Onceyou’ve mastered these few difficulties, the only barrier to fluency is the vastvocabulary of R: even in the basic packages there are many commands whichyou will never use or understand, but the more you learn the more elegantlyyou will be able to express yourself. There is a smaller core of ‘everyday’ language which we will focus on, and which you will be expected to understandin exams and practical assessments.These lecture notes are intended for reference, and will (by the end of thecourse) contain sections on all the major topics we cover. Lectures will notfollow the notes exactly, so be prepared to take your own notes; the practicalclasses will complement the lectures, and you can be examined on anythingwe study in either.Don’t copy and paste the commands from this guide into R; you will findit very hard to remember the details of the language and will have to lookeverything up when you come to code something yourself.Make sure you try the exercises, and understand the code involved ineach one; if something doesn’t make sense, use R’s help functions, ask aclassmate, try using internet resources, or ask me for help (preferably inthat order). Some exercises are marked with an asterisk (*), which meansthey are a little more advanced than is necessary for the class.If you find any mistakes or omissions in these notes, I’d be very grateful tobe informed.3
11.1IntroductionWhat R is good atStatistics for relatively advanced users: R has thousands of packages, designed, maintained, and widely used by statisticians.Statistical graphics: try doing some of our plots in Stata and you won’t havemuch fun.Flexible code: R has a rather liberal syntax, and variables don’t need to bedeclared as they would in (for example) C , which makes it very easy tocode in. This also has disadvantages in terms of how safe the code is.Vectorization: R is designed to make it very easy to write functions whichare applied pointwise to every element of a vector. This is extremely usefulin statistics.R is powerful: if a command doesn’t exist already, you can code it yourself.1.2What R is not so good atStatistics for non-statisticians: there is a steep learning curve, which putssome people off. Try Stata, SAS or SPSS (if you must).Numerical methods, such as solving partial differential equations; try Matlab.Analytical methods, such as algebraically integrating a function. Try Mathematica or Maple.Precision graphics, such as might be useful in psychology experiments. TryMatlab.Optimization. Though it does have some very easy to use methods built-in.Low-level, high-speed or critical code; use C, C , Java or similar. (However note that such code can be called from R to give the ‘best of bothworlds’.1.3General PropertiesR makes it extremely easy to code complex mathematical or statistical procedures, though the programs may not run all that quickly. You can interfaceR with other languages (C, C , Fortran) to provide fast implementationsof subroutines, but writing this code (and making it portable) will typicallytake longer. Where the advantage falls in this trade-off will depend upon4
what you’re doing; for most things you will encounter during your degree, Ris sufficiently fast.R is open source and widely adopted by statisticians, biostatisticians, andgeneticists. There is a huge wealth of existing libraries so you can oftensave time by using these, though it is sometimes easier to start from scratchthan to adapt someone else’s function to meet your needs. Contributing newpackages to the central repository (CRAN) is easy: even your lecturer hasmanaged it. As a result, R packages are not build to very high standards(but see Bioconductor).R is portable, and works equally well on Windows, OS X and Linux.1.4InterfacesFor Windows and OS X, the standard R download comes with an R GUI,which is adequate for simple tasks. You can also run R from the commandline in any operating system.There are a number of more powerful interfaces which you may like to try.Here’s a few.RStudio. Very popular, with a nice interface and well thought out, especially for more advanced usage: can be a bit buggy, so make sure youupdate it regularly. Available on all platforms.Emacs with ESS. (Emacs Speaks Statistics) is available on all platforms,and is very powerful when you get used to it. Has a habit of freezingin my experience, though.TinnR. Alternative Windows interface.I intend to demonstrate a few of these different approaches during class.5
2Basic Arithmetic and ObjectsR has a command line interface, and will accept simple commands to it. Thisis marked by a symbol, called the prompt. If you type a command andpress return, R will evaluate it and print the result for you. 6 9[1] 15 x - 15 x - 1[1] 14The expression x - 15 creates a variable called x and gives it the value 15.This is called assignment; the variable on the left is assigned to the valueon the right. The left hand side must contain only contain a single variable. x 4 - 15# doesn't workAssignment can also be done with (or - ). x 5 5*x - x x[1] 25The operators and - are identical, but many people prefer - because itis not used in any other context, but is, so there is less room for confusion.2.1VectorsThe key feature which makes R very useful for statistics is that it is vectorized. This means that many operations can be performed point-wise on avector. The function c() is used to create vectors:6
x - c(1, -1, 3.5, 2) x[1]1.0 -1.03.52.0Then if we want to add 2 to everything in this vector, or to square eachentry: x 2[1] 3.0 1.0 5.5 4.0 x 2[1]1.001.00 12.254.00This is very useful in statistics: sum((x - mean(x)) 2)[1] 10.69Exercise 2.1. The weights of five people before and after a diet programmeare given in the table.BeforeAfter786772657879797010593Read the ‘before’ and ‘after’ values into two different vectors called beforeand after. Use R to evaluate the amount of weight lost for each participant.What is the average amount of weight lost?*Exercise 2.2. How would you write a function equivalent to sum((x - mean(x)) 2)in a language like C or Java?Some useful vectors can be created quickly with R. The colon operator isused to generate integer sequences 1:10[1]123456789 107
-3:4[1] -3 -2 -101234 9:5[1] 9 8 7 6 5More generally, the function seq() can generate any arithmetic progression. seq(from 2, to 6, by 0.4)[1] 2.0 2.4 2.8 3.2 3.6 4.0 4.4 4.8 5.2 5.6 6.0 seq(from -1, to 1, length 6)[1] -1.0 -0.6 -0.20.20.61.0Sometimes it’s necessary to have repeated values, for which we use rep() rep(5,3)[1] 5 5 5 rep(2:5,each 3)[1] 2 2 2 3 3 3 4 4 4 5 5 5 rep(-1:3, length.out 10)[1] -10123 -10123We can also use R’s vectorization to create more interesting sequences: 2 (0:10)[1]12481632864128256512 1024
1:3 rep(seq(from 0,by 10,to 30), each 3)[1]123 11 12 13 21 22 23 31 32 33The last example demonstrates recycling, which is also an important part ofvectorization. If we perform a binary operation (such as ) on two vectorsof different lengths, the shorter one is used over and over again until theoperation has been applied to every entry in the longer one. If the longerlength is not a multiple of the shorter length, a warning is given. 1:10 * c(-1,1)[1] -12 -34 -56 -78 -9 10 1:7 * 1:2Warning:length[1]14longer object length is not a multiple of shorter object385 127Exercise 2.3. Create the following vectors in R using seq() and rep().(i) 1, 1.5, 2, 2.5, . . . , 12(ii) 1, 8, 27, 64, . . . , 1000.1(iii) 1, 21 , 31 , 14 , . . . , 100.(iv) 1, 0, 3, 0, 5, 0, 7, . . . , 0, 49.P(v) 1, 3, 6, 10, 15, . . . , ni 1 i, . . . , 210 [look up ?cumsum].(vi) 1, 2, 2, 3, 3, 3, 4, . . . , 9, 10, . . . , 10. [Hint: type ?seq, and read about {z }10 timesthe times argument.]Exercise 2.4. The ith term in the Taylor expansion of log(1 x) is ( 1)i 1 xi /i.Create a vector containing the first 100 terms for x 0.5. [Write out thefirst few entries by hand if that helps.]Letrn (x) log(1 x) nX( 1)i 1 xii 1Evaluate rn (1) for n 10, 100, 1000, . . . , 106 .9i.
2.2SubsettingIt’s frequently necessary to extract some of the elements of a larger vector.In R you can use square brackets to select an individual element or group ofelements: x - c(5,9,2,14,-4) x[3][1] 2 # note indexing starts from 1 x[c(2,3,5)][1]92 -4 x[1:3][1] 5 9 2 x[3:length(x)][1]2 14 -4There are two other methods for getting subvectors. The first is using alogical vector (i.e. containing TRUE and FALSE) of the same length: x 4[1]TRUETRUE FALSETRUE FALSE x[x 4][1]59 14or using negative indices to specify which elements should not be selected:10
x[-1][1]92 14 -4 x[-c(1,4)][1]92 -4(Note that this is rather different to what other languages such as C orPython would interpret negative indices to mean.)Exercise 2.5. The built-in vector LETTERS contains the uppercase lettersof the alphabet. Produce a vector of (i) the first 12 letters; (ii) the odd‘numbered’ letters; (iii) the (English) consonants.2.3Logical OperatorsAs we see above, the comparison operator returns a logical vector indicating whether or not the left hand side is greater than the right hand side.Here we demonstrate the other comparison operators: x 2# less than or equal to[1] FALSE FALSE x 2TRUE FALSE# equal to[1] FALSE FALSETRUE FALSE FALSE x ! 2# not equal to[1]TRUE FALSETRUETRUETRUETRUENote the double equals sign , to distinguish between assignment and comparison.We may also wish to combine logical vectors. If we want the elements of xwithin a range, we can use the following:11
(x 0) & (x 10)[1]TRUETRUE# 'and'TRUE FALSE FALSEThe & operator does a pointwise ‘and’ comparison between the two sides.Similarly, the vertical bar does pointwise ‘or’, and the unary ! operatorperforms negation. (x 5) (x 10)[1]TRUE FALSE FALSETRUE FALSE !(x 5)[1]TRUE FALSETRUE FALSETRUEExercise 2.6. The function rnorm() generates normal random variables.For instance, rnorm(10) gives a vector of 10 i.i.d. standard normals. Generate 20 standard normals, and store them as x. Then obtain subvectorsof(i) the entries in x which are less than 1;(ii) the entries between 12 and 1;(iii) the entries whose absolute value is larger than 1.5.2.4Character VectorsAs you might have noticed in the exercise above, vectors don’t have tocontain numbers. We can equally create a character vector, in whicheach entry is a string of text. Strings in R are contained within doublequotes ": x - c("Hello", "how do you do", "lovely to meet you", 42) x[1] "Hello"[4] "42""how do you do"12"lovely to meet you"
Notice that you cannot mix numbers with strings: if you try to do so thenumber will be converted into a string. Otherwise character vectors aremuch like their numerical counterparts. x[2:3][1] "how do you do""lovely to meet you" x[-4][1] "Hello""how do you do""lovely to meet you" c(x[1:2], "goodbye")[1] "Hello"2.5"how do you do" "goodbye"MatricesMatrices are much used in statistics, and so play an important role in R. Tocreate a matrix use the function matrix(), specifying elements by columnfirst: matrix(1:12, nrow 3, ncol 4)[,1] [,2] [,3] [,4][1,]14710[2,]25811[3,]36912This is called column-major order. Of course, we need only give one ofthe dimensions: matrix(1:12, nrow 3)unless we want vector recycling to help us: matrix(1:3, nrow 3, ncol 4)[,1] [,2] [,3] [,4]13
[1,][2,][3,]123123123123Sometimes it’s useful to specify the elements by row first matrix(1:12, nrow 3, byrow TRUE)There are special functions for constructing certain matrices: diag(3)[1,][2,][3,][,1] [,2] [,3]100010001 diag(1:3)[1,][2,][3,][,1] [,2] [,3]100020003 1:5 %o% 1:5[1,][2,][3,][4,][5,][,1] [,2] [,3] [,4] [,5]12345246810369121548121620510152025The last operator performs an outer product, so it creates a matrix with(i, j)-th entry xi yj . The function outer() generalizes this to any functionf on two arguments, to create a matrix with entries f (xi , yj ). (More onfunctions later.) outer(1:3, 1:4, " ")[,1] [,2] [,3] [,4]14
[1,][2,][3,]234345456567Matrix multiplication is performed using the operator %*%, which is quitedistinct from scalar multiplication *. A - matrix(c(1:8,10), 3, 3) x - c(1,2,3) A %*% x# matrix multiplication[1,][2,][3,][,1]303645 A*x[1,][2,][3,]# NOT matrix multiplication[,1] [,2] [,3]1474101691830Standard functions exist for common mathematical operations on matrices. t(A)[1,][2,][3,]# transpose[,1] [,2] [,3]1234567810 det(A)# determinant[1] -3 diag(A)[1]1# diagonal5 1015
solve(A)# inverse[,1][,2] [,3][1,] -0.6667 -0.66671[2,] -1.3333 3.6667-2[3,] 1.0000 -2.00001Exercise 2.7. Construct the matrix 12326 B 4 3 1 3Show that B B B is a scalar multiple of the identity matrix, and findthe scalar.Matrices can be subsetted much the same way as vectors, although of coursethey have two indices. Row number comes first: A[2,1][1] 2 A[2,2:ncol(A)][1] 5 8 A[,1:2][1,][2,][3,]# blank indices give everything[,1] [,2]142536 A[c(),1:2]# empty indices give nothing![,1] [,2]Notice that, where appropriate, R automatically reduces a matrix to a vectoror scalar when you subset it. You can override this using the optional dropargument.16
A[2,2:ncol(A),drop FALSE][1,]# returns a matrix[,1] [,2]58You can stitch matrices together using the rbind() and cbind() functions.These employ vector recycling: cbind(A, t(A))[1,][2,][3,][,1] [,2] [,3] [,4] [,5] [,6]14712325845636107810 rbind(A, 1, 0)[1,][2,][3,][4,][5,][,1] [,2] [,3]1472583610111000Exercise 2.8. Construct the following matrices:(a) 1 3 5 72 4 6 8(b) 1 1 1 · · · 1 1 1 1 · · · 1 . . 1 1 1 · · · 1(dimensions 15 10).(c) The 5 15 matrix with three 1s in shifting positions: 1 1 1 0 0 ··· 0 0 0 0 0 1 1 · · · 0 0 (dimensions 5 15). . . . . . . 0 0 0 0 0 ··· 1 117
[Hint: use column subsetting.](d) 1 2 3 2 3 4 3 4 5 . . 9 1010 11 · · · · · · 9 10· · · 10 11 . . ; .17 17 18 17 18 19[Look at the outer() function.](e) 1 2 3 4 . .9 ··· 91 . . ;.6 6 7 1 ··· 67 82334.44[The modular arithmetic operator %% may be useful here.](f) I5 10 I6where Ik is the k k-identity matrix, and 1 and 0 are matrices with allentries 1 and 0 respectively.Exercise 2.9. Solve the following system of simultaneous equations usingmatrix methods.a 2b 3c 4d 5e 52a 3b 4c 5d e 23a 4b 5c d 2e 54a 5b c 2d 3e 105a b 2c 3d 4e 11Don’t just create your matrix by hand!Exercise 2.10. In this section we’ve seen that the behaviour of the functiondiag() depends upon its inputs. Can you think of some examples wherethis might cause a problem?18
2.6ListsOther than vectors and matrices, the main object for holding data in R is alist1 . These are a bit like vectors, except that each entry can be any otherR object, even another list. x - list(1:3, TRUE, "Hello", list(1:2, 5))Here x has 4 elements: a numeric vector, a logical, a string and another list.We can select an entry of x with double square brackets: x[[3]][1] "Hello"To get a sub-list, use single brackets: x[c(1,3)][[1]][1] 1 2 3[[2]][1] "Hello"Notice the difference between x[[3]] and x[3].We can also name some or all of the entries in our list, by supplying argument names to list(): x - list(y 1:3, TRUE, z "Hello") x y[1] 1 2 3[[2]][1] TRUE z[1] "Hello"1Technically speaking, lists are also a kind of vector in R, but not every object in themhas to have the same type; ordinary logical, numeric or character vectors are known asatomic vectors.19
Notice that the [[1]] has been replaced by y, which gives us a clue as tohow we can recover the entries by their name. We can still use the numericposition if we prefer: x y[1] 1 2 3 x[[1]][1] 1 2 3The function names() can be used to obtain a character vector of all thenames of objects in a list. names(x)[1] "y" """z"You’ve seen most standard R objects now: almost all the more complicatedones are just lists! We’ll see this in the next section.20
3DataR comes with many datasets built-in, particularly in the MASS package. Apackage is a collection (or library) of functions, datasets, and other objects;most packages are not loaded automatically, so you have to do it yourself: library(MASS)You can now access various datasets from this package. Try looking at thedataset called hills. head(hills)To find out what the data represent, use the help function ?hills.3.1Data FramesThe object hills is something called a data frame. A data frame is aseries of records represented by rows (in this case one for each race), eachcontaining values in several fields (in this case dist, climb, time).You can check that hills is a data frame by inspecting its class(es) class(hills)[1] "data.frame"or more reliably by using an is() command is(hills, "data.frame")[1] TRUEWe’ll talk more about classes later in the course.Data frames share many of the characteristics of matrices. We can selectrows or columns in the same way: hills[3,]Craig Dunaindist climb time6900 33.6521
hills[hills dist 12,]Bens of JuraLairig GhruSeven HillsTwo BreweriesMoffat Chasedist climbtime16 7500 204.6228 2100 192.6714 2200 98.4218 5200 170.2520 5000 159.83However, they also behave like lists indexed by the columns: hills time[1] 16.08[11] 192.67[21] 15.95[31] 85.5848.35 33.6543.05 65.0027.90 47.6332.38 170.2545.60 62.2744.13 26.9317.93 18.6828.10 159.8373.22 204.6272.25 98.4226.22 34.4336.3778.6528.5729.7517.4250.50The truth is that, like almost all complicated objects in R, data framesare lists with some additional structure. Formally speaking, they are notmatrices, but they do behave similarly in certain circumstances.Exercise 3.1. How do the results of the following commands differ fromwhat we would expect if hills were a matrix? hills[1,]hills[3]hills %*% c(1,2,4)mean(hills)3.2Manipulating Data using with()We often want to use functions on the columns of a data frame, and it quicklybecomes inconvenient to repeatedly type (for example) hills before everysuch event. For example, the command below will give a scatter plot of therace times against climbs, amongst only those races less than 10 miles long. plot(hills climb[hills dist 10], hills time[hills dist 10])2239.7532.5720.95
The with() function allows us to refer to the names of objects in a dataframe (or, in fact, any list) without having to keep referring to the dataframe itself. For example, the command above becomes with(hills, plot(climb[dist 10], time[dist 10]))If you just type climb or dist on their own, R won’t know what objectyou’re referring to. Technically with() alters the scope of the expressionbeing evaluated (i.e. the code given in the second argument) so that it can‘see’ the columns of the data frame as objects. We’ll learn a bit more aboutscope when we talk about functions later on.Exercise 3.2. Using with(), find the mean of the average speeds (in milesper hour) for races which are between 5 and 10 miles long3.3Creating Data FramesThe command data.frame() is used to create a data frame, each argumentrepresenting a column. books - data.frame(author c("Ripley", "Cox", "Snijders", "Cox"), year c(1980, 1979, 1999, 2006), publisher c("Wiley", "Chapman", "Sage", "CUP")) books1234authorRipleyCoxSnijdersCoxyear se 3.3. (a) Create a small data frame representing a database offilms. It should contain the fields title, director, year, country, andat least three films.(b) Create a second data frame of the same format as above, but containingjust one new film.(c) Merge the two data frames using rbind().(d) Try sorting the titles using sort(): what happens?23
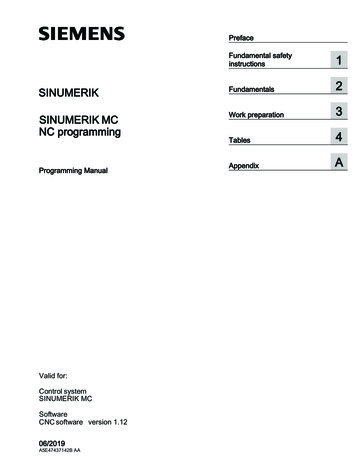
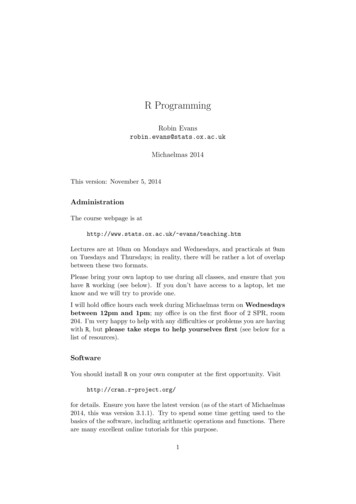
3.4FactorsThere are two main types of data which you will encounter this year: numerical and categorical. We’ve seen how to create numerical vectors already.Suppose we have the heights of 100 individuals, the first 50 male and therest female. set.seed(1442)# fixes the random numbersheight round(rnorm(100, mean rep(c(170,160),each 50), sd 10))sex rep(c("M", "F"), each 50)head(sex)[1] "M" "M" "M" "M" "M" "M"We can tell R to treat sex as a categorical variable: Sex as.factor(sex) head(Sex)[1] M M M M M MLevels: F MNote that it is displayed slightly differently. The new variable Sex is called afactor; a factor is a categorical variable which takes various discrete levels,in this case M and F for male and female.R knows to do sensible things with factors: plot(Sex, height)24
200190180170160150140FMWhat happens if you try to plot sex against height instead? The distinctionbetween categorical and non-categorical data is especially important if wehave numbered groups.The information in a factor is stored as a vector of integers: as.integer(Sex)[1] 2 2 2 2 2 2 2 2 2 2 2 2 2 2 2 2 2 2 2 2 2 2 2 2 2 2 2 2 2 2 2 2 2 2 2[36] 2 2 2 2 2 2 2 2 2 2 2 2 2 2 2 1 1 1 1 1 1 1 1 1 1 1 1 1 1 1 1 1 1 1 1[71] 1 1 1 1 1 1 1 1 1 1 1 1 1 1 1 1 1 1 1 1 1 1 1 1 1 1 1 1 1 1Just as a data frame is really a list, a factor is really a vector of integers(for levels) together with some extra information giving each level a names.The additional information is contained within a list of attributes. Youcan view this list directly. attributes(Sex) levels[1] "F" "M"25
class[1] "factor"The attributes in this case are its class (you’ll see this in many objects)and a vector of the level names. The class tells R that this object should betreated as a factor so that, for example, it will be displayed to you in theright way.You may find that sometimes data are stored as a factor when you don’twant them to be (see the exercise in the previous section). You can turn afactor back in to a character vector easily enough: ""F""F""F"Exercise 3.4. (a) Sample the numbers {1, 2, 3} uniformly with replacement 50 times; use this to create a factor with levels Yes, No and Maybe.(b) Create a subvector by removing the Maybe entries from the factor above.What levels does the new factor have?(c) Use the command droplevels() to remove the level Maybe.Exercise 3.5. Take a look at the birthwt data from the MASS package.How is race stored in these data? Is this sensible?Define a factor based on race: Race factor(birthwt race)Compare the effect of the commands summary(), plot() and mean() oneach of Race and birthwt race. Which do you find more useful?3.5Row and Column NamesThe labels above and to the left of the values in hills are not part of thedata itself, but can be accessed:26"M""M""M""F""F""M""M""F""F""F"
names(hills)[1] "dist""climb" "time" 28][31][34]"Greenmantle""Ben Rha""Bens of Jura""Traprain""Lomonds""Cairngorm""Black Hill""Meall Ant-Suidhe""N Berwick Law""Largo Law""Ben Nevis""Cockleroi""Carnethy""Ben Lomond""Cairnpapple""Lairig Ghru""Cairn Table""Seven Hills""Creag Beag""Half Ben Nevis""Creag Dubh""Criffel""Knockfarrel""Moffat Chase""Craig Dunain""Goatfell""Scolty""Dollar""Eildon Two""Knock Hill""Kildcon Hill""Cow Hill""Burnswark""Acmony""Two Breweries"As we saw above, in a data frame the column names can be used for indexing(e.g. hills time); the row names cannot be used in this way.This additional information is stored as attributes, which are in a separatelist2 attached to the object hills: attributes(hills)We could add an attribute to hills if we wanted: attributes(hills) - c(attributes(hills), list(type "races")) attributes(hills)Note that type(hills) doesn’t access hills type, the most importantattributes such as names and class happen to have functions named afterthem, which can be used to extract relevant information.3.6Reading in DataWhilst R provides many interesting datasets, it is often necessary to loaddata externally. The main commands for doing this are read.table() andread.csv().2Actually they’re not stored as a list (see ?attributes), but they behave very similarly.27
Here is an example using the smoking.dat dataset, available on the coursewebsite. dat - read.table("smoking.dat", header TRUE) 3.36LEUK6.156.616.947.067.206.45 class(dat)[1] "data.frame"What happens if header TRUE is omitted?When you specify the file name, be sure to use the double quotes (") aroundit. You also need to give the correct path to the file. R will automaticallylook for the file in its working directory. You can check what this is: getwd()[1] "/data/redcrest/evans/Dropbox/Teaching/R Programming/2014"Then if your file is in a subfolder called files, you need to write (for example) dat - read.table("files/smoking.dat", header TRUE)In some systems you can use file.choose() to get the full path to a file.In particular this works well on R GUI for Windows or OS X. For example: dat - read.table(file.choose(), header TRUE)will bring up a window for you to choose the file from.*Exercise 3.6. Look at the documentation for read.table(). Use thefunction to read in only lines 11 to 20 (Indiana up to Minnesota).28
4FunctionsEverything which is done in R is done by functions. A function in a programming langauge is much like its mathematical equivalent: it has someinputs called arguments, and an output called the return value. In R afunction can only return a single object. If you type a function’s name atthe console, you can see its structure: setdifffunction (x, y){x - as.vector(x)y - as.vector(y)unique(if (length(x) length(y))x[match(x, y, 0L) 0L]else x)} bytecode: 0x2a49e98 environment: namespace:base There are two important parts to the function: the signature, which inthis case is function(x, y), and the body, which is the code between thecurly brackets. Broadly speaking, when a function is called, it takes theinformation in the arguments, applies the code in the body to them, andthen spits out the final expression in the function. In this case that’s thecomplex looking expression unique( ).4.1ArgumentsYou can look at the arguments for a function by typing args: args(setdiff)function (x, y)NULLArguments are a little complicated in R. You’ll notice that they have aname: the arguments of setdiff() are called x and y. However, you don’tusually have to specify an argument by name, because arguments also havea position:29
a - c(1,4,5,7) b - c(1,2,5,9) setdiff(a, b)# everything in 'a' and not in 'b'[1] 4 7It assumes that the first argument supplied should be x, and the second y.You can override this
Matlab. Optimization. Though it does have some very easy to use methods built-in. Low-level, high-speed or critical code; use C, C , Java or similar. (How-ever note that such code can be called from R to give the ‘best of both worlds’. 1.3 General Properties Rmakes it extremel