Transcription
U.S . Pruid,nt's Em,rgoney Plan for AIDS Rt lit rEthiopia Country Operational PlanCOP2020/FY2021Strategic Direction SummaryMarch 23, 20201 Page
Table of Contents1.0 Goal Statement2.0 Epidemic, Response, and Updates to Program Context2.1 Summary statistics, disease burden, and country profile2.2 New activities and Areas of focus for COP20, including focus on client retention2.3 Investment profile2.4 National sustainability profile update2.5 Alignment of PEPFAR investments geographically to disease burden2.6 Stakeholder engagement3.0 Geographic and Population Prioritization4.0 Client-centered Program Activities for Epidemic Control4.1 Finding the missing, getting them on treatment4.2 Retaining clients on treatment and ensuring viral suppression4.3 Prevention, specifically detailing programs for priority programming4.4 Additional country-specific priorities listed in the planning level letter4.5 Commodities4.6 Collaboration, integration, and monitoring4.7 Targets for scale-up locations and populations4.8 Cervical cancer programs4.9 Viral load and Early Infant Diagnosis optimization5.0 Program Support Necessary to Achieve Sustained Epidemic Control6.0 US Government Management, Operations and Staffing Plan to Achieve Stated GoalsAppendix A – PrioritizationAppendix B – Budget Profile and Resource ProjectionsAppendix C – Tables and Systems Investments for Section 6.0Appendix D – Minimum Program Requirements2 Page
1.0Goal StatementIn COP20, PEPFAR Ethiopia (PEPFAR-E) will support the Government of Ethiopia (GoE)’snational HIV program to achieve and sustain epidemic control by focusing direct service delivery(DSD) and technical assistance (TA) investments to achieve 95-95-95 targets in five remainingpriority geographies and strengthening critical systems nationally. PEPFAR-E will continue andexpand more sustainable approaches, such as technical assistance and working within existinglocal structures. Government entities and local partners will be strengthened to lead the HIVresponse, monitor the epidemic, and develop sustainability plans for continued support to HIVprograms, Orphans and Vulnerable Children (OVC) and Adolescent Girls and Young Women(AGYW). Leadership capacity of regional health bureaus and civil society will be strengthened foreffective coordination of regional responses, and PEPFAR/E will work closely with all partners tostrengthen community-facility linkages and to find and retain remaining cases. Finally,interventions will be focused on geographic locations (facilities and communities) with thehighest numbers of HIV positive individuals as demonstrated through HIV Testing Services (HTS)POS and TX CUR indicators.At this point in time, there are no remaining policy barriers to achieving 95-95-95 targets, thoughconsiderable work remains to operationalize policy at regional and local levels. This process willbe facilitated by appropriate working groups at all levels, leveraging the GoE’s renewedcommitment to achieve and sustain epidemic control. Particular attention will be paid to effortsto expand PrEP and HIVST access to wider groups than has previously been possible.Programmatic approaches and milestones will strengthen national systems for:1. Detection of cases to link them to treatment and care, especially among certain target groups,such as men, children and female sex workers2. Suppression of viral load to lower transmission rates; and3. Response to ensure thorough patient-centered care, early identification of adherence issues,and prevention of epidemic backsliding.To accomplish this, PEPFAR-E will pursue the following objectives:1. Strengthen support for core GoE contributors to epidemic control at the central level.2. Support the Ministry of Health (MoH) to execute strong program planning and quarterlyperformance monitoring, in conjunction with all stakeholders and partners.3. Focus Direct Service Delivery (DSD) investments on detecting remaining cases andachieving population-level viral load suppression in targeted geographies in PEPFAR-E’sfive priority regions—Addis Ababa, Oromia, Amhara, SNNPR, and Gambella. Targetedgeographies will be those with the highest rates of HIV infection as indicated by acombination of TX CURR (at Q1,FY20) and HTS POS (FY ’19 APR).4. Expansion of PrEP and HIVST targets.5. Increased both yield for ICT, and percentage of positives identified through ICT.6. Increased access to high impact HIV services for OVC and their HIV infected caregivers, andprovision of primary prevention intervention to boys and girls age 9–14 years.7. Continued efforts to eliminate the Gambella VMMC backlog3 Page
8. Provision of technical assistance in the six non-priority regions focused on: (1) reinforcing subnational capacity for leadership and governance; (2) implementing a sustainable financingstrategy, including adoption of a legal framework for domestic resource mobilization andresource mapping; (3) improving laboratory system; (4) strengthening case-based surveillanceand response, including recency testing and related health information systems; (5) improvingsupply chain management and systems for improved HIV commodity availability and access;and (6) enhancing quality assurance for clinical services.Stakeholder and partner engagement are critical to the success of PEPFAR investments,especially as the program evolves to sustain epidemic control. These efforts continue to focus ondomestic resource mobilization, stigma and discrimination reduction, enhanced and continuouscommunity engagement, adoption of the latest evidence-based best practices, and carefultargeting of program interventions to bring Ethiopia across the line of epidemic control andensure continued control.4 Page
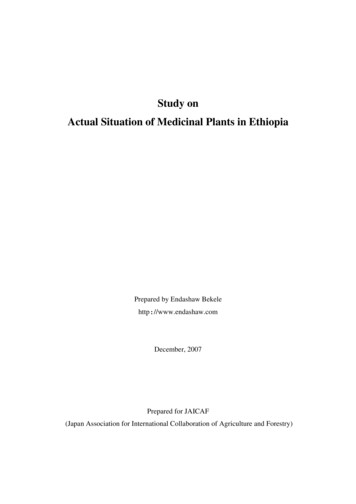
2.0 Epidemic, Response, and Program Context2.1 Summary Statistics, Disease Burden, and Country ProfileEthiopia is sub-Saharan Africa’s second most populous nation and one of its poorest. Populationestimates is around 108,113,150 (July 2020) divided among approximately 80 ethnic groups, with anapproximate Growth Domestic Product, per capita, of 2,200 (2017 est.). The median age is 19.6years with a population growth rate of 2.56% (2020 est.) These statistics belie Ethiopia’s substantialeconomic and social progress over the last 30 years. In 1990, 40% of the population lived below theWorld Bank poverty line; since 1990, the total fertility rate (TFR) has declined from 7.2 to 4.6; theinfant mortality rate has declined from 120 per 1,000 live births to 41; and the adult literacy rate hasgone from below 25% to 49% .The HIV epidemic in Ethiopia is mixed, with wide regional variations and urban concentration inprevalence and some distinct transmission pockets among key and priority populations (KP & PP)and in some sectors of the general population. The 2016 Demographic and Health Survey (DHS)estimated a national prevalence of 0.9%. The 2018 Ethiopian Population-based HIV ImpactAssessment (EPHIA) estimated an urban HIV prevalence of 3.0% nationally with regionalvariations (see Table 2.0).1.I.I5 Page
The current working UNAIDS Spectrum estimate for PLHIV is 665,723 in Ethiopia. Of these, it isestimated that in Ethiopia, 79.0% of HIV positive adults (ages 15-64 years) know their HIV statusand among adults living with HIV who know their HIV status, 97.1% were receiving ART andamong adults living with HIV who reported ARV use or had detectable ARVs, 87.6% hadsuppressed viral loads. Collectively, the data suggest that Ethiopia is close to reaching HIVepidemic control, but still has pockets which need to be appropriately addressed.KPs & PPs, i.e. FSWs, widowed and divorced people, truck drivers, adolescent girls and youngwomen (AGYW) engaged in transactional sex, male clients of sex workers (SWs), and those wholive along major transport corridors are all estimated to have significantly higher HIV prevalencerates than the general population. Outside this trend, Gambella region has little distinctionbetween urban and rural residents HIV prevalence and some rural areas (with high seasonalmigrant populations) away from transport corridors show elevated HIV risk behaviors despitetheir locales. Within the general population (in urban areas), women between the ages of 20 and39 have significantly higher prevalence (6.1%-9.1%) than their male counterparts (0.9%- 2.4%).Adult male prevalence peaks at 5.7% in the 40-44 age band.Addis Ababa, despite its relative economic advantages and ease of access to health care, falls wellbelow the rest of the country in key HIV indicators when non-residents are factored out. EPHIAdata suggests that youth (15-24) have low VL suppression (48.2%) and therefore require specialemphasis for engagement into care. Finding youth, getting, and keeping them on treatment toachieve high rates of VL suppression must be a focus for sustained epidemic control.6 Page
11able 2 . 1.1 Host Counu,: Go,·emment Result S!iTotal%N%NMale%NFemaleN%Source, Year25 15- 15Female IMale%NfemaleN%Male%Nl«?fcn. to Year 2.020.Adapted fromPopulation Projection ofEthiopia from l,l.)'20,386,290"'%4,978-,,,Ss%5,013,772 25,032,6292s%25,216,890,,. DHS2tn6NAo. %1%1"'%NA,.&,O.l0.18%6%o&,%%AIDS Deaths(per year)l«?fcn. toYeat .lOlO.Spectrumfrom Fl\.10H1,08626,8u.841. PLHIV()4"j,68uIncidenceRate (Yr)1,1418,;oom,n-,74"i-U-/"'·".l,(,O'o""l«?fcn. to Year 2.020., .,,.-U4 WS.J1.1tum frvm f MOHl«?fcn. to Years-2.020 (AllAges) Spectrum fromFMOHl«?fcn. to Years-2.020.Spectrum from FMOHo.t1J/l.O ONewInfections(Yr)Annual births"""l,140,0n% or PregnantWomen""ithat least oneANCvisitPregnantwomenneedinR ARVs0ns· %18,8152,l'IGo.7 Page1,1889%l.l'U9%""'2,%l.Ol48%l. .l«?fcn. to Year 2.020. CSAand DHSU 16Health SectorTransformation Plan,Annual Perfonnanccl«?port 201sf16 FMOHl«?fcn. to Years-2.020.Spectrum from FMOHl«?fcn. to Year unn.
materna paternal,double)Notified TBca. CS(Yrl% ofTI) CcL CSthat a.re HIVinfected%of VPrevalenceEstimatedSizeofPPsEstimated PP.sPrevalenceSpectrum &om FMOHU7,70-.,oo%82,o .,.,24%2/ -.0%l\,c;(,o,,,.'7,11 7«%'ll.'40rll64'io,l40,ll%Global TB ConaolRcoort WHO 2018Global TB ControlReport WHO 2.018DHS2016QJ%NANANANANANAExtrapolated &om Sizeestimation by PEPFAR-Eintera2encvNational MARJ s survey,EPHI/COC nationalMARPs survcv reoort223,1382)%NAl,)7),9)5NANANANANA8 PageNANANANANANANANANANANANANANANANANANANAVNAJOS
.- --;---.KIi' . Tmal1POJJt1 I,11k1111!Pop l.itianIHVPr lcl\a:IEl-'Lll'Di"lleYE. ll-1019(i:tlVl!it.R J:Dlqi10o:t31,3 39(%)- --· aa.tnIIIV Tri.: .ilment amt VLE:p.idlcmialD,Bk l:bt.aiTrualPDfJ I.irunaize-.On ARTEninwi I "(fTma PLIHV(it PUflVdll (#)FY pprezio111(14'.i)( lF'ti'-1m9-l,IIV Tcrung ;mdl Lmkage ia ARTWithin 1ttu: Lui YeMT i.: &.ie,."'ID .igno-.;ed lmliaie-ilwHIVHIV011 ARTJIMillvc:(ti)(It)(.i)FY JmlHFY-2019YE.i\R-1019D.AJil'K.5'9N,'t.anc; Vi?i"lni5,723,rj.3'9,79l:F't' 11!1tg9!1,351 .1 2 V!.i7·120,57652.':lt'a1,1 ,'10}5'19. 92,H ,15 1'1,J.-11MC11 15 l'1,355I'.(&:.lniClll:5,.10,I ,l:2.0y-e-an;WD111rC111UIJ, 774 ,5'9·1l'i. 1.11 Vci"I n;\\romt?fl19,1}3,,S,772 5. f i!i"ll'&i1P5-.,,rPrioriryPap9 0,7.fl17.e,47115,n159, 2.7,7-351,2 71,33GN,'\NAHAN . NANANA.N,'\NA.NANAN .NA.NANA.NA.:it.3,
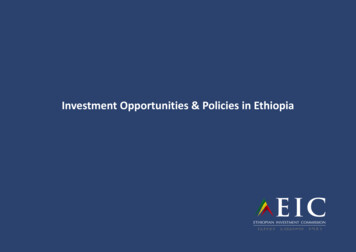
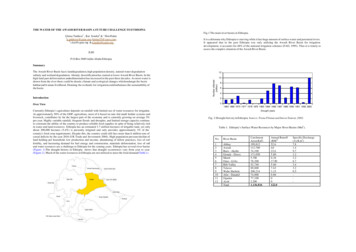
Figure 2.1.3 National and PEPFAR-E Trend for Individuals currently on Treatment1500000450000 "E.0:,z400000,-.a: (3500003000002016-2017Number of People on ART Supported Nationally201820 19Year- Number of People on ART Supported By PEPFARFigure 2.1.4 Trend of New Infections and All-Cause Mortality Among 0199119962001O New Infections12020 Spectrum Estimates2006 Total201120162021Deaths to HIV PopulationNational Fiscal year is a quarter ahead of PEPFAR Fiscal year (June and September respectively). According to PEPFAR programmaticstrategy, geographic prioritization, there have been transitions of Woredas/ districts but that is not visible here as we continue tocount a large number of PLHIV receiving treatment services in centrally supported areas. The latter resulted in very small differencesbetween the government and PEPFAR figures.22020 Spectrum Estimates10 Page
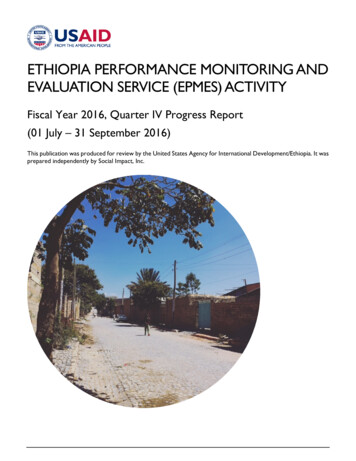
Figure 2.1.5 Progress retaining individualslost in lifelong ART in FY19.100(0)I ki.mbtfofplOll'G ("oltdnl't'19QI.,.50()(0)I l'Jtielt Rtporttd il'dt1TX.CUllR 01' n; Htwncc Rt01nedI HTS fST POS natl.rll:tdtoTrHttllltll1 FYlOQlTX.NET.NlWfYlOQIFigure 2.1.6 Proportion of clientsfrom ART 2018 Q4 to 2019 Q42618TX N!W fY20Ql8999Figure 2.1.7 Epidemiologic Trends and Program Response-HTS TST Pos-PLWHA-on ART-Unm et ::,z 0000020000010000002005 2000 2007 200s 20m 201 o 2011 2012 2013 2014 2015 2016 2017 201 s 201011 Page
Figure 2.1.8 Net change in HIV treatment by sex and age bands FY 2018 Q4 to FY 2019 Q4% . 30%93,00023%73,00014%.,6 9%53,000f 3%Q. 0%33,00013,0000% 1 I1. L ·(7 ,000)FM15-19 FY180412 PageFY1904iF. 17o;.M20-24 FY20-7%Expected Results25-29 Net30-34Change (FY18.fY19) FY19APR35.39-17%40-4950 Comnilauve TX NEW e Percent Gro, .h of People on ART
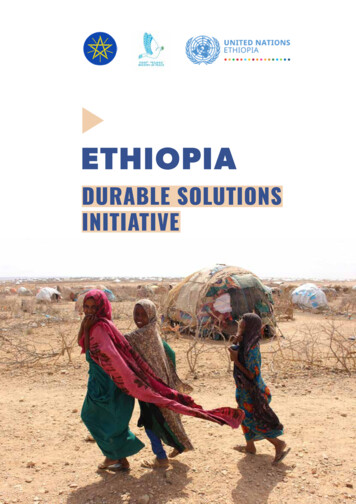
2.1 New Activities and Areas of Focus for COP20, Including Focus on Client RetentionAs Ethiopia inches closer to attaining the 95-95-95 targets for treatment coverage and reachingepidemic control, major programmatic challenges appear to be retaining the clients alreadyenrolled on ART, minimizing loss from the program and making progress towards growing thetreatment cohort. This becomes increasingly difficult as the program moves out of geographicareas that used to receive direct program support (DSD) and as the number of PLHIV that do notknow their status and/or not enrolled to the program become fewer.Ethiopia will continue to implement and scale client centered services including differentiatedmodels of service delivery, extended working hours to provide ART services during week-ends,holidays, after-hours etc., friendly services for adolescents, separate space and scheduling forclients with high viral load, facility-community collaboration for case identification, adherencesupport and tracing of lost clients. In addition to strengthening and expanding theimplementation of the 6 months multi-month dispensing (MMD) and the health worker managedcommunity ART refill groups (CAG), fast track pharmacy refill will be implemented and scaled.Based on identified gaps in retention or volume of reported lost clients, return to treatmentinitiatives will be undertaken to selected geographic areas and sites to identify, track, and supportHIV-positive clients to re-enroll in ART. This will be done in close collaboration and coordinationbetween facility and community stakeholders. There will be routine activities at site andcommunity levels for early identification, reporting and follow-up to support clients who are lost,and document cases that are dead or have transferred out including silent transfers. In addition,due to ongoing and intermittent security issues in different parts of the country, it is expectedthat there will be interruptions in the provision of services and program activities at times. Inaffected areas, appropriate messaging on availability of services, providers, need for adherence totreatment (avoiding discontinuation of treatment), etc. will be provided. Health facilities andproviders will be capacitated to address the demands and needs of those who might be displacedor self-transferred. The main driver of the increase in the treatment cohort is HIV case findingand the program will work to strengthen linkages and early ART initiation including same dayinitiation.Based on lessons learned and implementation of Operation Triple Zero in AA, there will beexpansion and scale-up of the activity to improve adherence/retention among adolescents.Reduction of stigma and discrimination at all levels, including facilities and communities andcontinued collaboration and engagement with community members will continue to be integralto all partners’ efforts.2.2 Investment ProfileThe FMOH recently completed the seventh round of the National Health Accounts (NHA2016/17). The 2016/17 NHA is the latest available data on health spending that was releasedSeptember 2019. According to the 2016/17 NHA, the health expenditure in Ethiopia is estimatedto be ETB 72.1 billion (3.1 billion USD). The 2016/17 NHA report indicates that this is a 45 percentincrease in nominal terms from ETB 49.6 (2.5 USD) in 2013/14.The NHA further indicates that the Government manages more than half of the total healthresources 52 percent while it contributes only 32 percent. The GoE accounted for one third ofhealth spending, with a remarkable increase in its nominal value of health spending from ETB13 Page
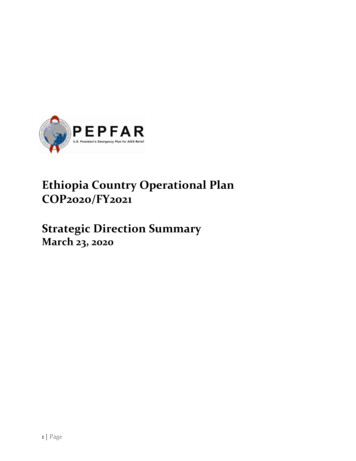
14.7 billion to 23.7 billion between 2013/14 to 2016/17. External funding and out-of-pocketspending on health accounted for 66 percent of the total health expenditure (see figure 2.2.2).Figure 2.2.1 Total Health Expenditure by Source of Financing (%), 2016/17 35.2%33'1,32.0 5196 20041051999100 Government2007108 HouseholdsOOP I-2010111Donor2013114 Other2'I,.0'1,0.0% 2016117PrivateA significant share of health spending on infectious and parasitic diseases went to curative care (42percent), while the prevention component was supported by around 37 percent. Of healthspending on infectious and parasitic diseases, nearly 17.32 percent went to HIV/AIDS (see figure2.2.2). Out of the total health expenditure on infectious and parasitic diseases, health spending oncurative care reduced by seven percent since 2013/14.LeprosyO.040,,,Tuberculosis (TB)Diarrheal ciseases4.21%5.20%Respira:ory infec::ions9.45%Vaccine preven:able ciseases12.38¾Neglected tropical diseases15.76%MalariaE 780,,,Hl\i/AIJS and Other STDs17.32%O:her and unspecified infec::ious ½Though health spending is steadily growing overall in volume, the GoE contribution is still low.The share of government health expenditure was found to be 1.4 percent of GDP in 2016/17, whichis far below the global average of 5.3 percent. The host government covers the costs of personnel,office space and other operational expenses for the health facilities (Health posts, Health centers,14 Page
hospitals, regional laboratories) and above site structures such as FMOH, FHAPCO, EPSA, EPHI,regional Health offices, zonal health offices, woreda health offices. . .Tall ATotal ExpenditureProgram Area i PEPFAR64,105, 56539%Communiry-based ca.re., treatmem, andsupport6,449,538100%PMTCT1,754.32368% HTS1 3. 90%Vl IMC944,&3100%Priority population pre\a-enrion 73 90543%Clinical care, trea.unem and supportKey population preventionOVClaboratorySI, Surveys and Sur,,-eillanceHSSTotal3,778 ,79372%u.,82,o;S100%18,544,6888 recast for Julv2020 - June 2021c;7 ,6,µ;, 77.ooMedicines for opportunisticinfectionsMedicines for se. allytransmitted infectionsCondom requirementsHIV diagnostic rapid testkitsao and Viral loadmonito1'1no: oharmaceuticalsCD4 reagen tsHematolonu re cents21Chemistrv reaeentsLab consumables3%GF% V Preve:n.cionProduct Category. 1'-IIIYl!IFPI ,.PEPFAR706,441-6016%1%IICGfGAP57, .-rr,.oo2.,874,665,002,874,66;.oo878, ,µ,00878,,j.µ .oo4,246,548.004,246,548.009 ,525,864-.006 12,Bn .85u,638,050.007,571,191-524,12.2.,612.001.2.,.jl 8o1.ooGOE9,5-25,864.004 ,1.2.2,6u.oo1. 2 .,.Jt 8o1.oo,6 .678.oo-,,;, i;,.,s,oo4iso,161.oo4 .261.0o*Although PEPFAR has transitioned the testing part of the program, it still supports treatment an EID. 68% contribution is possible mainly dueto MSG program cost is covered by PEPFAR15 Page
-TPTTB LabHenatitisCer\'ical Cancer suppliesTotal2 6,"' " 0561,1514493,392,099.ooTalole :a.:,.J A ITotal USGfunding So eNon-PEPFARResourciesUSAID MCH39,000,000USAIDTBUSAID Malaria36,000, 000f amity PlanningNIHCDC (Global H illth. - .88728; Q6.-;ito,724,364.9970,9u,48.ooUSG NaD-P!PFAJlf .ed ImNon-PEPFARResourcts CofundingPEPFARIMs#Co Funded!MsI10,842,900.00.0 0.PEPFARCOPCo-f .0th y)Puce CorpsDOD EbolaMCCOther (spedfy)Total7, 500 4-U,Soo2.4 National Sustainability Profile UpdateThe regular PEPFAR monitoring of the national sustainability status helps inform planningand implementation to overcome barriers and use enabling opportunities.The Sustainability and Index Dashboard (SID) tool is completed every two years by PEPFAR teams,partners, and stakeholders to assess the state of sustainability of the national HIV/AIDS responseacross countries and to monitor its progress over time. Table 2.3.1 outlines the FY19 SID results.16 Page
J.1.1:7 .,.a1015 [SID 1.0J. .1011 !SID HI)201.92021&-rnana,, l.rade,s'-! , and Accnuntabllltyl. Planning !ind Caor nM 1n1.812. Pofoaes &nd Gouern&nce .5!8.086.0S3. Civil Sot:iety Cng;igement4.00S. 114. 11!.tl4. Priuot" Sector [ngoge,rnent ., 8.195. Public A,,o,,s., lo ln!Orrilit!iOn7.006.C 36. Seruit,: Deliu.,.4. 0S. !17. Hu 1118n Re,.oume, ft r llt, illh6.006.06a Commodity s«urit'I and Supply Oiain1.0!7.08Natlmnal Health System ar-.1 S.rvh:e 0 ,ln,syg Qualilv Mon:i;;t-ment6. 1j tll10. 1.1,bcrMIJryS.4 !4. 7SU . Domestic !4Llltll! Ml:ibilintion6.'i l5.36tl. Tcdlnic&I and Alklctitiui, Efficiende S.564.HSlmeak finaTC:lrig and Martm,t OpeoneuU. M rket Opennei.sN/AN/ASlmeaJc lnfar!Nllion14. [ pid:emiologkzll Md lfealifl O&tll . .!1.'i 3 1ltr. FinanoaVupenditurc Data1.756. 15.SlHi. Perfomt.ance Data4.74,.Si6.8 17. D;W; for Detisio" "'1aking [cmy,-t;;mN/AN/A4. 11Trends in progress from the 2017 SID are noted below with caveats: the small group discussionsused to inform the scoring today may vary from those in 2017 as a result of new GoE leadership inplace since 2018, and the fact that different people participated in the SID exercise. Additionally,new questions were added to several elements for assessment, thereby hindering a directcomparison of results over time.17 Page
StrengthsThe COP19 SID characterizes Ethiopia as having strong planning and coordination. Thegovernment has developed and oversees a cost multi-year national strategy, although it does notinclude detailed plans and activities to address the needs of all key populations. Per its mandate,the role of the Federal HIV/AIDS Prevention and Control Office (F/HAPCO) is to ensureimplementation of policies and programming, and to coordinate the overall HIV/AIDS response;however, FHAPCO has had challenges with fulfilling its defined role. During the SID workshop,there were conflicting opinions in some responses across sections. In general, Domain Aparticipants felt that while plans and coordination are well-defined, they are not wellimplemented.Slight improvements were observed in the overall score for Planning and Coordination(“approaching sustainability and requires little or no investment”). The increase can be attributedto improved GoE tracking of HIV activities by CSOs. Three elements were assessed as “emergingsustainability and needs some investment”.Policies and Governance decreased slightly from the 2017 SID (6.58 to 6.08), however, it is notablethat the 2019 assessment of the element was measured by ten questions (an increase from sixquestions in 2017). Civil Society Engagement also shows slight improvement in SID 2019 (4.0 to4.17) as a result of the new CSO proclamation that supports the oversight role of CSOs and theiractive engagement in HIV programming. Domestic Resource Mobilization, Technical AllocationEfficiencies and Market Openness are scored at 5.3, 4.44 and 8.7, respectively. The scores for thefirst elements of this section declined somewhat from SID 17, but remain in the “emergingsustainability and needs some investment” category.The overall scores for Strategic Information are “emerging sustainability and needs someinvestment,” with scores ranging between 4.12–6.84. Compared to SID 2017, there was a slightdecline in SID 2019 across Epidemiological and Health Data (4.90 to 4.12), andFinancial/Expenditure Data (6.67 to 5.83), while Performance Data increased from 5.97 to 6.83.Vulnerabilities to SustainabilityThe decrease in Public Access to Information (7.0 to 6.56) can be attributed to expendituretransparency. While the participants this year concluded that some expenditure data exists,Ethiopia does not have complete annual overall expenditure data on HIV/AIDS. In contrast, SID2017 indicated the existence of annual HIV expenditure data. This disparity in views led to thedrop in score.The overall scores for National Health System and Service Delivery are “emerging sustainabilityand need some investment” with scores ranging between 4.01 – 5.71. The Commodity Security andSupply Chain element was assessed as “unsustainable and requires significant investment” with ascore of 3.05. In comparison to the SID 2017 assessment, the SID 2019 indicated declining scoresacross each element of the domain. This is mainly because the country continues to maintaindonor driven supply of commodities such as Antiretroviral, Condom, HIV testing and OI drugs. Inaddition, lack of comprehensive supply chain study/survey and the need to have coordination interms of capacity building to both administrative level and health care delivery points wereidentified as gaps. The current national draft strategic planning for HIV program has captured the18 Page
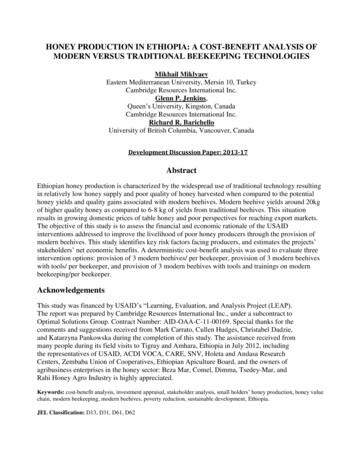
need to strengthen capacity building coordination at all level and commodity supply, which willenhance condom supply, and public and private sector engagement for RTK supply.The 2019 SID identified emerging levels of sustainability requiring additional investment and thevulnerabilities outlined in the 2019 SID will be used to inform priorities for investment during theCOP 20/21 planning processes. PEPFAR-E ensures PEPFAR investments leverage and complimentinvestments of GoE and other donors. PEPFAR-E will continue to support activities and areas ofinvestment that will have a significant impact on reaching and sustaining epidemic control inEthiopia.2.5 Alignment of PEPFAR Investments Geographically to Disease BurdenHIV care and treatment services are available across Ethiopia largely through public healthfacilities and community-based platforms. In FY19, 468,705 PLHIV received treatment at PEPFARsupported sites as well as 497,893 OVC.As Ethiopia approaches epidemic control, investments will be optimized to reach and sustainepidemic control in the highest burden regions. In the 5 regions with the greatest gap tosaturation, DSD support will include intensified and targeted case finding, ensuring at least 92%of all diagnosed PLHIV are on optimal regimens ART, and patients on ART receive an initial 6month and then annual VL test.The working 2020 SPECTRUM estimate of PLHIV, the 2018 EPHIA and program data for PLHIVcurrently on ART (TX CURR) were used to understand treatment gaps by geography. The SNUs/geographic locations with the greatest treatment gap are Oromia (41,887), Amhara (39,554) andAddis Ababa (5,347) and Oromia will be receiving Ambition funds in COP20. In regions that havelower unmet needs and are approaching epidemic control, direct PEPFAR funding support hasceased in COP19 and these regions will receive TA support through a national TA model, led byFHAPCO and the FMOH.Figure 2.5.1 PLHIV by SNU, Total PLHIV by SNU, and Coverage of total PLHIV withART, and Viral Load Coverage by SNU.,.---. vSomal19 Page !L';tt om,ili., .-.,. ---------· - - -""".
2.6 Stakeholder EngagementThe COP20 process has been open and consultative, and the plan reflects the strong engagementwith and input from a range of stakeholders. Collaboration with stakeholders continued to bestronger this year throughout the planning process. In particular, the PEPFAR-E team receivedsubstantial input from FMOH, FHAPCO, EPHI, EPSA, GFATM, UNAIDS, WHO, civil society andfaith-based organizations to prioritize investments included in COP20. PEPFAR-E also workedwith implementing partners, local and international, to evaluate partner performance andprogress towards goals in order to refine COP19 implementation and focus COP20 planningefforts. PEPFAR-E direct funding for the private sector was phased out in COP17. However,private sector collaboration will continue through multilateral stakeholder engagement platformswhile private sector facilities also continue to benefit from government support and PEPFARtechnical assistance.PEPFAR-E created an opportunity for early engagement of the GoE and UNAIDS in December2019. PEPFAR-E leadership met with Minister of Health, Dr. Lia Tadesse, to request strongcollaboration and engagement by the FMOH in COP planning and implementation; Dr. Liaexpressed FMOH’s commitment to fully participate in the process.The COP20 guidance, tools and planning level letter were shared with external stakeholders. KeyGoE entities (FMOH, FHAPCO, EPHI, EPSA, MOF, MOWYCA) and external stakeholders(UNAIDS, GFATM, WHO, CSOs) participated in the stakeholder’s strategic retreat convened inJanuary 2020. The stakeholder meeting was interactive, and all stakeholders have participated insmall group sessions to provide inputs on the PEPFAR-E strategic direction for COP20. AgencyHeadquarter personnel also joined the retreat, and all participants provided comments on theproposed PEPFAR-E planning direction for COP20.PEPFAR-E conducted IP meetings, also attended by stakeholders, to evaluate performance andbette
Ethiopia is sub-Saharan Africa's second most populous nation and one of its poorest. Population estimates is around 108,113,150 (July 2020) divided among approximately 80 ethnic groups, with an years with a population growth rate of 2.56% (2020 est.) These statistics belie Ethiopia's substantial