Transcription
Introduction to Computing with MATLABArun PrakashSchool of Civil EngineeringPurdue University.
Contents1 Introduction to Computing42 MATLAB Basics: Datatypes, Arrays, Input/Output, Plotting81.11.21.32.12.22.32.4Computing . . . . . . . . . . . . . . . . . . . . . . . . . . . . . . . . . . . .Computer Programming . . . . . . . . . . . . . . . . . . . . . . . . . . . . .Basic Matrix Algebra . . . . . . . . . . . . . . . . . . . . . . . . . . . . . . .Datatypes in MATLAB . . . . . . . . . . . . . .2.1.1 Variables . . . . . . . . . . . . . . . . . .2.1.2 Arrays . . . . . . . . . . . . . . . . . . .2.1.3 Initialization of Variables and Arrays . .2.1.4 Multi-dimensional Arrays . . . . . . . .2.1.5 Subarrays . . . . . . . . . . . . . . . . .Matrices Operations vs. Arrays Operations . . .2.2.1 Matrix operations . . . . . . . . . . . . .2.2.2 Array operations . . . . . . . . . . . . .Input and Output (I/O) of Data . . . . . . . . .2.3.1 Input the data from keyboard . . . . . .2.3.2 Output of Data to the Screen . . . . . .2.3.3 I/O through Data Files . . . . . . . . . .Introduction to Plotting . . . . . . . . . . . . .2.4.1 The plot command . . . . . . . . . . . .2.4.2 Title, Label, Grid and Text . . . . . . .2.4.3 Multiple curves on one plot . . . . . . .2.4.4 Line Color, Line Style, Marker Style, and2.4.5 Controlling x- and y-axis Plotting Limits2.4.6 Controlling Plot features using the GUI .3 Branching Statements3.13.2Branching . . . . . . . . . . . . .3.1.1 The Logical Data Type . .3.1.2 Relational Operators . . .3.1.3 Logical Array Masking . .3.1.4 Logical Operators . . . . .The if branch . . . . . . . . . . .3.2.1 The Nested if Statement.1. . . . . . . . . . . . . . . . . . . . . . . . . . . . . . . . . . . . . . . . . . . . . . . . . . . . . . . . . . . . . . . . . . . . .Legends. . . . . . . . 6272930
3.33.4The switch statement . . . . . . . . . . . . . . . . . . . . . . . . . . . . . .MATLAB Debugger . . . . . . . . . . . . . . . . . . . . . . . . . . . . . . .4 Loops4.14.24.34.44.54.64.74.8Top-Down Design Techniques . . . . . . . . . . .Loops . . . . . . . . . . . . . . . . . . . . . . . .The for Loop . . . . . . . . . . . . . . . . . . . .4.3.1 The general form of the for Loop . . . . .The while Loop . . . . . . . . . . . . . . . . . . .Simple Applications . . . . . . . . . . . . . . . . .Timing, Preallocation and Vectorization of LoopsThe break and continue Statements . . . . . . .Nested Loops . . . . . . . . . . . . . . . . . . . .5 More Plotting and Graphics5.15.2Additional Types of Two-dimensional Plots . . . .5.1.1 Other Useful Plotting Functions . . . . . .5.1.2 Logarithmic Plots . . . . . . . . . . . . . .5.1.3 Subplots . . . . . . . . . . . . . . . . . . .5.1.4 Creating Multiple Figure Windows . . . .5.1.5 Exporting a Plot as a Graphical Image . .Three-dimensional Plots . . . . . . . . . . . . . .5.2.1 plot3 function . . . . . . . . . . . . . . .5.2.2 The meshgrid, mesh and surf commands5.2.3 The Contour functions . . . . . . . . . . .5.2.4 Generating Animations of Plots . . . . . .6 User De ned Functions, Recursion6.16.26.36.46.5Introduction to Matlab Functions . . . . . . . . . . . .Variable Passing in Matlab: The Pass-by-Value SchemeOptional Arguments . . . . . . . . . . . . . . . . . . .Function of functions . . . . . . . . . . . . . . . . . . .Recursive Functions . . . . . . . . . . . . . . . . . . . .7 External File Input/Output7.17.27.37.47.5The textread() Function . . . . . . . . .Introduction to MATLAB File ProcessingFile Opening and Closing . . . . . . . . .7.3.1 The fopen Function . . . . . . . .7.3.2 The fclose Function . . . . . . . .File Positioning and Status Functions . . .I/O Functions for Formatted Text Data . .7.5.1 The fprintf Function . . . . . . .7.5.2 The fscanf Function . . . . . . . .7.5.3 The fgetl and fgets Functions . 35454596060616464656565676869697070
7.6I/O Functions for Binary Data . . . . . . . . . . . . . . . . . . . . . . . . . .7.6.1 The fwrite Function . . . . . . . . . . . . . . . . . . . . . . . . . . .7.6.2 The fread Function . . . . . . . . . . . . . . . . . . . . . . . . . . .8 Numerical Methods in MATLAB8.18.28.38.48.58.6Matrix Algebra . . . . . . . .Data Analysis . . . . . . . . .Polynomials . . . . . . . . . .8.3.1 Roots . . . . . . . . .8.3.2 Curve Fitting . . . . .Integration . . . . . . . . . . .Di erential Equations . . . . .8.5.1 IVP Format . . . . . .8.5.2 ODE Solvers . . . . . .8.5.3 Basic Use . . . . . . .Advanced MATLAB Features.9 Application to Civil Engineering: Structural Dynamics3.71717273737476767678787879798485
Chapter 1Introduction to ComputingUsing computers to solve (engineering) problems of our interest is called Computing. Inthis process, we develop computational tools that help us do our jobs better and faster. Computing is di erent from Computer Science. Computer Scientists try to design the Computeritself and develop programming languages that we, as programmers, can use for our ownengineering applications.1.1 ComputingWhy do we need Computing? Volume of data and societal needs have grown beyond human capabilities Human error, consistency of results, speed and accuracy Examples: Banking, Automotive, Manufacturing, Communication etc. Questions: Reliability, Fault tolerance, robustness, backup Caveat: Utilization vs. Dependence; we are responsible for the technology we createand use.Types of Computing On-site Data Analysis and response systems in real-life applications:Structural Health Monitoring and ControlWater quality managementEarthquake Engineering Direct simulation of physical phenomena (Scienti c Computing)Analysis & design of systems such as buildings, bridges, machines etc.Verify & Validate current and future theories of physics - Simulate stu we cannotmeasure or observe - subatomic particles, core of stars, even origin of the universe!!4
Components of a computer HardwareCPU - Binary (0,1) instructions go in ; Binary output obtainedMemory - ROM, RAM, Hard Disk, External StorageInput Devices - Keyboard, Mouse, Touch Screen etc.Output Devices - Monitor, Printer etc. Software Operating systemWindows, MacOS, Linux, Unix, Sun Solaris, Applications ProgramsInternet Explorer, Media Players, Photoshop, Adobe AcrobatProgramming languages: C/C , Fortran, Pascal etc.MATLABYour programs1.2 Computer ProgrammingWhat is programmingDe ning the set of operations for a computer to perform (telling the computer whatto do). Computers understand only certain binary instructions. So computer scientistsdeveloped more user friendly languages that translated (compiled / interpreted) into binarycode. We need to learn these languages in order to communicate with the computers bywriting programs. Structure of a program: Get input Compute - operate upon the input data to generate meaningful information Output the results Some Essentials of Programming Data Structure for Memory management - Variables, Array, PointersConditional Branching StatementsLoopsFile HandlingInput / OutputGraphics5
MATLAB - Matrix LaboratoryAdvantages: Relatively easy to use and good for beginners, GUI Prede ned functions for a lot of Mathematical operations:Matrix Algebra, Solving system of equations, Eigenvalue computations Symbolic Mathematics: Algebra, Di erentiation, Integration Additional Toolboxes Plotting / Imaging / Visualization of Results - device independent Combine Languages, C/C , Fortran Di erent platforms run the same MATLAB program / code Demos : Membrane, 3D peaks, Bar with notchDisadvantages: Interpreter based : Slower, but can be compiled Kernel overhead - not suitable for very large problems Limited advanced programming features:Pointers, Pass by Reference, Object-orientedThe MATLAB Environment Desktop Command window is called the 'command prompt'Arithmetic: , -, *, /, Line continuation (Ellipsis) . Command History window Workspace browser: Variables whos, clear, clc, clf Path Browser - Variable, m- le in current directory, rst occurrencewhich Editor window : m- les as scripts Figure windowsplot6
Helphelp, lookforGetting started section Start Button Other commandsCTRL-c : Cancel or Interrupt Operation (when MATLAB 'hangs')! : execute command on MS-DOS or Unix shell promptdiaryBuilt-in functions in MATLABElementary Math Functions: abs( ) sqrt( ) factorial( ) exp( ) log( );log10( )Trigonometric functions sin( );asin( ) cos( );acos( ) tan( );atan( ) cot( );acot( )Hyberbolic functions sinh( );cosh( ) tanh( );coth( )1.3 Basic Matrix AlgebraRefer to Matrices Handout.7
Chapter 2MATLAB Basics: Datatypes, Arrays,Input/Output, PlottingBefore we can write programs, it is important to understand how MATLAB uses andoperates on di erent types of data.2.1 Datatypes in MATLABThe two most common data types in MATLAB are Numeric and character data (Referto MATLAB help for details on other types of data).1. Numeric Data is stored in double precision format by default. Double precision numbers use 64 bits (binary digits - 0, 1) and can store a number with 15 to 16 signi cantdigits of precision (mantissa) and 10 308 to 10308 as exponent. Double precision datatypes can be real, imaginary or complex.2. Character data types are stored in 16-bit value representing a single character. Stringsare a collection of characters where each character uses 16 bits.Example char(65) is 'A' and char(97) is 'a'.2.1.1VariablesA Variable is user given name that refers to a certain location in the computers memorywhere MATLAB stores data. The user can access that data by specifying the variable nameassociated with it.Rules:1. Variable names are case sensitive. Example: var, Var, VAR are all di erent.2. Must begin with an alphabet followed by alphabets, numbers and the underscorecharacter.3. MATLAB can distinguish variable names upto 63 characters in length.8
Examplesx 10x x 1X 20 20icharacter1 'a'character2 '1'CharVar1 char(97)StrVar1 'This is CEE 15'string variable 'That s cool!'Prede ned Variables in MATLAB (not protected: can be overwritten)pii, jInf, Nan, ansrealmax, realmin, epsclock, dateNote: Choose the names of your variables so that no inbuilt prede ned variables or functionsare over-written.2.1.2ArraysMATLAB treats all data as arrays. An array is a collection of data' (any data - numbers, characters etc.) that is stored in continuous locations in the computers memory. Allvariables refer to arrays in the computers memory. Even scalars are actually treated as 1 1 array.Arrays are primarily of two types: Vectors (dimension 1) and Matrices (2 or moredimensions). The size of an array is the number of rows and columns in an array. (Forhigher dimensional arrays it includes the extent of all dimensions).Example: 1 2a 3 4 5 6 b 1 2 3 4 1c 2 33 2 matrix1 4 array, row vector3 1 array, column vectorCOMMANDS: length(), size()size(a) gives the size of a speci c matrix a.length(a) returns the length of a vector or the longest dimension of a 2-D array.9
Individual elements in an array are accessed using the row and column number of theelement in parentheses. For example, in the above arrays a(2,1) is 3, b(2) is 2, and c(3)is 3.2.1.3Initialization of Variables and ArraysVariables need not be declared prior to using them (unlike C, C , Fortran etc.). Variables can be created and stored using:1. Assignmentvar expressionarea pi*(2.3)ˆ2myarray1 [1 2 3 ; 4 5 6 ]myarray1(3,2) 1(expanding an existing array)Note If a particular subscript in not in range of an array, MATLAB automaticallyincreases the dimensions of the array to t the new element.2. Shortcut Expressionsvar first : inc : last(default inc is 1)myarray2 [1:5]creates a row vectormyarray3 [ 1:5:26 ; 25:5:50 ]Note: Number of entries in each row must be equal.3. Combining arrayscol1 [1:3]'col2 [6:-1:4]'myarray4 [ col1 col2 ]myarray4 [ myarray4 col2 col1 ]name ['Mike' ' ' 'Smith']4. Built-in Functionsmagic( ), zeros( ), ones( ), eye( )magic: The magic(n) function generates an n n matrix constructed from the integersfrom 1 through n2 . The integers are ordered in such a way that all the row sums andall the column sums are equal to the same number.zeros: The zeros function generates a matrix containing all zeros.ones: The ones function generates a matrix containing all ones.eye: The eye function generates an identity matrix.10
Summary of symbols related to array operationsCharacter Description: ( )[ ],;'2.1.4Used in short-cut expressionsAssignment operatorSubscripts of arraysBrackets; forms arraysSeparates array elementsSemicolon; suppresses echo of input, ends row in arraySingle quote; matrix transpose, creates stringMulti-dimensional ArraysThree dimensional arrays can be visualized as cuboids and can be addressed using 3subscripts. For examplearray3d(:,:,1) [1 2 3 ; 4 5 6]array3d(:,:,2) [7 8 9 ; 10 11 12]is a 2 3 2 array.However higher dimension arrays are harder to visualize and should be thought of interms of subscripts. For examplearray4d(2,2,2,2) 1is a 2 2 2 2 array.11
2.1.5SubarraysIt is possible to select and use subsets of MATLAB arrays as though they were separatearrays. To select a portion of an array, just include a list of all the elements to be selectedin the parentheses after the array name. For example,arr1 [1.1 -2.2 3.3 -4.4 5.5];arr1(3) 3.3arr1([1 4]) [1.1 -4.4]arr1([1:2:5]) [1.1 3.3 5.5]For a two-dimensional array, a colon can be used in a subscript to select all of the values of that subscript. For example,arr2 [1 2 3; -2 -3 -4; 3 4 5];arr2(1,:) [1 2 3]arr2(:,1:2:3) [1 3; -2 -4; 3 5]The end functionend function returns the highest value taken on by that subscript, For examplearr2(2:end,:) [-2 -3 -4; 3 4 5]Assigning using subarraysSubarrays can also be used to change the values of that portion of the main array. Forexample,arr2(:,1:2:3) [111 222 ; 333 444 ; 555 666 ]arr2(:,1:2:3) 10Empty array [ ] ; Deleting elements of an arrayElements of an array can be deleted by assigning them to the empty array [].arr3 magic(7)arr3([1 3],:) []12
2.2 Matrices Operations vs. Arrays Operations2.2.1Matrix operationsMATLAB has all the operators of conventional matrix algebra already built in.Addition and Subtraction of Matrices is carried out on two or more matrices of thesame size by adding or subtracting the corresponding elements of the matrices.Transpose of a Matrix The transpose of a matrix is a new matrix in which the rows ofthe original matrix are the columns of the new matrix. If a matrix contains a complex valuethen we can have both the complex conjugate transpose (ctranspose and ') and complexnonconjugate transpose (transpose and .').Dot Product MATLAB command:c dot(a,b)The dot product is the scalar computed from two vectors of the same size.c nXai b ii 1Matrix Multiplication MATLAB command:c a*bThe matrix multiplication is de ned byc a bcij nXaik bkjk 1For example if matrices a and b of dimensions m n and n p respectively are such thatnumber of columns of a are equal to number of rows in b (in this case: n) then the resultingmatrix c will have dimensions m p according the above formula.Matrix Powers The command for the power of a matrix a is a 2 (where, power is equalto 2). a 2 is equivalent to a*a. Similarly, a 4 is equivalent to a*a*a*a. To raise a matrixto a power, the matrix must be a square matrix.Matrix Inverse MATLAB Command:b inv(a)By de nition, if b is an inverse of a square matrix a, then a*b or b*a are both equal to anidentity matrix with only the diagonal elements being 1 and other elements being 0.Determinants MATLAB Command:det(a)Solving system of equationsThe solution of a system of equations A x b is given by x A 1 b. The direct way of calculating this solution using x inv(A)*b is expensive. Alternatively, MATLAB can solvethis system using Gaussian elimination which is implemented as the backslash \ .MATLAB Command:x A \ b.13
2.2.2Array operationsSometimes we have to perform arithmetic operations between the elements of two arraysof the same size in an element-by-element manner. These operators are denoted bypreceding the normal arithmetic operators by a dot . such as (. , .-, .*, ./, . ) .For example if a and b are matrices of same size:a [1 2 3 ; 4 5 6 ]b [4 5 6 ; 1 2 3 ]a .* bdenotes element-by-element multiplication of a and b. A normalmatrix multiplication between the above matrices is not de ned.Note & . - & .-operations produce the exact same result.Summary of Array and Matrix operatorsCharacter Description or Array and Matrix addition or subtraction of arrays.*./.\. */\ Element-by-element multiplication of arraysElement-by-element right division : a/b a(i,j)/b(i,j)Element-by-element left division : a\b b(i,j)/a(i,j)Element-by-element exponentiationMatrix multiplicationMatrix right divide : a/b a*(b) 1Matrix left divide (equation solve) : a\b (a) 1 * bMatrix exponentiationPrecedence (higher to lower):1. Parentheses ( )2. transpose .', power . , complex conjugate transpose ', matrix power 3. unary operator: Unary plus , unary minus -, logical negation 4. multiplication .*, right division ./, left division .\, matrix multiplication *, matrixright division /, matrix left division \5. addition , subtraction 6. colon operator :For the operators with the same precedence, the executions proceed from left to right.Refer to MATLAB help for complete precedence rulesMATLAB Programming Basic Programming Components Operators14
2.3 Input and Output (I/O) of Data2.3.1Input the data from keyboardWe can ask the user to provide input data using the input() command.var input('Enter the value to be stored:')This allows the user to enter any valid MATLAB expression, that evaluates to a numericor character value.stringvar input('Enter the string to be stored: ','s')When used with the option 's', anything that the user enters is stored as character data.2.3.2Output of Data to the ScreenThe format statementIn MATLAB the decimal fractions are printed using a default format (short format) thatshows 4 decimal decimal digits (eben though MATLAB internally stores double precisionvariables with 14-15 digits of accuracy). If we want values to be displayed in a decimal format with 14 decimal digits, we use the command format long. The format can be returnedto a decimal format with 4 decimal digits using the command format short. format shorte command will print the values in scienti c notation with 5 signi cant digits and formatlong e prints the same but with 15 signi cant digits. format command is used to printthe sign only. When a matrix is printed with the format command, the only characterprinted is plus and minus signs. If a value is positive a plus sign will be printed; if a valueis zero, a space will be printed; if a value is negative, a minus sign will be printed.Display ormatformatformatformatformatformatshortshort eshort glonglong elong gbankcompactloose (Default) Fixed-point format with 4 decimal digitsScienti c notation with 4 decimal digitsBest of 5-digit xed or oating pointFixed-point format with 14 decimal digitsScienti c notation with 15 decimal digitsBest of 15-digit xed or oating pointTwo decimal digitsEliminates empty linesAdds empty linesOnly signs are printed15
The disp and num2str functionsThe disp function accepts one array argument whether numeric or string, and displaysthe value of the array in the Command Window. If the array is of type char, then thecharacter string contained in the array is printed out.This is useful for displaying the nal result of a program. num2str function can be usedto convert numeric values to character strings and then use disp() for displaying them. Forexample,n 20;disp(['Total number of students in the class ' num2str(n)])disp(n)The fprintf FunctionThe general form of the fprintf function is:fprintf (format, data)where format is a string that controls the way the data is to be printed, and data is one ormore scalars or arrays to be printed. The format is a character string containing text to beprinted plus special characters describing the format of the data.Common Special Characters in fprintf Format StringsFormat String Results%d%e%f%g%c%s\nDisplay value as an integerDisplay value in exponential formatDisplay value in oating point formatDisplay value in either oating point or exponential format,whichever is shorterDisplay a single characterDisplay a string of charactersSkip to a new lineExampletemp 78.234567989;fprintf( The temperature is %f degrees.\n',temp)will print: The temperature is 78.2346 degrees.It is also possible to specify the width of the eld in which a number will be displayedand the number of decimal places to display. This is done by specifying the width and precision after the % sign and before the f. For example,fprintf( The temperature is %4.1f degrees.16\n',temp)
will print: The temperature is 78.2 degrees.The output contains the value of temp printed with 4 positions, one of which will be adecimal position as shown above.2.3.3I/O through Data FilesMatrices can be de ned from information that has been stored in a data le. MATLABcan interface to two di erent types of data les. MAT les: Data stored in a memory-e cient binary format. They are preferable fordata that are going to be generated and used by MATLAB programs only. ASCII les: Data stored in ASCII characters. They are necessary if the data are tobe shared (imported or exported) with programs other than MATLAB.MAT Filessave filename var1 var2 var3The save command saves the values of variables var1, var2, etc. in a le named filename.By default, the le name will be give the extent mat, and such data les are called MAT- les.save filename x y z -appendadds the variables x, y, z to an existing MAT le filename.mat.The load command is the opposite of the save command. It loads data from a disk leinto the current MATLAB workspace. For example,load filenameASCII Files The ASCII les must contain only numeric information. We can use % in the ASCIIle for comment lines. Each row of the ASCII le must contain the same number of data values to be readby another program in MATLAB.save temp.dat c d -ascii By loading the ascii le, data value will be automatically stored in a matrix temp (withthe same name as the data le) which will have the same size as the data. Though values of the variables c and d were stored in the temp.dat le, they can beread as a variable matrix (temp) for our case.load temp.dat17
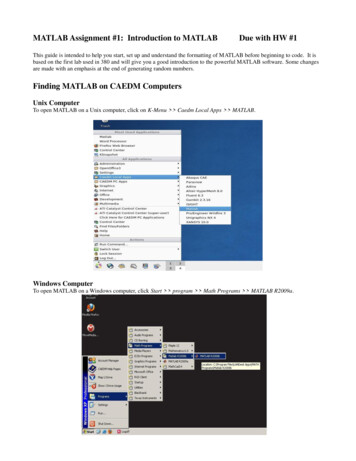
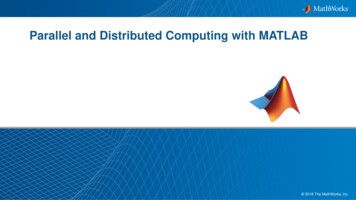
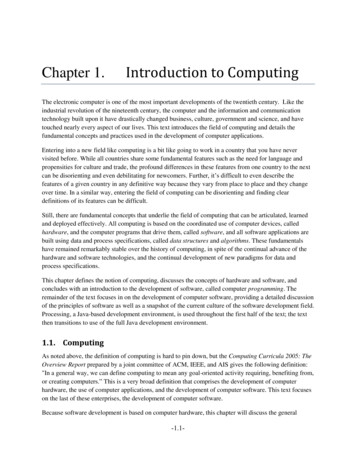
2.4 Introduction to PlottingPlotting is useful when we have to display the output / results of our program in agraphical format.2.4.1TheplotcommandThe plot() command generates an x-y plot using 2 arrays. For example to plot thefunction y x2 10x 15 for values of x between 0 and 8.x 0:1:8;y x. 2 - 8.*x 15;plot(x,y);Figure 2.1: Plot of y x2 8x 15 from 0 to 8.The rst statement creates a vector of x values between 0 and 10 using the colon operator. The second statement calculates the y values from the equation. Finally, the thirdstatement creates the plot using plot function. When the plot function is executed, Matlabopens a Figure Window and displays the plot in the window, see Figure 2.1.Note: Both vectors of x and y must have the same length.2.4.2Title, Label, Grid and TextTitles and axis labels can be added to a plot with the title, xlabel, and ylabelfunctions. Each function is called with a string containing the title or label to be applied to18
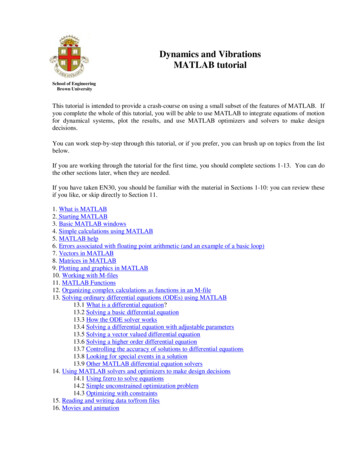
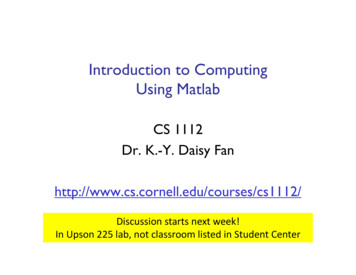
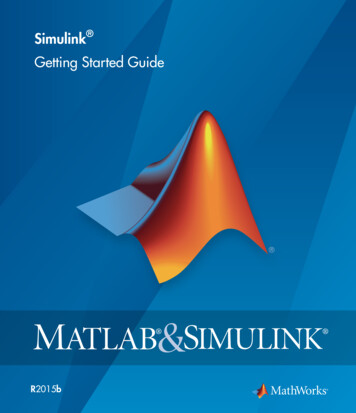
the plot. Grid lines can be added or removed from the plot with the grid command: gridon turns on the grid lines, and grid off turns o grid lines.For example, titles, labels and grid lines are applied to the previous gure, as shown inFigure 2.2.x 0:1:8;y x. 2 - 8.*x 15;plot(x,y);title('Plot of y x 2 - 8*x 15');xlabel('x'); ylabel('y');grid on;Figure 2.2: Plot of y x2 8x 15 from 0 to 8 with a title, axis labels, and grid lines.The function, text(x,y,'string') writes the string on the graphics screen at thepoints speci ed by the coordinates (x,y) using the axes from the current plot. If x and yare vectors then the text is written in each point.text{2.5, 3, 'y(x) x 2 - 8x 15'}text{2.1, 3, '\leftarrow'}19
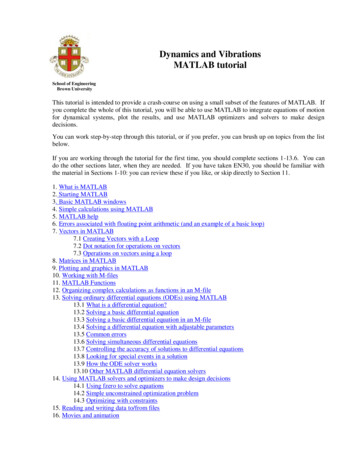
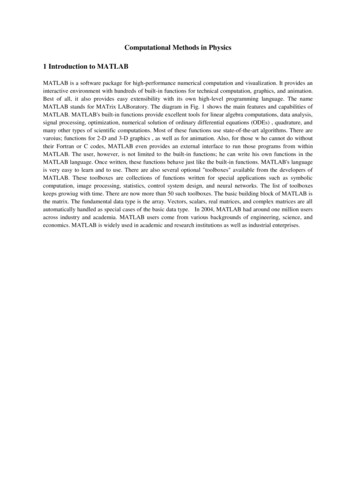
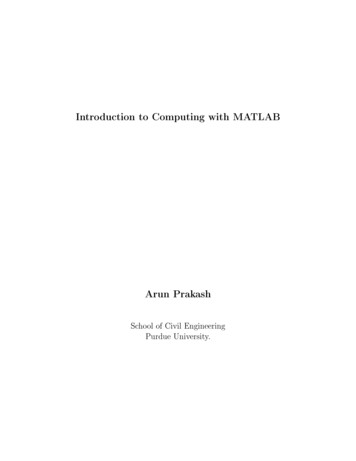
2.4.3Multiple curves on one plotIt is possible to plot multiple curves on the same graph. We can plot multiple curves onthe same graph by using multiple arguments in the plot command, for example, plot(x1,y1,x2,y2).Here, x1, y1, x2 and y2 are vectors. When the command is executed, the curve corresponding to x1 and y1 will be plotted, and then the curve corresponding to x2 and y2 will beplotted on the same graph. Another way to plot multiple curves on the same graph is withthe hold command. After a hold on command is issued, all additional plots will be laid ontop of the previously existing plots. A hold off command switches plotting behavior backto the default situation, in which a new plot replaces the previous one.For example, suppose that we want to plot the function f (x) sin2x and its derivative,2cos2x, on the same plot. We can use either of the following two ways (the result is shownin Figure 2.3):x 0:pi/100:2*pi;y1 sin(2*x);y2 2*cos(2*x);plot(x,y1,x,y2);x 0:pi/100:2*pi;y1 sin(2*x);y2 2*cos(2*x);plot(x,y1);hold on;plot(x,y2);orFigure 2.3: Plot of f (x) sin2x and f (x) 2cos2x on the same graph.20
2.4.4Line Color, Line Style, Marker Style, and LegendsMatlab allows to select the color of a line to be plotted, the style of the line to be plotted,and the type of marker to be used for data points on the line. These traits may be selectedusing an attribute character string after the x and y vectors in the plot function.The attribute character string can have up to three characters, with the rst characterspecifying the color of the line, the second character specifying the style of the marker, andthe last character specifying the style of the line. The characters for various colors, markers,and line styles are shown in the following table:Table of Plot Colors, Marker Styles, and Line StylesColorMarker StyleLine ck.ox *sdv ph none pointcirclex-markplusstarsquarediamondtriangle (down)triangle (up)triangle (left)triangle (right)pentagramhexagramno marker:-.- none soliddotteddash-dotdashedno lineThe attribute characters may be mixed in any combination, and more than one attributestring may be speci ed if more than one pair of (x, y) vectors are included in a single plotfunction.Enhanced Control Plotted LinesIt is also possible to set additional properties associated with lines and markers in the gure. LineWidth speci es the width of each line in points. MarkerEdgeColor speci es the color of the marker or the edge color for lled markers. MarkerFaceColor speci es the color of the face of lled markers. MarkerSize speci es the size of the marker in points.These properties are speci ed in the plot command after the data to be plotted in the following fashion:plot(x, y, 'PropertyName', value, .)21
Adding LegendsLegends may be created with the legend function. The basic form islegend('string1', 'string2', ., 'Location', pos)orlegend('string1', 'string2', .)where string1, string2, etc. are the labels associated with the lines plotted, and pos maybe a string specifying where to place the legend. Command legend off will remove anexisting legend. The possible values of position are given in the following table.Values of position in the legend CommandValueLegend SouthWest''South''SouthEast'2.4.5Top left cornerTop centerTop right corner (default)Middle left edgeMiddle right edgeBottom left cornerBottom centerBottom right cornerControlling x- and y-axis Plotting LimitsBy default, a plot is displayed with x- and y -axis ranges wide enough to show everypoint in an input data set. However, we can use the axis command/function to control axisscaling and appearance. Some of the forms of the axis command/function are:1. v axis; returns a 4-element row vector containing the current limits, xmin, xmax,ymin, and ymax, of the plot.2. axis([xmin xmax ymin ymax]) sets the x and y limits of the plot to the speci edvalues.3. axis equal sets the axis increments to be equal on both axes.4. axis square makes the current axis box square.5. axis normal cancels the e ect of axis equal and axis square.6. axis off turns o all axis labelling, tick marks, and background.7. axis on turns on all axis labelling, tick marks, and background (default case).An example of a complete
Programming languages: C/C , ortran,F Pascal etc. MATLAB ourY programs 1.2 Computer Programming What is programming De ning the set of operations for a computer to perform (telling the computer what to do). Computers understand only certain bin