Transcription
dypy: Dynamical Systems in PythonPHY250 Project Report Spring 2008S OPHIE E NGLE AND S EAN W HALENDepartment of Computer Science{sjengle,shwhalen}@ucdavis.eduAbstract: This project introduces dypy – an extensible Python framework for visually exploring dynamical systems. The framework allows for new dynamical systems to be added to the tool, as well as new methods for visualizing those systems.It additionally provides a powerful gui component, allowing on-the-fly changes tothe visualization parameters. While still under construction, dypy already containsover 1600 lines of code, with over 800 lines dedicated to the gui.1
1IntroductionIn this course, we have seen and created numerous tools for visualizing dynamical systems. Many of thesetools illustrate the power of visualization and simulation. However, these tools are implemented on a widearray of platforms and programming languages and sometimes lack graphical user interfaces.Our goal is to integrate some of these ideas and tools we’ve seen in class into a single, extensible crossplatform framework. We chose Python since it is cross-platform and used by many scientists in the field.We additionally chose to use OpenGL to allow for hardware-accelerated three-dimensional visualizations.Ideally, this will allow anyone with minimal Python experience the ability to extend the framework to newsystems and visualization tools without having to do extensive gui programming. This allows the focus tobe on the exploration of new systems.The result of our work is dypy (named for dynamical systems in python), which is both a tool and acustom Python package. While it is a work in progress, dypy supports dynamically loaded systems andvisualization tools, and an interactive gui allowing for visualization parameters to be changed in real-time.2BackgroundThe visualization tools we chose to first integrate into dypy focus on a Monte-Carlo animation approach totraditional visualizations such as orbit diagrams or phase portraits. Instead of presenting a static picture,we animate the iteration of these systems based on a randomized set of initial states.Our first implementation of these ideas was in Processing, an open source programming language andenvironment based on Java. This implementation can be found at:http://www.node99.org/projects/bifurcation/ orhttp://www.phien.org/wiki/index.php?title Logistic Map BifurcationOpenGL is the industry standard environment for developing 2D and 3D graphics applications. OpenGLhas standard language bindings for languages such as C and Java, and can be used in Python throughthe Pyglet package.For gui programming, the package wxPython provides a Python interface to the open-source, cross-platformwxWidgets C class library, which provides gui applications with a native look and feel.3MethodsWe used Python v2.5, Pyglet v1.0.1, wxPython v2.8.4, and Numpy v1.0.4 to implement our framework. Wedeveloped the code under Windows and Macintosh systems.We created a dypy Python package with separate subpackages/folders for systems, demos, visualizationtools, and the gui components. The package structure is as follows:dypydemosguiimagessystemstools -main packagesubpackage containing demos named SystemName Demo#.pysubpackage containing general gui componentsinternal folder containing toolbar and logo imagessubpackage containing systems named SystemName.pysubpackage containing tools named ToolName.py and ToolNameGUI.pyTo start dypy we execute the following Python code:2
import dypydypy.show()To allow for new systems, demos, and visualization tools to be added to the dypy framework, we had tosupport dynamic loading of modules. Most of this code is in the file utils.py in the gui folder of the dypypackage. For example, to add a new system to the package, create a Map or ODE class for that system andplace the module file in the dypy/systems directory. Example code for the dynamic loading can be foundin figure 1.Each tool is made of two components, and hence two different Python modules. The first module mustextend the DynamicsTool class. Each DyanmicsTool contains a DynamicsWindow class which automatically handles setting up the OpenGL visualization window in Pyglet. The second module must containa wx.Panel class which provides a gui interface to that tool. The dypy gui loads this panel when necessary.The gui code is separated into 17 different modules, and handles displaying and updating all the necessarysystem and visualization parameter settings. The major gui classes .pyDescriptionDisplays widgets allowing user to select a system, demo, and tooldynamically loaded from the package.Displays widgets allowing user to select the state (x, y, z) rangesand parameter ranges to explore, adjusting to the system dimension as necessary.Displays the primary dypy window.We discuss the implementation of systems in the next section.4Dynamical SystemsWe implemented 11 dynamical systems in our framework. This includes:1.2.3.4.5.6.7.8.9.10.11.Cosine MapCubic MapCusp MapExponential MapHenon MapLogistic MapLorenz ODEsNeuron MapRossler ODEsStandard MapTent MapTo implement these systems, we created two classes: a Map class and a ODE class. Every system implementedinherits one of these two classes. The Map class includes functions to iterate the map, return the derivative,and get the state and parameter ranges and names for the map. The ODE class is almost identical, except fora Runga-Kutta integrator. Both classes use arrays to allow for systems of any dimension.3
5ResultsThe resulting framework consists of over 1600 lines of code, with over 800 lines of code dedicated to justthe gui. We implemented 11 systems and two visualization tools in the gui. The gui allows users to configure system and visualization parameters before and during visualization, and automatically adjusts to thenecessary number of dimensions for the system.However, the framework is still incomplete. The toolbar, allowing the user to load a system, demo, or toolfrom a Python file outside the dypy package is not functional. The demo concept is not yet implemented,some usability improvements can be made to the gui, and some code optimization is possible.We found the implementation of wxPython to vary across systems – making the gui almost unusable onsome Mac systems. This creates an obstacle to making dypy a true cross-platform framework. Additionally, moving from the Java Processing environment to Python, we found some visualization tools ransignificantly slower under Python and Pyglet.Figure 2, 3, and 4 demonstrate the dypy gui and visualization tools.6Conclusiondypy is an extensible Python package allowing for users with Python experience to easily add new systemsto explore. With slightly more experience, users can even add new visualization tools to dypy .However, the interface between Python and the various C based packages was cumbersome. This especially affected the gui programming. Trying to the gui interface in wxPython to behave identically acrossdifferent platforms has been a challenge.Having a gui interface increases interactivity with the visualization, allowing the user greater flexibilitywhen exploring new dynamical systems. However, the amount of code required by the gui interface inrelation to the total amount of code for all of dypy illustrates the need for a framework which allows usersto avoid messy gui programming. While we were unable to fully complete the gui for dypy , we haveshown such a framework is possible in Python.7BibliographyNone.4
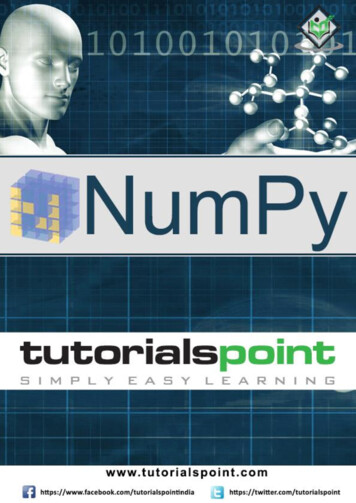
8Figuresfrom systems/ init .py:import dypy, os, os.pathdef getall():path os.path.join(dypy. path [0], "systems")excludes [ " init ", "Map", "ODE" ]names [f[0:-3] for f in os.listdir(path) if f[-3:] ".py"]for e in excludes:if e in names:names.remove(e)return namesall getall()from gui/utils.py:import dypy.systemsdef get classes(modules):classes []for module in modules:class name module. name .split(’.’)[-1]exec "current %s.%s()" % (module. name , class name)classes.append(current)return classesdef get systems():names dypy.systems. allnames ["dypy.systems." name for name in names]names.sort()return get classes(get modules(names))Figure 1: Example Python code which allows for systems to be dynamically loaded at startup.5
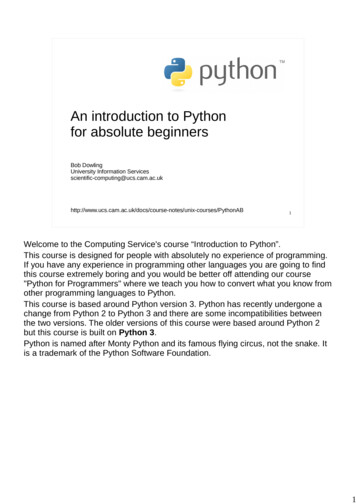
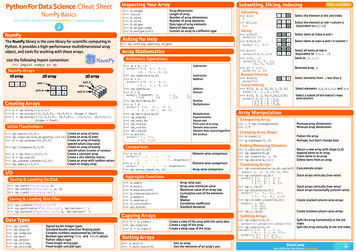
Figure 2: A screenshot showing both the dypy gui and the visualization window, displaying a Monte-Carloanimated orbit diagram for the Logistic Map with x ranging from 0 to 1 and r ranging from 3.5 to 4.0.6
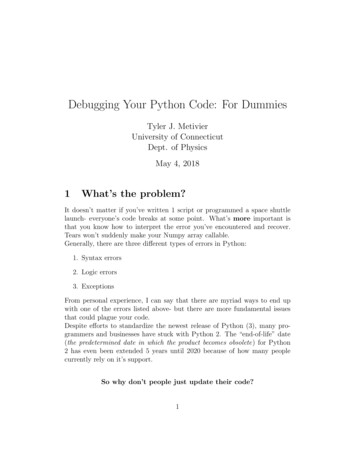
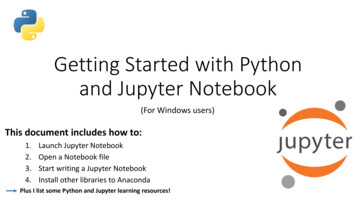
Figure 3: A screenshot showing the other tabs of the dypi gui. The “Logistic Map” tab is automatically generated based on the system selected in the “Main” tab. The “Orbit Diagram” tab is automatically generatedbased on the visualization tool selected in the “Main” tab. Ideally, the demo selected would automaticallypopulate the parameter values in the “Logistic Map” tab. However, demos have not yet been implementedin dypy.7
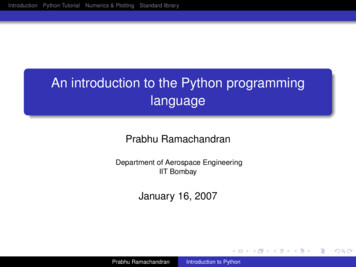
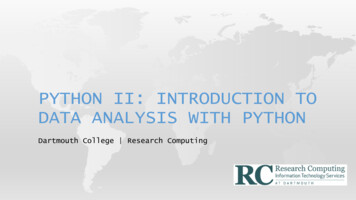
Figure 4: dypy is designed to allow for systems with any number of dimensions. In this screenshot, weshow how the dypy gui automatically adjusted to the 3-dimensional Lorenz odes.8
We used Python v2.5, Pyglet v1.0.1, wxPython v2.8.4, and Numpy v1.0.4 to implement our framework. We developed the code under Windows and Macintosh systems. We created a dypy Python package with separate subpackages/folders for systems, demos, visualization tools, and the gui components. The