Transcription
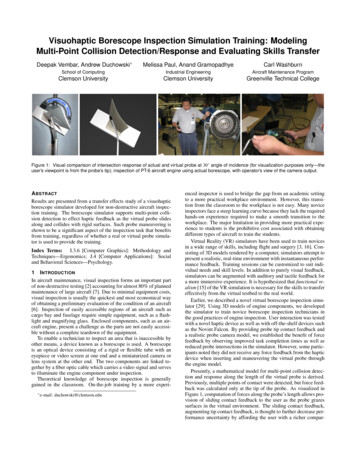
A Driving Simulator Evaluation of Cross-Sectional Design Elementsand the Resulting Driving BehaviorsMichael Knodler, PhDAssociate ProfessorCivil and Environmental EngineeringUniversity of Massachusetts AmherstBhavana GongallaGraduate Research AssistantCivil and Environmental EngineeringUniversity of Massachusetts Amherst
A Driving Simulator Evaluation of Cross-Sectional Design Elements and the Resulting Driving BehaviorsBhavana GongallaGraduate Research AssistantCivil and Environmental EngineeringUniversity of Massachusetts AmherstUniversity of Massachusetts AmherstEleni ChristofaAssistant ProfessorCivil and Environmental EngineeringUniversity of Massachusetts AmherstCole D. FitzpatrickPost-Doctoral ResearcherCivil and Environmental EngineeringUniversity of Massachusetts AmherstSiby SamuelResearch Assistant ProfessorMechanical and Industrial EngineeringUniversity of Massachusetts AmherstMichael A. Knodler Jr.Associate ProfessorCivil and Environmental EngineeringA Report on Research Sponsored bySAFER-SIMSeptember 2017DISCLAIMERThe contents of this report reflect the views of the authors, who are responsible for the facts and theaccuracy of the information presented herein. This document is disseminated under the sponsorship ofthe U.S. Department of Transportation’s University Transportation Centers Program, in the interest ofinformation exchange. The U.S. Government assumes no liability for the contents or use thereof.
Table of ContentsTable of Contents . iiiList of Figures . ivList of Tables . vAbstract . vi1Introduction . 61.1Design Factors Affecting Crash Rates . 21.2Research Objectives. 322.1Methods . 4Apparatus . 42.1.1Driving Simulator . 42.1.2Scenario Development . 42.2Measures . 52.3Participants & Procedure . 52.4Experimental Design . 53Results . 63.1Speed . 73.2Lateral Positioning . 104DISCUSSION . 134.1Limitations . 134.2Future Work . 145CONCLUSIONS . 146Acknowledgements . 147References . 15iii
List of FiguresFigure 2.1 University of Massachusetts Driving Simulator . 4Figure 2.2 Experimental Scenario Description . 6Figure 3.1 Participants’ speed and lateral position for Scenarios 2 and 3. 11iv
List of TablesTable 1.1 Research hypotheses . 3Table 3.1 Descriptive statistics for speed . 7Table 3.2 Inferential difference of mean speed (mph) and paired t-test p values . 9Table 3.3: Descriptive statistics for lateral position . 10Table 3.4 Inferential difference mean lateral position (ft) and paired t-test p values . 12v
AbstractThis research explores the relationship between the cross-sectional design elements and the impacton selected driver attributes such as speed profiles and lateral positioning. In this experiment atraditional collector-type base roadway of 1.5 miles with a 14 ft travel lane and an 8 ft shoulder wasmodeled using an advanced driving simulator. The base scenario was subsequently reconfiguredwith four different cross-sectional designs with various elements within the same physical right-ofway. Specific design elements included narrower lanes, bicycle lanes, raised center median and acurvilinear roadway profile. Twenty participants each drove five developed scenarios, which werepresented in a counterbalanced fashion to mitigate any potential order effect. Participants’ speedand lateral position were recorded throughout each of the drives. Across the virtual scenarios thesame performance measures were analyzed by comparing data at each of five controlled collectionpoints (checkpoints). Experimental results were analyzed using both descriptive and inferentialstatistical tests.The obtained results show that the mean participants’ speed was higher than the posted speedlimit in all scenarios, except for the curvilinear profile scenario. There was no statistically significantdifference in speeds between the base (Sc1), narrower lane (Sc2), bicycle lane (Sc3) and raisedmedian (Sc4) scenarios. In the curved roadway profile scenario (Sc5), the difference in speeds wasstatistically significant. The lateral positioning between the scenarios across the checkpoints wassignificant. Overall, the results suggest that narrower lanes, bicycle lanes, or a raised median haveno significant influence on speed reduction. Nevertheless, narrower lanes result in vehicle lateralposition towards the center lane.1IntroductionFrom 2006 to 2010, an average of 37654.4 annual road deaths occurred in the United Stateseach year. While a decline in this statistic was seen from 2011 to 2014, the recent reports fromNHTSA [1] showcase a 7.7% increase in motor vehicle traffic deaths in 2015 and an estimated35,200 deaths in 2015, up from 32,675 in 2014. It also explains that 94% of crashes can be tiedback to human choice and error. Road geometry, environmental and vehicle aspects are crucialin influencing dangerous driver behaviors such as speeding and drunk driving that contribute totraffic crashes [2]. Identifying factors affecting crash rates is crucial to transportation plannersand engineers in order to detect hazardous locations, or sites that require safety treatments.One such crucial factor is the cross-sectional design of the roadway. According to the AmericanAssociation of State Highway and Transportation Officials (AASHTO), the cross-section of aroadway is the view obtained looking at the section between the right-of-ways from theperspective of the driver. The design elements include travel way, median area, shoulder,bicycle and pedestrian facilitates, utility and landscape areas, drainage channels and side slopes,and clear zone width [3].vi
A Driving Simulator Evaluation of Cross-Sectional Design Elements and the Resulting Driving Behaviors1.1Design Factors Affecting Crash RatesIn this study, the following geometric elements were specifically considered due to their effectson crash rates: lane width, median area, bicycle facility, clear zone, shoulder width and curvedroadway profile.According to a hierarchical, tree-based regression research study aiming to find the relationshipbetween rural road geometric characteristics, accident rates and their prediction, lane widthand serviceability index largely impact crash rates on rural two-lane roadways. The study alsoshowed that on rural multilane roads, median width and access control are major factors [4].A fundamental feature of the travel lane is the lane width. It is limited by the physicaldimensions of automobiles and trucks to a range of 9 ft to 12 ft, but 12 ft wide lanes aredesirable on both rural and urban facilities [5]. Though lane width varies from country tocountry and even city to city, in most cases 12 ft is considered as the maximum lane width forarterials and 12 ft for local roads [6]. In a rural two-lane or multilane road environment,elements of road geometry associated with road width, such as number of lanes and lane width,were substantial and are associated with crash risk [7]. Correspondingly, findings for urban areasseem to have variations with regard to the effect of lane width. Many studies in urban areasshow that wider lanes resulted in higher crash rates than narrower lanes [8, 9, 10]. A similarstudy on urban arterials found that increases in lane width and decreases in shoulder widthreduced both roadside and midblock crashes [11].The median dimension should be in accordance with the roadway cross-section. In general,median width ranges from 4-80 ft in rural areas. AASHTO [5] suggests the use of raised mediantreatment to alleviate operational and safety deficiencies for arterial streets. There are differenttypes of medians: raised, flush two-way-left-turn-lanes (TWLTL), continuous raised curbs, andbarrier. The results of a public opinion survey indicate that the majority of respondents in KnoxCounty, Tennessee, preferred the raised median, while business owners and operators showedan interest in TWLT median lanes [12]. In order to substantially affect driver behavior, raisedmedian islands are strongly recommended in the United States [13]. Raised curb mediansprovide lower vehicle crash rates and pedestrian crash rates than either TWLTL or undividedcross- sections. In addition, TWLTL medians in central business district (CBD) areas had lowervehicle accident rates (property damage only) than either raised curbs or undivided crosssection medians [14].Cyclists have become an increasingly important factor in roadway design. A driving simulatorstudy comparing vehicle speeds and lateral positioning at midblock locations with and withoutbicycle lanes indicated that roadways with bicycle lanes had slightly higher speeds than thosewithout. The presence of bicycle lanes had an impact on lane position because the participantstraveled further from the edge line than when bicycle lanes were not present [15]. Separatedbicycle lanes with raised medians and buffer zones add more comfort to bicyclists as well asdrivers [16]. However, separated bicycle lanes introduce challenges at intersections wheremotorists and cyclists must interact [17].AASHTO defines a clear zone as an unobstructed traversable roadside area designed to enable adriver to stop safely or regain control of a vehicle that has accidentally left the roadway [3].Findings on the effects of clear zone width and roadside vegetation on driver behavior show that2
A Driving Simulator Evaluation of Cross-Sectional Design Elements and the Resulting Driving Behaviorsclear zone size/vegetation density combinations influence both driver speed and the laneposition of the vehicle [5].According to AASHTO [5], a roadway paved shoulder enables drivers to pull off the road andstop safely; it also serves as a recovery area for driver error [19]. However, an increase inshoulder width has a positive effect on decreasing the crash rate. A field experiment in Greece[20], with three nonconsecutive road sections containing various curves, was used to study riskperception regarding different road geometric elements. The results specified that a curvilinearroadway profile highly affected drivers’ safety perceptions. Therefore, a conventional straightroad was perceived as less risky than a curved one.1.2Research ObjectivesAt present, there is a notable gap in literature that quantifies the impact that cross-sectionalroadway design elements employed to reduce speed have on driver performance. Speedselection is critical to roadway safety because higher speeds result in higher crash risks andmore severe crashes [21, 22]. More recently, practices related to complete streets havetranslated into a revised approach to managing roadway speeds that are necessitated foraccommodating multiple modes within a single space. Previous studies have demonstrated theefficacy of various devices that, when implemented individually or in treatment combinations,can effectively decrease roadway-related crashes and fatalities. Nevertheless, there is a gapwhen it comes to specific roadway design elements and their direct impact on the resultingdriver behaviors.The objective of this research is to explore the relationship between cross-section designelements and driver performance as measured by vehicle speed profiles, lateral positioning, anda perceived sense of safety.Table 1.1 Research hypothesesScenarioSpeedLateral PositionNarrowerLaneParticipants’ speed selection will beinfluenced by lane widthParticipants will move along the centerlineBicycleLaneThe presence of a bicycle lane with nocyclists will not influence speed choiceThe presence of bicycle lane pavementmarkings will influence lateralpositioning, and drivers will move awayfrom the edge lineRaisedMedianParticipants will pick higher speeds on14 ft wide lanes, and curb median maynot impact speed selectionParticipants will travel closer to thecenter line when raised medians arepresent3
A Driving Simulator Evaluation of Cross-Sectional Design Elements and the Resulting Driving Behaviors2MethodsA within-subjects experimental design was developed based upon existing literature to examinethe effect of cross-section design on key driver performance measures that influence roadwaysafety. The following section outlines the research tasks that were employed to address theobjectives of this study.2.12.1.1ApparatusDriving SimulatorThe driving simulator used for the study comprises a fully equipped, fixed-base 1995 Saturnsedan positioned in front of three screens subtending 135 degrees horizontally. The virtualenvironment is projected on each screen at a resolution of 1400 1050 pixels and at afrequency of 60 Hz. The virtual environment is projected on each screen through a network offour advanced Realtime Technologies (RTI) simulator servers. The participant sits in the car andoperates the controls, moving through the virtual world according to his or her inputs to the car.The audio is controlled by a separate system consisting of four high-frequency speakers locatedon both sides of the car and two sub-woofers located under the hood of the car providingrealistic road, wind, and other vehicle noises with appropriate direction, intensity, and Dopplershift.2.1.2Scenario DevelopmentThe virtual scenarios for the driving simulator were developed using a 3D modeling softwarecalled Internet Scene Assembler (ISA). ISA utilizes the Virtual Reality Modeling Language (VRML)file format. Apart from ISA, two other software tools were used: Autodesk Civil3D and Blender.Autodesk Civil 3D was selected because of its ability to export 3D surfaces of proposed roads,which can later be uploaded in Blender for texturing and conversion into the VRML file format.Blender is a robust 3D modeling tool available as an open-source product free of cost. Duringscenario creation, Blender plays a key role in the manipulation of dxf files, which contain thesurface of a project created from a 3D CAD drawing using a design software such as Civil 3D.Figure 2.1 University of Massachusetts Driving Simulator4
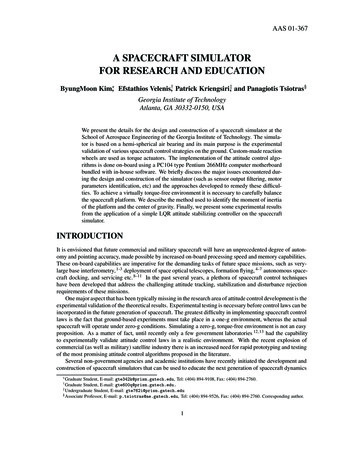
A Driving Simulator Evaluation of Cross-Sectional Design Elements and the Resulting Driving Behaviors2.2MeasuresThe independent variables for the current study were lane width, bicycle facility, curb median,clear zone, and shoulder. In order to not inhibit participants’ speed choice, there was no trafficin the participant’s direction of travel. In the oncoming direction, four vehicles, including a truck,were individually programmed so that traffic could be controlled across all participants for eachcross-section configuration.Data was collected continuously, but five locations were selected for data comparisons. Eachparticipant’s vehicle speed and lateral position at these five checkpoints were compared in allscenarios. Data collection checkpoints within the scenarios were (1) Start, (2) Straight, (3) SmallLeft Curve, (4) Right Curve, and (5) End.2.3Participants & ProcedureParticipants started by giving informed consent and then completed a pre-study questionnairethat asked for their demographics, driving history, and medical conditions that may influencetheir driving performance. Participants then completed a simulator sickness questionnaire toensure they were not at risk for simulator sickness. Before entering the simulator, participantswere fitted with the head-mounted eye tracker. After calibration, participants were given apractice drive session to familiarize them with the driving simulator. The practice training driveincluded a typical roadway with 12 ft lanes and 4 ft shoulder with a posted speed limit of 30mph. Prior to the driving experiment, participants were instructed to follow the posted speedlimit and to drive through all the scenarios as they normally would in their own vehicles.Finally, a post-study questionnaire was administered to evaluate post-exposure informationabout the virtual environments and their driving performance. Participants were compensated 20 for their time. All procedures, including informed consent, payment, and participantrecruitment followed Protocol ID#: 2016-2903 as approved by the Institutional Review Board(IRB) of the University of Massachusetts.A total of 20 drivers (nine females, eleven males) participated in the experiment. Their agesranged from 20-60 years old (mean: 29.35, SD: 10.91), and all had more than one year of drivingexperience (mean: 11.245, SD: 10.99) and minimal or no prior simulator driving experience.2.4Experimental DesignThe experiment consisted of approximately 1.5 miles of a simulated real-world scenario, whichwas typically a collector-type roadway. The base scenario was reconfigured using four differentgeometrical design cross-sections. The design elements included a narrower travel lane,increased shoulder widths, added bicycle lanes, a continuous center raised curb median, and acurvilinear roadway profile. In addition, roadside vegetation was manipulated. The order ofscenario occurrence was varied for each participant using the Latin Square method ofcounterbalancing. Screenshots of the five scenarios along with specific details on cross-sectionaldesign elements are shown in Figure 2.2.5
A Driving Simulator Evaluation of Cross-Sectional Design Elements and the Resulting Driving BehaviorsExisting Burnett Road, Chicopee MA, USA: 14fttravel lane, 8 ft shoulder, no medianBase Scenario (Sc1): 14ft travel lane, 8ft shoulder,no medianNarrower Lane (Sc2): 12ft travel lane, 6ftshoulder, no medianBicycle Lane (Sc3): 14ft travel lane, 5ft bicycle lane,1ft bufferzone, no median and no shoulderRaised Median (Sc4): 14ft travel lane, 2ft shoulder, Curved Profile (Sc5): 14ft travel lane, 2ft shoulder,6ft median6ft medianFigure 2.2 Experimental Scenario Description3ResultsThe research objectives addressed the relationship between cross-sectional design elementsand their effect on drivers’ behavior pertaining to their vehicle speed and lateral position. Theresults were consistent with the stated objectives and are detailed further below. As discussed,the main dependent variables were speed and lateral positioning, while the independentmeasures were various geometric roadway design elements (scenarios). Lateral position iscalculated by measuring the difference between the absolute center of the vehicle and thecenter of the travel lane within the simulated roadway scenario. Negative lateral position valuesindicate that a participant’s vehicle is closer to the centerline, while positive values imply that itis closer to the edge line. A between-subject t-test was used for comparative analysis. The αlevel was set at 0.05, and p values 0.05 were considered statistically significant.6
A Driving Simulator Evaluation of Cross-Sectional Design Elements and the Resulting Driving Behaviors3.17SpeedTo evaluate the participants’ vehicle speed data to address the objectives of various crosssectional design scenarios (Sc1, Sc2, Sc3, Sc4, Sc5), we looked at the mean participant speedacross the scenarios along all the checkpoints. Table 3.1 shows the mean speeds of participantsin each of the five scenarios at the five different checkpoints. For the base scenario (Sc1), with a14 ft wide travel lane and an 8 ft shoulder, the mean vehicle speed was M 29.5 and SD 5.4.As the participants drove into the scenario at Checkpoint 2 (straight), the mean speed increasedto M 35.6 with SD 8.4. At Checkpoint 3 (small left curve), the mean speed was M 39.5 withSD 10.0. At Checkpoint 4 (right curve), the mean speed increased to M 41.3 with SD 12.2,while at Checkpoint 5 (end of the roadway), it was M 41.6 with SD 13.7.Table 3.1 Descriptive statistics for speedObserved Mean Speeds for Scenarios at CheckpointsScenario d (mph)1. Start29.5 5.428.7 5.830.3 5.028.3 6.023.0 5.42. Straight35.6 8.436.0 6.937.0 6.535.7 6.925.9 5.53. Small LeftCurve39.5 10.039.5 8.239.8 8.238.7 9.327.2 5.24. Right Curve41.3 12.239.9 8.741.3 11.841.2 11.927.4 5.25. End41.6 13.740.9 10.140.7 14.841.2 14.130.6 5.5Note: All values are Mean St. Dev.Note: Bold indicate increased speed pattern from checkpoint 1 to 5Table 3.1 clearly demonstrates that the participants’ vehicle speed increased as they drovethrough the scenarios, irrespective of the roadway geometry. This trend seems to be constantacross all the scenarios along the checkpoints. The participants’ mean vehicle speed was lowerfor the curved roadway profile (Sc5) (10 mph less than the mean speeds of the base scenario),and participants did not tend to exceed the posted speed limit of 30 mph.The participants’ mean speeds for the narrower lane (Sc2) were comparatively lower than forthe wide-lane scenarios, i.e., Sc1, Sc3, and Sc4 along Checkpoints 1, 2, and 4, while the speeds atCheckpoints 3 and 5 were almost equal. The descriptive analysis shows that the participants’mean speed for the bicycle lane scenario (Sc3) was higher at Checkpoints 1, 2, 3, and 4, but notat Checkpoint 5, when compared with the base scenario (Sc1). Interestingly, introducing a 6 ftraised median in Sc4 resulted in a slight change in the speed profile (slight decreased speeds)when compared to the base scenario (Sc1) across all the checkpoints of the roadway.The paired t-test compared results between scenarios (
A Driving Simulator Evaluation of Cross-Sectional Design Elements and the Resulting Driving BehaviorsTable 3.2) and revealed no significant differences in speed between the base scenario (Sc1) andthe narrower lane (Sc2), the bicycle lane (Sc3), or the raised median scenarios (Sc4). This resultsupported the hypothesis that introducing a narrow lane, bicycle lane, or raised median wouldnot influence the participants’ speed at any of the checkpoints along the roadway. However,there seemed to be well established significance between the base scenario (Sc1) and thecurved roadway profile (Sc5), where p was much lower than 0.05 at all the checkpoints alongthe roadway.Paired t-tests between the narrower lane (Sc2) and the bicycle lane (Sc3) indicated somesignificance in participants’ mean speed at Checkpoint 1; p 0.02. Also, at Checkpoint 1,significant differences existed between the bicycle lane scenario (Sc3) and the raised medianscenario (Sc4); p 0.04.8
A Driving Simulator Evaluation of Cross-Sectional Design Elements and the Resulting Driving Behaviors9Table 3.2 Inferential difference of mean speed (mph) and paired t-test p valuesSceneCheckpoints1. (Sc4)Mean (P (0.57)0.4(0.66)11.0(0.00)1. Start-1.6(0.02)0.4(0.71)5.8(0.00)2. 0.85)-0.3(0.85)10.4(0.00)1. Start2.0(0.04)7.3(0.00)2. 0.86)13.99(0.00)-0.5(0.72)10.1(0.00)2. Straight3. Small LeftCurve4. RightCurve3. Small LeftCurve4. RightCurve3. Small LeftCurve4. RightCurve5. EndRaisedMedian(Sc4)CurvedProfile(Sc5)-0.8(0.81)5. EndBicycleLane (Sc3)NarrowerLane(Sc2)0.8(0.66)5. EndNarrowerLane (Sc2)BaseScenario(Sc1)1. Start5.3(0.00)2. Straight9.8(0.00)3. Small LeftCurve4. RightCurve5. EndNote: Bold indicates a significant difference based on a Paired t-test11.5(0.00)13.7(0.00)10.7(0.00)
A Driving Simulator Evaluation of Cross-Sectional Design Elements and the Resulting Driving Behaviors3.210Lateral PositioningThe participants’ mean vehicle lateral positioning is displayed in Table 3.3. Participants drovefurther from the centerline in the base scenario (Sc1) along Checkpoints 1, 2, 3, and 5 andtowards the center line at Checkpoint 4 (right curve), M -0.9 SD 0.6. In the narrow lanescenario (Sc2), as expected, participants drove close to the center line along all checkpoints withthe exception of Checkpoint 5. Similar patterns were observed in the bicycle lane scenario (Sc3),where participants drove further from the center line irrespective of the checkpoint geometry.For the curved roadway profile scenario (Sc5), participants moved towards the edge line at allcheckpoints except for Checkpoint 5, where the participants positioned themselves closer to thecenter line.Table 3.3: Descriptive statistics for lateral positionObserved Mean Lane Positions for Scenarios at CheckpointsScenario ral Position (ft)1. Start1.7 0.9(-) 1.5 0.62.0 0.97.2 4.31.9 2.72. Straight1.9 0.7(-) 1.4 0.72.2 0.98.3 2.61.9 2.53. Small Left Curve2.2 0.6(-) 0.8 0.72.1 0.74.9 5.03.2 1.7(-) 0.9 0.6(-) 1.1 0.62.3 0.74.0 2.90.4 1.32.6 1.20.3 1.04.9 0.1(-) 1.5 4.4(-) 0.03 4.34. Right Curve5. EndNote: Values are Mean St. Dev.Note: (-) indicates vehicle position closer to centerline.To achieve the research objectives and test the developed hypotheses, paired t-tests wereperformed between the scenarios at all checkpoints to explore the participants’ lateralpositions (Table 3.3). Although the participants moved towards the edge line in most of thescenarios, there seemed to be statistical significance in terms of vehicle lateral positionbetween the base scenario (Sc1) and the narrower lane (Sc2) along all the checkpoints wherep 0.05, indicated in
A Driving Simulator Evaluation of Cross-Sectional Design Elements and the Resulting Driving BehaviorsTable 3.4. A similar comparison between the base scenario (Sc1) and the bicycle lane scenario(Sc3) revealed little significance at Checkpoints 1, 2, and 3 (p 0.05), while at Checkpoints 4 and 5the differences were statistically significant. A paired t-test between the base scenario (Sc1) andthe raised median scenario (Sc4) revealed that, at all the checkpoints, lateral position meandifferences were not significant. For the base (Sc1) and curved roadway profile (Sc5) scenarios,the patterns are quite different. At Checkpoints 1, 2, and 4 the mean difference seemed to bepoorly significant, while at Checkpoints 3 and 5 the differences were significant.As shown in11
A Driving Simulator Evaluation of Cross-Sectional Design Elements and the Resulting Driving BehaviorsTable 3.4, additional paired t-tests were performed to explore the lateral positioning betweenthe the narrower lane (Sc2), bicycle lane (Sc3), raised median (Sc4), and curved roadway profile(Sc5) scenarios. It is evident that there is high significance along Checkpoints 1, 2, 3, and 4between the narrower lan
A Driving Simulator Evaluation of Cross-Sectional Design Elements and the Resulting Driving Behaviors 1.1 Design Factors Affecting Crash Rates In this study, the following geometric elements were specifically considered due to their effects on crash rates: lane width, median area