Transcription
the JournalofFINANCEVOL. XXVIDECEMBER1971No. 5THE SUPPLY OF MONEY AND COMMON STOCK PRICESKENNETH E. HOMA AND DWIGHT M. JAFFEE*I.INTRODUCTIONhave been applied with a degreeofof individualcommonstock prices,success in studiesof the determinantshas been givento theuse of thesetechniquesin forelittleattentionrelativelycastingshortrun movementsin aggregateindicesof commonstock prices.This lack of attentionis surprisingsince accurate forecastsof the averagethelevel of stock pricesare of obviousand practicalvalue fordeterminingtimingof stock market agein thiscontextthattheytechniqueshave theimportantforecastingrepliyieldresultsthatare objectiveand quantitativeand can be consistentlycated.techniquestoIt remainstrue,of course,thattheapplicationof econometricThe main problemis that any assumedis and avefactors.Thus, giventhelimitedsuccesseconometricianson expectationalit is apparentthata completeof expectations,had in explainingthe formationof stockpricesis not possibleatof the determinantsstructuralspecificationneed not precludethe derivationthistheotherhand,problemOnthistime.and a stockindexthatarevariableseconomicbetweenof partialrelationshipsof the index.movementsfutureinusefulbeforecastingstable tosufficientlyat this time to undertakeat least anit appears worthwhileConsequently,thestudyof the value of econometrictechniquesin forecastingexploratoryaveragelevelof stockprices.the objectiveof thispaper is to developand estimateaMore specifically,betweenthesupplyofmoneyand an indexofcommonstockprices,relationshipas a forecastirgtooland thento evaluatethe usefulnessof this relationshipof the moreyThe importanceof investmentstrategies.in theimplementationof stockpricesmay be derivedboth fromthe strucsupplyas a determinantALTHOUGH ECONOMETRIC TECHNIQUES* DepartmentThe studywas supportedby the InstitutePrincetonUniversity.of Economics,Researchin Finance.We wishto thankProfessorRay C. Fair and BurtonG.forQuantitativeon an earlierdraft.Malkielforhelpfulcomments1045
1046The Journalof Financeturallink of the stockmarketwithmonetaryconditionsand fromthe rolethatthemoneysupplyplays as a generalindicatorof economicexpectations.The omissionof othereconomicvariablesfromthe relationshipshouldnot,however,be takenas a presumptionthat the moneysupplyis the only importantdeterminantof aggregatestock prices.Indeed, it is hoped that theresultspresentedherewillprovidea basis forthe developmentof morecompleteand structuralspecificationsof themonetaryand ofstockprices.'The plan of the paper is as follows.In SectionII the theoreticallinksbetweenthe moneysupplyand the stock marketare developedand previousstudiesare brieflyreviewed.In SectionIII therelationshipbetweenthemoneysupplyand a stockpriceindexis estimatedusingthetechniquesof regressionanalysis.The estimatesare based on quarterlydata over the period 1954 to1969. In additionto the stock marketequation,an equationexplainingthemoneysupplyis also estimatedso that"outsideof sample" forecastsmay bemade.In SectionIV thestockmarketforecastsare used to simulateinvestmentstrategiesovertheperiodof thedecade of the 1960s.The resultsof thepaperare summarizedand theprincipalconclusionsare drawnin SectionV.II.THE RELATIONSHIP BETWEEN THE MONEY SUPPLYAND THE STOCK MARKETThe natureof therelationshipbetweenthemoneysupplyand commonstockpricescan be mosteasilydescribedif a shareof commonstockis viewedas anasset thatyieldsits returnto the investorover time.The value of the sharecan thenbe writtenin termsof the presentdiscountedvalue (PDV) of theexpecteddividends: 1t'*- D0(1 gt)tPDV0 0PDVo(I1?rt pt)t'(1)whereDo is the level of currentdividends,gt is the expectedgrowthrate ofdividendsat timet, and theexpecteddiscountrateconsistsof therisklessratePt.2An investorshouldbe willing,by definition,to payrtand theriskpremiuma priceequal to the PDV forany share.It is thusapparentthatthe price ofany shareof commonstockwill be determinedby threevariables: the leveland d theriskpremium.It nowwill be shownthatthe moneysupplyis positivelyrelatedto the leveland growthrate of dividends,and negativelyrelatedto the risklessrate ofinterestand the riskpremium.The averagelevel of stockpriceswill,consequently,be positivelyrelatedto themoneysupply.The main channel for the influenceof the moneysupply on dividends1. One attemptat estimatingsuch a relationshipforuse in simulatingmonetaryeffectswithina macroeconomicmodelis describedin RobertH. Rascheand Harold T. Shapiro,"The F.R.B.M.I.T. EconometricModel: Its SpecialFeatures,"AmericanEconomicReview,LVIII, 2 (May,1968),pp. 136-137.of thiscommonstockvaluationtormulacan be foundin BurtonG. Malkiel,2. A fullerdiscussion"EquityYields,Growth,and the Structureof SharePrices,"AmericanEconomicReview,LIII.,5 (December,1963),pp. 1004-1031.
Money and CommonStock Prices1047operatesthroughthe firm'scurrentand expectedearnings.Giventhe demandformoney,a decreasein the supplyof moneywill raise interestrates andreduceinterestsensitiveexpendituressuchas capitalinvestment.The decreasein expenditures,togetherwiththe standardmultiplier,will thencause a reductionin the firm'ssales and thusa decreasein its earnings.The timingofthe effectof the decreasedearningson dividendsmay dependon the firm'scash flowand liquidityposition,but ultimatelythe fulleffectmustbe a decreasein dividends.Althoughthecurrentpriceof thecommonstocksharewillfallif currentdividendsare reduced,themainpointof leverageforthe effectof themoneysupplyis on theexpectedgrowthrateof dividends.It is forthisreasonthat the expectationaleffectsof the moneysupplyon dividendsareat leastas importantas anyactualshortruneffectsin determiningtheresponseoftheshareprice.The influenceof the moneysupplyon the risklessinterestrate componentof the investor'sdiscountrate is a directfunctionof the effectof the moneysupplyon marketinterestrates.The explicitincreasein marketinterestratescausedby increasedmonetarytightnessmay,moreover,be reinforcedby creditrationingin the loan markets.In thiscase, monetarytightnesswill raise thediscountrateby an amountgreaterthanwouldotherwisebe indicatedby thelevel of marketinterestrates alone. As withthe effectof the moneysupplyon dividends,it shouldagain be stressedthatthe major impactof the moneysupplyon the risklessinterestrate is in termsof the changein the expectedvalues forfuturelevels of thisrate ratherthan in the actual changein thecurrentvalue.The influenceof the moneysupplyon the riskpremiumcomponentof thediscountrateis moredifficultinvestor'sto quantify.The riskcomponentarisesbecause of the uncertaintyassociatedwithfuturevalues of the growthrateof dividendsand thelevel of the risklessinterestrate.Assumingthe investoris a risk-averter,the risk premiumwill be positiveand it will be positivelyassociatedwithincreaseduncertainty.The effectof monetarytightnesson theriskpremiumthusmustoperateby increasingtheuncertaintywithwhichtheare held.This suggeststhatincreasesin the degreeofinvestor'sexpectationsas thelevelof themonetarymonetarytightnessmaybe as importanttightnessin influencingtheriskpremium.Althoughthebasic channelsfortheeffectof themoneysupplyon thepriceof commonstock shares can be distinguishedin the precedingmanner,anexplicitformforthe relationshipmustbe specifiedif therelationshipis to beestimatedand used forforecasting.One approachto this problemhas beendevelopedby Beryl Sprinkel.3By comparingthe turningpointsin a stockprice indexwiththe turningpointsin the growthrate of money (narrowlydefinedwitha six monthmovingaverage),Sprinkelformulatedan investmentrulethat,"a bear marketin stockpriceswas predicted15 monthsaftereachpeak in monetarygrowth,and thata bull marketwas predictedtwo monthsaftereach monetarygrowthtroughwas reached."43. BerylSprinkel,Moneyand StockPrices,(Homewood,Illinois:RichardD. Irwin,Inc), 1964.4. Sprinkel,op. cit.,p. 120.
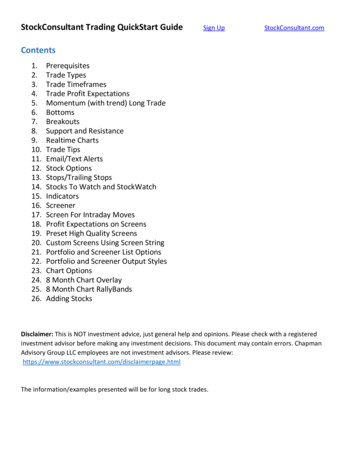
The Journalof Finance1048rule workedwell over most of Sprinkel'ssample periodThis investmentfrom1918 to 1960,but it has not workedwell morerecentlyin thedecade ofis thatvariationsin the growthrate ofthe 1960s. The problemencounteredthemoneystockhave becomeless continuousand thatthecyclesthatdo existare less than 15 months.This is illustratedin Table 1 whichshowsthe sixTABLE 1GROWTH RATES OF THE MONEY SUPPLY:1960-1 TO 1969-4Points)a(AnnualRatesin 44.005.886.605.481.64- a Moneydefinedsix monthoutstanding,as seasonallyadjusteddemanddepositsplus currencymovingaverageat end of and RelatedData."monthaverageof the moneysupplygrowthrate on an end of quarterbasisforthe period 1960-1 to 1969-4.Local peaks and troughsin the monetarygrowthrate serieshave been markedin the table withthe lettersP and TBecause Sprinkel'srule indicatesa 15 month(5 quarter) lag inrespectively.thesale of stocksaftera peak in the monetarygrowthrate is reached,peaksand troughsin the growthrate seriesmustbe separatedby at least this inIt can be seen fromthe table that,intervalif theruleis to be implemented.fact,the maximumspan betweenpeaks and troughshas been 9 months(3quarters)withthe exceptionof the mostrecentpeak. The resultis that thesell signals(15 monthsaftera peak) are all canceledby buysignals(2 monthsand thus an investorusingaftera trough)beforetheycan be implemented,the fullthe Sprinkelrule would have simplyremainedin stocksthroughoutwiththeinitialbuysignalin 1960-3.periodbeginningIn this studythe relationshipbetweenthe moneysupply and the stockmarketis estimatedusing the techniquesof regressionanalysis.In contrastto the turningpointmethodof Sprinkel,regressionanalysishas several imofin the specificationportantadvantages.First,it allows formoreflexibilityIn particular,specificpeaks in the moneystock andlagged relationships.
Money and CommonStock Prices1049Second,monetarygrowthrate series do not have to be explicitlyidentified.the forecastsgeneratedby a regressionequation are quantitativeand thestandarderrorof the forecastcan be calculated.This aspect has the usefulassociatedwith the forecastcan be taken intofeaturethat the uncertaintyanalysisstrategy.Finally,regressionan investmentaccountwhenformulatingcanin theforecastssincethe nthebe easilyrevisedas moredata becomeavailable.In the followinganalysisis described.of a stockmarketequationusingregressionestimationIII. ESTIMATIONOF THE FORECASTINGRELATIONSHIPSThe threeprimaryvariables to be used in estimatingthe stock marketequationare thelevel of stockprices,denotedby SP, the level of the moneysupply,denotedby M, and the rate of growthof the moneysupply,denotedby the Standardand Poor's Corporationby G. Stockpricesare representedcombinedindexof 500 stocks,measuredon thelast Fridayof thequarter.Theseries is expressedin relativeswith the average value for the base period(1941-1943) equal to 10. The moneysupplyseriesis thequarterlyaverageofseasonallythe sum of adjusted demanddepositsand currencyoutstanding,adjustedand measuredin billionsof currentdollars.The moneysupplygrowthrateis calculatedas (M - M1)/M-1, and is measuredat a quarterlyrateinpercentagepoints.The data were collectedfor the period from1954-1 to1969-4.The beginningof theperiodwas chosenin 1954 to providethelongestpossible post-warsample withoutincludingthe unusual conditionsin thefollowingWorldWar II and duringtheKoreanWar.periodsimmediatelyThe equationwas specifiedwithboth the level and the growthrate of theusefulmoneysupply,thelatterbeingincludedbecause it may be particularlyin accountingforshortrunvariationsin expectations.Because thereis littlea numbera prioriinformationavailableon thespecificformof therelationship,on the moneysupplyof regressionswerefittedwithalternativelag structuresand monetarygrowthrate.5A majorproblemthatarose withtheseestimatesThis was takenintowas countin furtherestimatesby assumingthattheerrortermsof theequationof serialcorrelafollowa firstorderserialcorrelationpattern.The coefficienttionwas thenestimatedby includingthe laggederrortermin the regressionand usingtheiterativetechniqueof Cochraneand Orcutt.6whichyieldedthebest fitwas foundwhenthelevel of theThe relationshipmoneysupplyvariablewas includedwithits currentvalue and thegrowthratevalue and a one quarterwithbothitscurrentofthemoneysupplywas specifiedthatweretestedcanbe foundin Kennethofthevariousspecifications5. A "unpublishedE. Homa,"Moneyand StockPrices:An EconometricUniversity,April,1970.See also JosephS. Mascia,"MonetaryChangesand rsimpliesthatif the errorin estimationof firstorderseriallycorrelated6. The assumptionwill befromthe serialcorreIationin periodt - 1 is ut 1,thenthe errorin periodt resultingis takenintoaccountin estimatingof serialcorrelation.This effectput ,,wherep is thecoefficienttheserialcorby includingthelaggedresidualut-1 in theequationand estimatingtherelationshipof Least SquaresRegressionp. See D. Cochraneand G. H. nalof elatedto RelationshipsMarch,1949.
1050The Journalof Financeover the sample periodfor this specificationlag. The estimatedcoefficientsfrom1954-4to 1969-4 (takinginto accountthe laggedvariables,the sampleactuallybeginsin 1954-1) were:7SP -26.77 .61M 3.14G 1.46G-1 .87u .(1.11) (4.13) (3.16) (1.46)Se 3.70 D.W. -2.14R2 .968(2)The moneysupplyvariablesall have theexpectedpositivesign,and M and GAlso,over96 per centof thevarianceis explainedsignificant.are statisticallythis high correlation,however,is the largeOffsettingby the specification.of serial correlation(.87), whichimpliesthat 87 per cent of rwouldrecurif theserialcorrelationaccuracyon the forecastingaccount.The effectof thishighserialcorrelationdiscussedof the equation can be evaluated in the simulationexperimentsbelow.'The stock marketforecastsgeneratedby equation (2) will be used instrategiesover a periodfrom1960-1SectionIV in simulationsof investmentto 1969-4.To insurethatthe forecastsare strictly"outsidethe sample,"it isbe considered.First,it is importantthat thenecessarythattwo restrictionsestimatesincorporateonly data which would have in fact beencoefficientestimatesavailable at the timeof the forecast.For example,the coefficientused to generatethestockmarketforecastfor1960-1shouldbe based onlyonforthe 1960-2 forecastshouldusedata for1959-4or earlier; the coefficientsonly data for 1960-1 or earlier,and so on. To obtain these estimates,40of equation (2) andwerefittedusingthe specificationadditionalregressionsin 1954-4and endingin the quarters1959-4tosampleperiodseach beginningwere then used to generateall theThese coefficients1969-3 he secondfactorthatmustbe consideredto insurevalid outsideof sampleforecastsconcernsthedata thatis used withthe respectivesets of coefficients.The problemarisesbecause thecurrentvalue of the moneysupplyenterstheof equation (2) throughthe M and G variables.Consequently,specificationto forecastthe stock marketone period ahead, it isto use the coefficientsnecessaryto use one periodahead predictionsof the moneysupply.The accuracyof the stockmarketforecastsis thusdependenton the abilityof theIn thisstudythreealternativeto the predictionof the moneysupplyare used. The firsttwo ofare shownin parenthesesand u 1 is the laggedresidual7. The absolutevaluesof T-statisticscan be onlyindicative,used to correctforthe serialcorrelation(see footnote6). The T-statisticsused to findthelag structure.of course,becauseof theexperimentationdue to8. An additionalproblemarisesfromthe potentialbias in the estimatedcoefficientsof equationsbias.Testswithinstrumentaland thus the ordinaryleast squaresfitsdid not ve beenused.lag structurefor9. It shouldbe notedthatthe fullsamplewas used to findthe appropriatedo containex-postinformationto this extent.Since theequation(2), and thus the forecaststo be an importantestimateswerenotverysensitiveto theformofthelag structures,thisis unlikelysourceof bias.
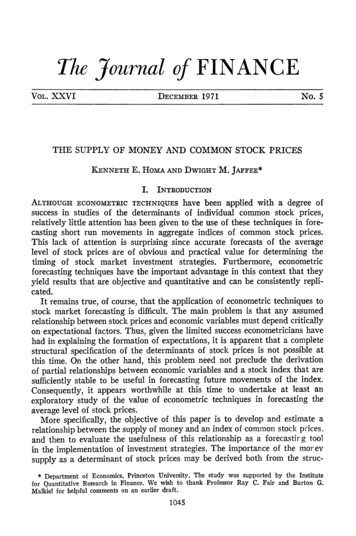
Money and CommonStock Prices1051thesemethodsare: (i) perfectforesightof M and (ii) naive extrapolationofM. For assumption(i) it is assumedthat the investorcan perfectlypredictthemoneysupplyone periodahead, and thusthe actual values of the moneysupplyare used in generatingthe forecastvalues of the stock market.Forassumption(ii), it is assumedthatthe investorpredictsthe moneysupplybysimplyextrapolatingthe currentgrowthrate of the moneysupply to theforecastperiod.The trendextrapolationof assumption(ii) is thus a naivemethodof predictionthatcouldalwaysbe duplicatedby an investor.The stock marketforecastsgeneratedby the moneysupply assumptions(i) and (ii), using the coefficientestimatesdescribedabove, are shownincolumns(2) and (3), respectively,of Table 2. The summarystatisticsat thebottomofthecolumnsshowthecorrelation(R2), root-mean-squared-error,andmean errorbetweenthe forecastvalue and the actual value of the stockmarket(shownin column(1)). Because the stockmarketforecastsare generatedby coefficientsestimatesbased on outsideof sample procedures,andbecausein thecase of assumption(ii) the currentmoneysupplydata are notused,the correlationbetweenthe forecaststockmarketseriesand the actualseriescould,in principle,be significantlylowerthan the correlationobservedforequation (2) fittedover the entiresample. It is thus quite encouragingthatthesummarystatisticsindicatea goodnessof fitbetweenthe forecastandactual seriesthatis stillveryhigh.Furthermore,the correlationforthe forecast values generatedby the naive extrapolationof M is only slightlylowerthan the correlationfor the forecastsbased on perfectforesightof M; thissuggeststhe stockmarketforecastingequationmay be reasonablyrobusttoerrorsin predictingthemoneysupply.In order to furthertest the stock marketequation's abilityto provideaccurate forecasts,a thirdmethodof generatingpredictedvalues for themoneysupply series,regressionanalysis,was also attempted.The methodinvolvedestimatinga moneysupplypredictionequation,on the premisethatit wouldimproveon thenaivepredictionsof assumption(ii), whileusingonlydata actuallyavailableat thetimeof the forecast.The dependentvariableinthe equationwas the growthrate of the moneysupply,G, and the equationwas specifiedas a reducedformso thatboth l Reservebehaviorand demandvariablesreflectingthe demandformoneycould be included.In preliminaryexperimentsthe coefficientsofthedemandvariableswereunstableand notstatisticallysignificant,however,so onlythesupplyvariableswereincludedin the finalspecification:G a0 aiU2? a2P i a3BOP-1 a4G-I,(3)whereU is the unemploymentand BOP is arate,P is the rate of inflation,relatedto theU.S. he firstthreeof thevariablesenteredin the equationrepresentthepolicy10. The data sourcesforthesevariablesare as follows:rate fromthe BLS HouseholdSurvey;U: civilianunemploymentP: privateoutputpricedeflatorfromthe NationalIncomeAccounts;BOP: the ratioof U.S. reserveassets(gold stockand IMF reserveposition)to totalU.S. shortto foreigners,measuredas a deviationfroma fourquartermovingaverage.termliabilities
The Journalof Finance1052TABLE 2ACTUAL AND FORECAST STOCK MARKET SERIES:1960-1 TO 1969-4ofM an-SquaredErrorMean mption(2).9084.847-.784ofindicatorsto whichthe Federal Reservenormallyreacts.The coefficientsU and BOP shouldbe positive,assumingthe Federal Reserveincreasestheand a goodgrowthrateof themoneysupplyin periodsof highunemployment
Money and CommonStock Prices1053of P shouldbe negative,assuminternationalreserveposition.The ateof M in periodsof inflation.sinceThe unemploymentrateis enteredas a squaredtermin thespecificationthis workedslightlybetterthan the linear form.The lagged value of thegrowthrateof themoneysupplyis includedbecauseinertiaon thepart of thebetweenthepresentand thelaggedFederalReservewouldlead to correlationgrowthrate; this variable should thus enter with a positivesign in theequation."-Equation (3) was initiallyfittedwith the Cochraneand Orcuttmethodusingthe same proceduresdevelopedforthe stockmarketequation; that is,theinitialperiodforthesamplewas set in 1954-4and then40 regressionswerefittedwiththe end of the samplemovingfrom1959-4to 1969-3.Because thevariablesall entertheequationwitha lag, theproblemof predictexplanatorying themdoes not arise as it did forthe moneysupplyin the stock marketequation.The resultswere not entirelysatisfactory,however,because thevariedconsiderablyover the set of regressions.estimatedcoefficientsThis isperhapsnot altogethersurprisingsince the Federal Reserve's priorities,intermsof thevariableslistedabove,mayhave also changedovertheperiod.Inorderto at least take thispossibilityintoaccount,the finalset of regressionswas estimatedusinga movingsampleof 20 quarterlyobservations(5 years):was estimatedoverthesample1955-1to 5-2to 1960-1,and so on to thelast regressionwas estimatedforeach of theseestimatedoverthesample1964-4to 1969-3.The coefficientsequationswerethenused to calculatethepredictedvalue of themoneysupplyseries for 1 quarterbeyondthe respectivesample period.To illustratethenatureof these results,the estimatedcoefficientsfor threesample periodsspanningthefullsampleare shown:Sample: 1955-1to 1959-4G --.53 2.61U2 1 .20P-1 .58BOP-1 .36G-1 .01u1(1.62) (2.65)R2 (.73).529(.47)Se .413(1.31)D.W. 1.61Sample: 1960-1to 1964-4G .70 .60U2 1 .15P-1 6.06BOP-1 .26G-1 .11u1(1.23) (.40)(.12)(1.79)(1.26)R2.544Se .385(1.97) (.87)R2-(4b)D.W. 2.12Sample: 1965-1to 1969-4G 3.07 - 8.47 U2(4a)(4c)14.17P.1. .12 BOP1 .37 G 1 .58 NP gap11. Severalothervariableswerealso testedin theequation,in particularand lagged changesin the Federal Reserve'sdiscountrate and requiredreserveratio. Thesewhenincludedalone,but werenot significantwhentestedwiththe fullvariablesweresignificantbecauseof multicollinearity.specification,presumably
The Journalof Finance1054The goodnessof fitshownin theseresultsis reasonable,recallingthatthedependentvariableis the growthrate of the moneysupply.The coefficientestimates,on the otherhand, are disappointingbecause many are not significantand in threecases thesignis notcorrect.It shouldbe noted,however,that the unemploymentvariable in the 1954 torate is the mostsignificant1959 sample,theinternationalreservepositionvariableis themostsignificantvariable in the 1960 to 1964 sample,and the rate of inflationis the mostsignificantvariablein the 1965 to 1969 sample.These resultsare thusbroadlyconsistentwiththe acknowledgedchangesin the Federal Reserve System'sprioritiesoverthesampleperiod.The insignificantcoefficientestimates,moreover,may be attributedto multicollinearity,since the variableswere all generallysignificantand had the correctsign when regressedalone against G.Consequently,thegoodnessof fitof theequationmaystillbe a valid indicatorof the equation'spredictingaccuracy. In addition,the relativelysmall coefficienton thelaggedgrowthrateof themoneysupplyis also an encouragingfactor,because it suggeststhat the predictedvalues for the moneysupplygeneratedby thisequationwillbe differentfrom,and presumablyan improvementon, thevalues impliedby the naive extrapolationmethodof assumption(ii) discussedabove.The forecastvalues forthe stockmarketthatare generatedby the moneysupplypredictionsof the regressionequation are shownin column (4) ofTable 2. The correlationof the forecaststock marketserieswiththe actualstockmarketseriesis .908. As shouldbe expected,thiscorrelationis less thanof theactualstockmarketserieswiththeassumption(i) forethecorrelationcast seriesbased on perfectforesightof M, but it is greaterthanthe correlation of the actual series with the assumption(ii) forecastseries based onof the growthrate of M. In the followingsection,thesenaive extrapolationthreeseriesof stockmarketforecastsare comparedin simulationsof investmentstrategies.IV.SIMULATION OF INVESTMENT STRATEGIESA. DescriptionoftheSimulationsThe objectiveof the simulationexperimentspresentedin this sectionis towellaninvestorwouldhavefaredhowevaluateusingthe sticinvestorinvestmenta hypotheticalstrategy,basing histhatwouldhave been available to a real life investor.choiceon informationschemethat couldThe patternof decisionswill thus reflectan investmenthave beenactuallyfollowedin practiceby an investor.investorwillhave onlytwofinancialmedia at his disposalThe hypotheticalare represented-common stocksand Treasurybills.The formerby Standardand Poor's compositeindex of 500 stocks.The investorwill buy and sellof shares,as the case may be, of the aggregateequityinshares,or fractionsat 81.00 anddicator.For example,if theStandardand Poor indexis currentlytheinvestorwishesto invest 40.50, it is assumedthathe is able to purchase1/2 of a shareof the compositeindicator.Three monthTreasurybills serve
Money and CommonStock Prices1055as the proxyfor the investor'sTreasurybill alternative.For purposesofit is assumedthat the investorpurchasesa new issue at the asksimplicity,is reached,and thenredeemsthenotesyield,holdsit untilthe90 day maturitythereare no explicittransactionscostsinvolvedat facevalue. Consequently,in eitherthepurchaseor sale of thebills.decisionper quarter,The investorwill be permittedonly one investmentand it will be made at theverybeginningof the period.The firstchoicewillbe made at the beginningof 1960-1 and the last choice at the beginningof1969-4.The stock index and Treasurybill yield are measuredon the lastFridayof each quarterto coincidewiththe timingof the investor'sdecisions.strategyis based on thepremisethattheinvestorattemptstoThe investmentmaximizehis expectedprofits.At each decisionpoint he will comparetheexpectedreturnon stockswiththe yieldon bills,and investall his capitalinthe alternativethatoffersthe greaterexpectedprofitpotential.The expectedreturnon stockis definedto atedby the stock marketforecast,but also the dividendsthat accruetothestockovertheholdingperiod.Because dividendsare typicallyannouncednearlya quarterahead of the actual paymentdate, it is assumedthat theinvestoruses the actual dividendrate for the forecastperiodin calculatinghis returnfromholdingstocks.12theoptionto gotheinvestorwillalso be permittedIn one setof simulations,it is assumedthatthe computerprogramming,on margin.In orderto simplifytheperiodand that,if thea 50 per centmarginratewas availablethroughoutinvestoruses themarginoption,thenhe uses it to thefullextent.The interestfundsforthemarginaccountis calculatedat the same ratecostof borrowingas theyieldon Treasurybills.13The investorwill chooseto go on marginforthoseperiodsin whichhe is in stocks,wheneverthe expectedreturnon stocksexceedsthe standarderrorof estimateof the mostrecentstockmarketforecostingequation he has available.14By using this method,the investor'sof the expectedgain fromtheto go on marginbecomesa functionwillingnessattendentwiththis formstockportfoliorelativeto the are also includedin the decisionsmade by the investor.It is assumedthatthe cost of buyingor sellingequityclaimsis one per centThus on any movementin or outof the totaldollarvalue of the transaction.of stockstheinvestor'scapitalis reducedby one per centbeforethe calculationof theexpectedreturnsforthatperiod.On theotherhand,if theinvestordecidesto maintainhis currentpositionforanotherquarter,whetherit be incosts are collected.This will motivatestocksor bonds,thenno transactionswereobtainedfromthe"Bond and StockYields"12. The dividendratedata forthesimulationstablein theFederalReserveBulletin.costof theyieldforthe opportunity13. The Treasu
supply and a stock price index is estimated using the techniques of regression analysis. The estimates are based on quarterly data over the period 1954 to 1969. In addition to the stock market equation, an equation explaining the money supply is also est