Transcription
Downloaded from orbit.dtu.dk on: Apr 04, 2022Introduction to computed tomographyCantatore, Angela; Müller, PavelPublication date:2011Document VersionPublisher's PDF, also known as Version of recordLink back to DTU OrbitCitation (APA):Cantatore, A., & Müller, P. (2011). Introduction to computed tomography. DTU Mechanical Engineering.General rightsCopyright and moral rights for the publications made accessible in the public portal are retained by the authors and/or other copyrightowners and it is a condition of accessing publications that users recognise and abide by the legal requirements associated with these rights. Users may download and print one copy of any publication from the public portal for the purpose of private study or research. You may not further distribute the material or use it for any profit-making activity or commercial gain You may freely distribute the URL identifying the publication in the public portalIf you believe that this document breaches copyright please contact us providing details, and we will remove access to the work immediatelyand investigate your claim.
Introduction to computedtomographyAngela CantatorePavel MüllerMarch 2011Manufacturing EngineeringDepartment of Mechanical EngineeringTechnical University of Denmark
ForewordSince computed tomography (CT) has entered the industrial environment around thirtyyear ago, an increasing interest for this technology was shown especially in the nondestructive testing, thanks to its advantages in comparison with traditional destructivetechniques. The development of powerful systems with more stable X-ray sources andbetter detectors aroused the interest of manufacturing and coordinate metrology. Thecurrent challenges of CT is in the quantification of measurement uncertainty, which is notfully established yet because of multiple factors affecting the traceability of these systems.This report is an initiative of the project ”Center for the industrial application of CTscanning - CIA CT: Advanced 3D scanning measurement, quality assurance and productdevelopment in industry”. The four-year CIA-CT project is promoted by a consortiumconstituted by nine companies having expertise in the CT field in Denmark with theaim of creating a national competence center in the industrial application of CT andconduct research of benefit to the participating firms, Danish industry and Danish society,focusing on the industrial application of CT as advanced 3D scanning measurement,quality assurance and product development.This report focuses on CT applications for industrial and metrological purposes, whereattention is on the current challenges in CT, i.e. establishment of traceability anduncertainty assessment. An overview of factors influencing CT accuracy is described.A thorough review of the state of the art, a theoretical analysis and an experimentalinvestigation in order to assess the influence of reference, instrument, workpiece,environment and procedure on the precision and traceability of measurement resultsfrom CT, is realized. In particular, experimental investigations concern methods andtechniques to correct and reduce errors and artefacts due to a defined parameter, both asthey can be found in literature and performed by the authors.Angela Cantatore, Pavel Mülleri
ii
ContentsForewordi1Introduction1.1 State of the art . . . . . . . . . . . . . . . . . . . . . . . . . . . . . . . . . . .1.2 Structure of the report . . . . . . . . . . . . . . . . . . . . . . . . . . . . . .1122Non-destructive testing2.1 Magnetic part inspection . . . . . . . . . . . . . .2.2 Eddy current testing . . . . . . . . . . . . . . . .2.3 Ultrasonic testing . . . . . . . . . . . . . . . . . .2.4 Optical non-destructive testing . . . . . . . . . .2.4.1 Holographic interferometry . . . . . . . .2.4.2 Electronic speckle pattern interferometry.4467889CT technology3.1 CT principle . . . . . . . . . . . . .3.2 Medical vs. Industrial CT systems3.3 CT systems classification . . . . . .3.4 CT applications . . . . . . . . . . .3.5 Advantages and disadvantages . .121215202022Influence factors4.1 Hardware . . . . . . . . . . . . . . . . . . . . . . . . . . . . . . . .4.1.1 X-ray source . . . . . . . . . . . . . . . . . . . . . . . . . . .4.1.2 Rotary table . . . . . . . . . . . . . . . . . . . . . . . . . . .4.1.3 X-ray detector . . . . . . . . . . . . . . . . . . . . . . . . . .4.2 Software/data processing . . . . . . . . . . . . . . . . . . . . . . .4.2.1 3D reconstruction . . . . . . . . . . . . . . . . . . . . . . . .4.2.2 Threshold determination and surface generation . . . . . .4.2.3 Data reduction . . . . . . . . . . . . . . . . . . . . . . . . .4.2.4 Data correction (scale factor correction) . . . . . . . . . . .4.3 Measurement object . . . . . . . . . . . . . . . . . . . . . . . . . . .4.3.1 Penetration depth (attenuation), dimension and geometry4.3.2 Beam hardening . . . . . . . . . . . . . . . . . . . . . . . .4.3.3 Scattered radiation . . . . . . . . . . . . . . . . . . . . . . .4.3.4 Material composition . . . . . . . . . . . . . . . . . . . . . .4.3.5 Surface roughness . . . . . . . . . . . . . . . . . . . . . . .2627273235373737394445455052545534.iii.
4.44.55Environment . . . . . . . . . . . . . . . . . . . .Operator . . . . . . . . . . . . . . . . . . . . . .4.5.1 Magnification . . . . . . . . . . . . . . .4.5.2 Workpiece positioning and orientation4.5.3 Number of projections . . . . . . . . . .4.5.4 Detector exposure time . . . . . . . . .Conclusion.56565758626364References65iv
Chapter 1IntroductionThis chapter provides a short introduction to computed tomography (CT), covering themain milestones from the discovery of X-ray till modern applications of CT in the field ofindustrial metrology.1.1State of the artX-rays were discovered in 1895 by the German physicist Wilhelm Conrad Röntgen,who earned the Nobel Prize in Physics in 1901. Although their potential applicationsin medical imaging diagnosis were clear from the beginning, the implementation ofthe first X-ray computed tomography system was made in 1972 by Godfrey NewboldHounsfield (Nobel prize winner in 1979 for Physiology and Medicine), who constructedthe prototype of the first medical CT scanner and is considered the father of computedtomography. CT was introduced into clinical practice into 1971 with a scan of a cysticfrontal lobe tumor on a patient at Atkinson Morley Hospital in Wimbledon (UnitedKingdom). After this, CT was immediately welcomed by the medical community andhas often been referred to as the most important invention in radiological diagnosis, sincethe discovery of X-rays [1].The first applications of CT in an industrial context is traced back to the first 1980 s, in thefield of non destructive testing, where small number of slices of the object were visuallyinspected. 3D quantitative industrial CT applications appeared in the later 1990s, withsimple volume and distance analysis [2]. Today, thanks to relevant improvements in bothhardware and software, CT has become a powerful and widely used tool among nondestructive techniques, capable of inspecting external and internal structures (withoutdestroying them) in many industrial applications. Development of more and more stableX-ray sources and better detectors led to design of more complex CT system, providingaccurate geometrical information with micrometer accuracy. CT is widely used forgeometrical characterization of test objects, material composition determination, densityvariation inspection etc. In a relative short time, CT is capable to produce a completethree-dimensional model and tolerances of the scanned machined parts can be verified.Because of the growing interest on precision in production engineering and an increasingdemand for quality control and assurance, CT is leading the field of manufacturingand coordinate metrology. With respect to traditional techniques, CT systems have1
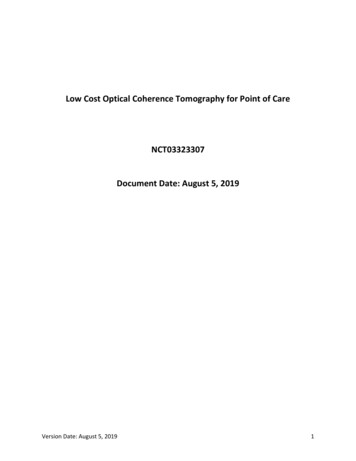
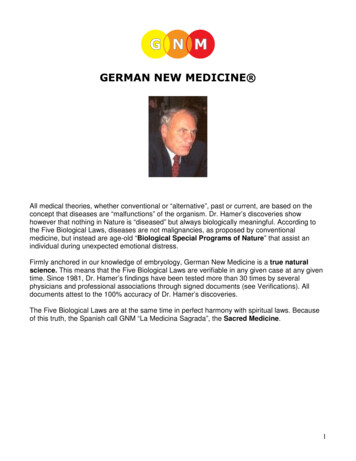
Figure 1.1: A picture of Wilhelm Conrad Röntgen (27 March 1845 – 10 February 1923) (left), andGodfrey Newbold Hounsfield (28 August 1919 – 12 August 2004), (right) [3, 4].Figure 1.2: First CT scanner prototype developed by Hounsfield [5].indisputable advantages: internal and external geometry can be acquired withoutdestroying the part, with a density of information much higher than common tactile andoptical coordinate measuring. A key parameter for reliability of the measurement processis the establishment of measuring uncertainty. Since there are many influence parametersin CT, uncertainty contributors in CT and standards dealing with quantification of CThave not been completely established yet. The assessment of the uncertainty budgetbecomes a challenge for all researchers.1.2Structure of the reportThe general purpose of this report is to give a general introduction to computedtomography (CT). This report presents state of the art in CT and discuss preliminaryinvestigations performed by the authors. It is divided into several chapters discussingvarious topics concerning CT. The content of individual chapters is briefly described inthe following points: From discovery of X-rays to high quality dimensional measurements2
Selected methods of non-destructive testing of materials (Chapter 2) Description of CT technology in general, including the principal of CT, comparisonbetween medical and industrial CT systems, classification of CT systems, theirapplications and advantages and disadvantages (Chapter 3) Description of influence factors in CT, state of the art, theoretical analysis andpreliminary experimentation on some influence factors performed by the authors(Chapter 4)3
4
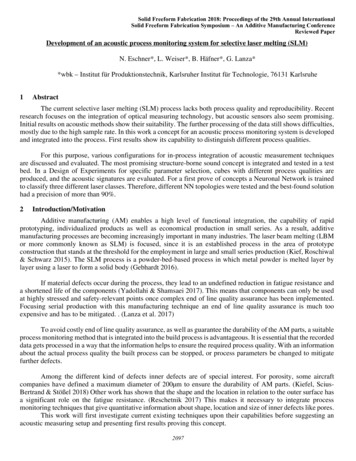
Chapter 2Non-destructive testingIndustrial CT is referred to so-called NDT technologies. ”Non-destructive testing”collects all methods and techniques for product quality assurance and inspection withoutdestroying the part under investigation. The goal of these methods is to analyzethe integrity of a material, component or structure and quantitatively measure somecharacteristics of the product in many different industrial applications. Due to two mainadvantages with respect to destructive methods (being less expensive and less timeconsuming) they are widely applied methods in the industrial environment.Besides CT, there are different inspection methods used for specific tasks. In thefollowing, some of them will be briefly presented. CT will be treated widely in thefollowing chapters.2.1Magnetic part inspectionThis method is used to detect surface (or close to surface) defects, mainly in ferromagneticmaterials like steel and iron. The basic principle is shown in Figure 2.1. A magnetic fluxis generated in the part under analysis. If there is a defect, like a crack, the magnetic fluxwill leak and the crack edge will work as a magnetic attractive pole. So by applying forexample particles of iron, they will be attracted toward the defect, indicating it. Mainadvantage and disadvantages are reported in Table 2.1.Table 2.1: Advantages and disadvantages of magnetic part inspection [6].AdvantagesDisadvantages Simplicity of operation Only for ferromagnetic materials Quantitative Only for surface-near surface defects Can be automated Impossibility to characterize depth and orientation ofdefects5
Figure 2.1: Principle of magnetic particle inspection [6].Table 2.2: Advantages and disadvantages of magnetic part inspection [6].AdvantagesDisadvantages Simplicity of operation Only for ferromagnetic materials Quantitative Only for surface-near surface defects Can be automated Impossibility to characterize depth and orientation ofdefects6
2.2Eddy current testingThe eddy current testing is used to detect little cracks and defects on or near-surface ofthe material and to measure coating thickness in an electrically conducting material (suchas stainless steel, aluminum).The method exploits the principle of the electromagnetic induction: eddy currents areproduced in any electrically conducting material that is subjected to an alternatingmagnetic field, generated by a coil. Presence of a discontinuity on the surface (like acrack) of the material causes a change in the coil impedance, which can be measured andcorrelated with the cause of the modification. Coils can also be used in pair to enhancethe signal [6, 7]. Figure 2.3 shows a picture of a crack in a stainless steel disc obtained witheddy current. Main advantages and disadvantages of eddy current testing are reportedin Table 2.3.Figure 2.2: Principle of eddy current. Coil with single winding (left), and coil with two windings (right)[6].Table 2.3: Advantages and disadvantages of eddy current testing [6, 7].AdvantagesDisadvantages Suitable for determining a wide range Only for electrically conductingof condition of the material (presence(metallic) materialsof defects, composition, hardness, Maximum inspectable thicknessconductivity, etc.)is approx. 6 mm Information can be provide in a simple Inspection of ferromagnetic materialswayis difficult using conventional eddy High inspection speeds possiblecurrent tests Extremely compact and portable unit Operator skilled requiredare available Use of calibration standards necessary Suitable for hugh automation7
Figure 2.3: Grey level image of a fatigue crack of a stainless steel disc obtained with eddy current [7].2.3Ultrasonic testingThis method is used to detect defects at the surface and internal (in depth) to soundconducting materials. There are two methods of receiving the ultrasound waveform,”pulse echo” and ”through transmission”. In pulse echo systems, a short pulse ofultrasound is generated by the transducer (usually a piezo electric crystal) and sent intothe material. The energy passes into the material, reflects from the back surface, and isdetected by the same transducer, yielding a signal on an oscilloscope with a time base.The transducer performs both the sending and the receiving of the pulsed waves fromand back to the device. Reflected ultrasounds come from an interface, such as the backwall of the object or from an imperfection within the object. The oscilloscope normallyshows the original pulse of the ultrasonic transducer (front surface echo), the backreflection and any extra blip indicating a reflection from a defect in the material. Fromthe oscilloscope timing, the depth of the defect below the surface can be determined. Inthrough-transmission systems, a transmitter and receiver unit are separate and placed atopposite sides of the test object. Imperfections or other conditions in the space betweenthe transmitter and receiver are sensed as a reduction of intensity of ultrasonic energy bythe receiving unit, thus revealing their presence [7]. Ultrasonic testing can also be used todetect defects that are not plane oriented but with an angle with respect of the test surface.Figure 2.4 shows an example of defect detection in steel part using a normal probe (left)and an example of detection of angled defect in weld inspection using an angle probe.Main advantages and disadvantages of this technology are listed in Table 2.4.8
Figure 2.4: Example of defect detection through ultrasonic testing, using a normal probe (left) and anangle probe for detection of imperfections with an angle with respect to the test surface (right) [6].Table 2.4: Advantages and disadvantages of ultrasound testing [6].AdvantagesDisadvantages Thickness and length up to 9 m can be tested Indication requires interpretation Extremely sensitive Difficulties with very thin surfaces Capable of being fully automated Skills required to gain the fullest No consumableinformation from the test Limited resolution2.4Optical non-destructive testingOptical NDT collects all methods that works by illuminating the object surface with lightand examining the reflected light patterns using visualization systems. These methodsare widely applied in surface analysis for the detection and study of crack propagation,study of corrosion and deformation analysis and are regarded as the most effectiveand least expensive among the NDT techniques [7]. Different systems can be foundbut two of the most used are holographic interferometry and electronic speckle patterninterferometry.2.4.1Holographic interferometryHolographic interferometry is used to measure ”displacements” (such as it occursdealing with stress, strain, vibrations) and for other NDT applications (defects analysis,imperfections analysis, residual stress, etc.). The technique works on the basis ofholography (see Figure 2.5): the light coming from a laser (coherent light source) is splitin two beams: one of it illuminates the object under testing and the other one is usedas a reference. At the recording site, from the interference path originated between thelight reflected by the object and the reference beam it is possible to reconstruct the 3Dpicture of the object. In holographic interferometry, the system records the two completewave patterns coming from the objects in its original position (taken as a reference)and in deformed states [8]. The combination of these two wave patterns originates an9
interference fringe pattern, called interferogram, related to the movement that has takenplace. The contours of equal displacement are mapped by the fringes with approximatelyone-half the wavelength of the light source [9]. An example is showed in Figure 2.6.Figure 2.5: Principle of optical holography [10].Figure 2.6: Double exposure hologram of a stressed flat metal plate [11, 12].2.4.2Electronic speckle pattern interferometryElectronic speckle pattern interferometry is based on the ”speckle phenomenon”. It isa random intensity pattern produced by the interference between the light rays (froma coherent source as a laser beam) as they are scattered by different points on a rough10
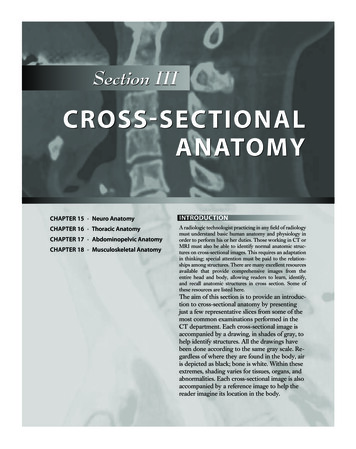
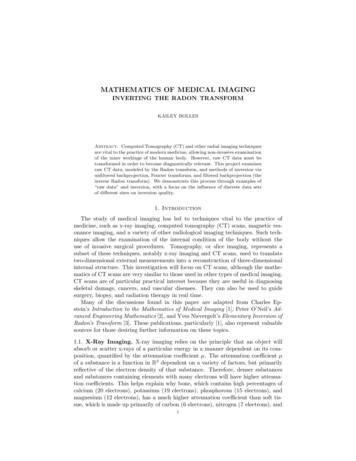
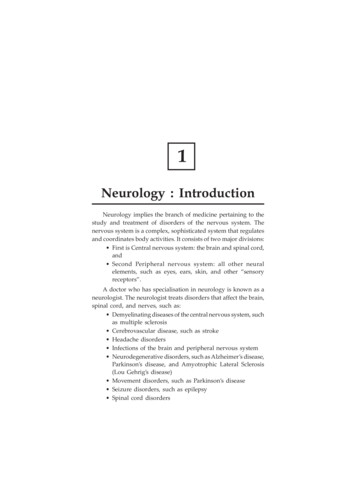
surface. The visual result is a grainy image of the illuminated surface. Electronicspeckle pattern interferometry produces an output similar to holographic interferometry:a fringe pattern is generated from the interference between the speckle pattern formedby the illuminated surface of the object to be tested and a reference wave. This fringepattern is stored as an image and when the object is deformed or moved, the resultantspeckle pattern changes, due to the change in path difference between the wavefrontfrom the surface and the reference wave. This second speckle pattern is transferred to thecomputer and subtracted from, or added to, the previously stored pattern. The resultinginterferogram is then displayed as a pattern of dark and bright fringes, called correlationfringes, as the fringes are produced by correlating the intensities of the resultant specklepatterns taken before and after displacement [9]. Two example are shown in Figure 2.7.Figure 2.7: Longitudinal crack in a steel welding (left); Delamination in a plate (right) [8].Main advantages and disadvantages of optical NDT testing in general are reported inTable 2.5.Table 2.5: Advantages and disadvantages of optical testing [13–15].AdvantagesDisadvantages Non contact measurement Indication sometimes requires interpretation High resolution Special safety regulations for laser operation Full-field information Components have to be loaded to see results No consumable Can be applied only for surface or through surface Real-time measurementsopeningFigure 2.8 shows the classification of chosen NDT techniques (including CT) accordingto their penetration depth and their spatial resolution. From this table it is possibile toassess efficacy of the method in material defect detection. Optical interferometry achievesthe highest resolution but they can basically monitor surfaces or coatings. In contrast,the best penetration depth combined with a high resolution is usually gained by X-rayCT [16]. Similar conclusions can be drawn from Figure 2.9, where above techniques areclassified on the basis of geometrical complexity for dimensional measurements. Here,the emphasis is on the measurement of geometrical parameters, e.g. the geometry ofcomponents as compared to constructed (CAD) data [16]. Among NDT methods, CThas the best performances in terms of penetration depth and resolution and this explainsmany applications of CT in NDT field, as it will be shown in chapter 3.11
Figure 2.8: Classification and comparison of chosen NDT techniques and optical measurement techniquesaccording to detectable defect location and spatial resolution [16].Figure 2.9:Classification of chosen NDT techniques according to geometrical complexity andresolution [16].12
Chapter 3CT technologyCT is a powerful tool capable of inspecting external and internal structures in manyindustrial applications as well as providing accurate geometrical information with veryhigh accuracy. This chapter describes principle of CT, pointing out the main differencebetween medical and industrial CT scanners, classification of CT systems, applicationsof CT as a tool used in industry as well as a powerful tool used in coordinate metrology.Lastly, advantages and disadvantages of the use of CT are presented.3.1CT principleA CT system consists of an X-ray source‚ a rotary table, an X-ray detector and a dataprocessing unit for computation, visualization and data anlysis of measurement results(see Figure 3.1).Figure 3.1: Industrial cone beam CT scanner [GE Phoenix X-ray Nanotom].In principle, CT creates cross section images by projecting a beam of emitted photonsthrough one plane of an object from defined angle positions performing one revolution.As the X-rays (emitted photons) pass through the object‚ some of them are absorbed‚some are scattered‚ and some are transmitted. The process of X-ray intensity reduction,13
involving just those X-rays which are scattered or absorbed, is called attenuation. Xrays which are attenuated due to the interactions with the object do not reach the Xray detector. Photons transmitted through the object at each angle are collected on thedectector and visualized by computer, creating a complete reconstruction of the scannedobject. The 3D gray value data structure gained in this way represents the electrondensity distribution in the measured object [17].A process chain, that is the way a measurement result is obtained, including four differentmeasuring tasks are described in a draft of a German guideline VDI/VDE 2630 part1.2 [18]. A general process chain is presented in Figure 3.2 and described as follows:1. Firstly, the acquisition (scanning) of an object is performed. Several parametershave to be set prior to scanning, e.g. magnification, orientation of the object, energyof the X-ray source, detector integration time etc.2. After scanning and obtaining a set of 2D projections, the volume is reconstructed.The volume is modeled as a 3D matrix of voxels (abbreviation for volumetricpixels), where each voxel value represents the corresponding local attenuationcoefficient of the scanned object. In other words, to each voxel a gray value isassigned representing a local X-ray absorption density. Here, some correctiontechniques can be applied on the 2D projections in order to minimize the effect ofscattered radiation and beam hardening (more about influence factors is mentionedin Chapter 4).3. Then, the threshold value has to be carefully determined as it is a critical parameterfor accurate image segmentation and surface data determination, thus has agreat influence on the final geometry [19] (more about threshold is discussed inSection 4.2.2).4. After a threshold value is determined, either the surface data or volume dataare generated. Surface data are generated in the STL format, characterized by apolygonal mesh in the shape of triangles, on the surface.5. Then, direct dimensional measurement (e.g. fitting of geometrical primitives, wallthickness analysis, nominal/actual comparison) can be performed on either of theearlier mentioned data sets (volume / surface).6. Finally, a measurement result is obtained.There are two main CT systems which can be found in industry. These are: (1) 2D-CT (seeFigure 3.3(a)), and (2) 3D-CT (see Figure 3.3(b)). 2D-CT systems have a fan beam sourceand a line detector which enable the acquisition of a slice of a 3D object by coupling atranslation and rotation movement of the object. This sequence of rotation and translationis repeated depending on number of slices which have to be reconstructed. The maindrawback of these systems is the long scanning times (especially when working with bigparts). This problem is overcome by 3D-CT systems. The system consists of a flat areadetector and a cone beam source, enabling the acquisition of a slide of the object just withone revolution of the rotary table. No linear translation of the rotary table is needed. Thissolution allows significant improvement in acquisition time but, on the other hand, otherproblems arise due to the cone beam source. Scattered radiations and reconstruction14
Figure 3.2: Process chain for CT measurement.artefacts at the top and bottom of the geometry can affect the quality of the reconstructedgeometry. In particular, scanning quality deteriorates from the center to the borders ofthe detector, because of geometrical reasons [20]. An example is shown in Figure 3.4,where it can be seen that more noise is present at the border of the scanned sample.The most recent evolution of 3D-CT is represented by systems exploiting a helical scangeometry, where rotation of the object is simultaneously performed with a translationalmovement along the rotation axis [20, 21], see Figure 3.5. The advantages of this solutionare two. In first instance, there are no restrictions on the sample length (along the rotationaxis direction); the helical trajectory can be prolonged for object bigger than detectordimension and theoretically object of unlimited length can be reconstructed. In secondinstance, with an appropriate shift of the part, a bigger number of slices of the object willbe projected in the middle part of the detector, leading to a more complete acquisition,and so to a constant resolution along the rotation axis. In this way also top and bottomareas will be scanned with the same resolution as the central one. An example is shown inFigure 3.6, where a pen scanned using both a typical CT scanner and a helical CT scanner.While in the first case resolution at the bottom part is not easy to distinguish single ribs,the helical CT enables to scan the whole geometry (top, central and bottom part of theobject) with the same quality [20].15
(a) 2D-CT using line detector.(b) 3D-CT with flat panel detector.Figure 3.3: CT scanner principal [Source: Phoenix X-ray].Figure 3.4: Scanning of a replica step gauge: artefacts in cone beam CT.3.2Medical vs. Industrial CT systemsIt is known that CT scanners were first used for medical purposes. The main differencein the setup of industrial and medical CT systems is that in the case of industrial CT, theobject rotates on a rotary table and the X-ray source is steady, whereas in medical CT,the X-ray sources rotate and the object (a human body in the most cases) is lying on atable/bed which is steady. Schematic principal and example of medical and industrial16
Figure 3.5: Helical CT geometry [20].Figure 3.6: Comparison between a scan obtained with a cone beam CT and helical CT of a pen [20].CT scanners is shown in Figure 3.7. Other important comparisons of the two types ofscanners embody in: Material type (tissue, blood and bone for medical and polymers, wood, concrete,ceramics, metals and composites for industrial CT scanners) Applied energy ( 200 KeV for medical and up to 15 MeV for industrial CT scanners) Achieved resolution of the system (1-2 mm for human subjects in medical and 0.5mm (macro CT systems) and 10 20 µm (micro CT systems) for industrial CTsystems)17
(a) Principal of a medical CT [22].(b) Example of a medical CT [23].(c) Principal of an industrial CT [22].(d) Example of an industrial CT [GEPhoenix X-ray].Figure 3.7: An example of medical and industrial CT scanners.5 generations of medical CT scan geometriesFigure 3.8 illustrates classification of medical CT scanners. The classification, dependingon the scanner geometry, is divided into five generations.First-generationFirst-generation CT systems are characterized by a single X-ray source (pencil beam)directing across the object and a single detector. Both, the source and the detector,translate simultaneously in a scan plane. This process is repeated for a given numberof angular rotations. The advantages of this design are simplicity, good view-to-viewdetector matching, flexibility in the choice of scan parameters (such as resolution andcontrast), and ability to accommodate a wide range of different object sizes. Thedisadvantage is longer scanning times.Second-generationSecond-generation CT systems use the same translate/rotate scan geometry as the firstgeneration. The difference here is that a pencil beam is replaced by a fan beam and asingle detector by multiple detectors so that a series of views can be acquired duringeach translation, which leads to correspondingly shorter scanning times. So, objects ofwide range sizes can be easily scanned with the second-generation scanners.18
Third-generationThird-generation CT systems normally use a rotate-only scan geometry, with a completeview being collected by the detector array during each sampling interval. Typically, thirdgeneration systems are faster than second-generation systems. The detectors here haveincorporated bigger amount of sensors in the detector array.Fourth-generatio
in CT, uncertainty contributors in CT and standards dealing with quantification of CT have not been completely established yet. The assessment of the uncertainty budget becomes a challenge for all researchers. 1.2 Structure of the report The general purpose of this report is to give a general introduction to computed tomography (CT).Cited by: 67Publish Year: 2011Author: