Transcription
Solid Freeform Fabrication 2018: Proceedings of the 29th Annual InternationalSolid Freeform Fabrication Symposium – An Additive Manufacturing ConferenceReviewed PaperDevelopment of an acoustic process monitoring system for selective laser melting (SLM)N. Eschner*, L. Weiser*, B. Häfner*, G. Lanza**wbk – Institut für Produktionstechnik, Karlsruher Institut für Technologie, 76131 Karlsruhe1AbstractThe current selective laser melting (SLM) process lacks both process quality and reproducibility. Recentresearch focuses on the integration of optical measuring technology, but acoustic sensors also seem promising.Initial results on acoustic methods show their suitability. The further processing of the data still shows difficulties,mostly due to the high sample rate. In this work a concept for an acoustic process monitoring system is developedand integrated into the process. First results show its capability to distinguish different process qualities.For this purpose, various configurations for in-process integration of acoustic measurement techniquesare discussed and evaluated. The most promising structure-borne sound concept is integrated and tested in a testbed. In a Design of Experiments for specific parameter selection, cubes with different process qualities areproduced, and the acoustic signatures are evaluated. For a first prove of concepts a Neuronal Network is trainedto classify three different laser classes. Therefore, different NN topologies were tested and the best-found solutionhad a precision of more than 90%.2Introduction/MotivationAdditive manufacturing (AM) enables a high level of functional integration, the capability of rapidprototyping, individualized products as well as economical production in small series. As a result, additivemanufacturing processes are becoming increasingly important in many industries. The laser beam melting (LBMor more commonly known as SLM) is focused, since it is an established process in the area of prototypeconstruction that stands at the threshold for the employment in large and small series production (Kief, Roschiwal& Schwarz 2015). The SLM process is a powder-bed-based process in which metal powder is melted layer bylayer using a laser to form a solid body (Gebhardt 2016).If material defects occur during the process, they lead to an undefined reduction in fatigue resistance anda shortened life of the components (Yadollahi & Shamsaei 2017). This means that components can only be usedat highly stressed and safety-relevant points once complex end of line quality assurance has been implemented.Focusing serial production with this manufacturing technique an end of line quality assurance is much tooexpensive and has to be mitigated. . (Lanza et al. 2017)To avoid costly end of line quality assurance, as well as guarantee the durability of the AM parts, a suitableprocess monitoring method that is integrated into the build process is advantageous. It is essential that the recordeddata gets processed in a way that the information helps to ensure the required process quality. With an informationabout the actual process quality the built process can be stopped, or process parameters be changed to mitigatefurther defects.Among the different kind of defects inner defects are of special interest. For porosity, some aircraftcompanies have defined a maximum diameter of 200µm to ensure the durability of AM parts. (Kiefel, SciusBertrand & Stößel 2018) Other work has shown that the shape and the location in relation to the outer surface hasa significant role on the fatigue resistance. (Reschetnik 2017) This makes it necessary to integrate processmonitoring techniques that give quantitative information about shape, location and size of inner defects like pores.This work will first investigate current existing techniques upon their capabilities before suggesting anacoustic measuring setup and presenting first results proving this concept.2097
3State of the artIn this section a short review of SLM defect characteristics will be given and existing process monitoringtechniques are discussed. Furthermore, the approaches to visualize the results of this monitoring techniques areintroduced. This is followed by the discussion about systematically introduced defects in reference test bodies forevaluating the capabilities of process monitoring techniques. The last part of this section focuses on the discussionof relevant reference measurement techniques to evaluate location and shape of pores in AM parts.3.1Defects in SLMThere are different characteristic defects in SLM (Everton et al. 2016; Grasso & Colosimo 2017). Poresare of special interest since they are difficult to detect by end of line inspection and have a major influence on thefatigue behaviour (Leuders et al. 2013). To evaluate the influence it is important to know the shape and locationof each pore (Reschetnik 2017), which strongly correlates with its formation mechanism.Too High EnergyKeyhole/VaporizationSpatter(Gong et al. 2014)(Haeckel 2017)Too Low EnergyUnmolten powder(Gong et al. 2014)Table 1: Pores may result from either bringing in too high or too low energy in the process zone (Gong et al. 2014)When bringing in too high energy keyhole phenomena may occur, which result in subsurface pores. Thesekind of pores often have a spherical shape and indicate high concentrations of alloys with low vaporizationtemperature due the high temperature at the bottom of the melt pool, shown in Table 1 (Liu et al. 2016). Anotherphenomenon which is likely to occur from too high energy input is the generation of spatter which results fromthe recoil pressure spattering molten material (Khairallah et al. 2016). This molten material is likely to form aspherical shaped drop somewhere on the powder bed. Even though there are a few other phenomena resulting inpowder bed contamination in the end this powder bed contamination cannot be melted completely and is likelyto trap unmolten powder under it. (Haeckel 2017) The micrograph of such pore resulting from powdercontamination is shown in Table 1-middle. Not only does spatter lead to insufficiently molten powder, if there isa too small overlap in scan strategies or insufficient laser power input, welding lines are only partly connectedlike shown in Table 1 on the right. (Gong et al. 2014; Thijs et al. 2010)By tuning the process parameters, it is possible to mitigate pores resulting from too low or too high energyinput. Despite this, process and melt pool instabilities from powder bed contamination or attenuation of the laserpower from process gases, resulting in discontinuity energy input, can’t be avoided completely. In total there aremore than 50 process parameters influencing the SLM process which have to be considered. (Spears & Gold2016; van Elsen 2007) Only few are correctly user controlled and they have only been partially researched. Thisshows the necessity of process monitoring or process integrated measurement techniques capable of detectingand quantifying pores.3.2Sensors for process monitoringTo detect process discontinuities which may result in pores, different in-situ process monitoringtechniques exist. These are summarized in table 2. They can be divided in optical and acoustic monitoringtechniques. Most of these methods are already known from laser welding. (Purtonen, Kalliosaari & Salminen2014) There are first works also evaluating eddy current testing and backscatter computed tomography. Thesemethods are up to date not yet implemented. (García-Martín, Gómez-Gil & Vázquez-Sánchez 2011)2098
First process monitoring techniques available in industrial application focus on the integration of opticalmeasuring equipment in the beam path (Berumen et al. 2010; Everton et al. 2016). By integrating cameras anddiodes/pyrometers into the optical path it is possible to quantify melt pool size, shape and radiation from the meltpool (Clijsters et al. 2014; Furumoto et al. 2013). With this information it is possible to realize a closed-loopcontrol to reduce the occurrence of too high energy input and thereby the number of produced pores can bereduced. Further work also showed a correlation of position data of the laser with data from the melt poolmonitoring, resulting in maps for each layer which help the operator to identify process variation, but cannot givea quantitative feedback about occurred defects and part quality. (Grasso & Colosimo 2017)A more complex on-axial measurement technique is the optical coherence tomography, where a secondlaser system is integrated in the beam path (Neef et al. 2014). It might even be upgraded with a separategalvanometer-system scanning the melt pool (Kanko, Sibley & Fraser 2016). This technique achieves a new levelof information, making it possible to evaluate further melt pool properties like keyhole depth and the geometricalprofile of the melt pool.The integration of Off-Axial sensors have the scope to monitor powder bed properties or scan path/scansurface (Grasso & Colosimo 2017). For observing the scan path or scan surface, pyrometers (Doubenskaia, Pavlov& Chivel 2010; Islam et al. 2013) or IR Cameras (Krauss, Eschey & Zaeh 2012) can be integrated. For observingthe powder bed, cameras (Zur Jacobsmühlen et al. 2015) or laser line scanners (Haeckel 2017) can be used. Forscientific purposes and to understand the process as well as melt pool dynamics, a high speed camera close to theprocess zone was integrated. (Ly et al. 2017)Besides the above discussed optical monitoring methods mentioned, there are novel works elaboratingfurther non-destructive testing techniques. Existing works an all four different kinds of non-destructive testingmethods are summarized in Table 2.There are first works on Eddy Current Testing integrated in the process, which right now is related with ahigh effort scanning the surface and thereby slows down the process. (García-Martín, Gómez-Gil & VázquezSánchez 2011)Rieder integrated an ultrasonic transducer under the build platform which can detect porosity by pulsereflection method. In this case an ultrasonic wave is generated by the transducer and the reflected wave from thebackwall or defects is analysed. (Rieder et al. 2016) For this active acoustic approach an acoustic signal must begenerated. The spatially resolved acoustics emissions approach, introduced by (Smith et al. 2016) works in asimilar way. Surface acoustic waves are generated with a laser and the propagation is evaluated by measuring thesurface acoustic wave at a second point. (Ye et al. 2018) introduced a passive acoustic approach measuring theairborne acoustic signature. Due to plasma generation it is possible to evaluate process discontinuity and detectoverheating and balling.Beside of these monitoring techniques first concepts are available for integrating an X-Ray into theprocess. This approach promises a high degree of information about inner defect. (Shedlock, Edwards & Toh2011)OpticalOff-AxisEddy CurrentOn-AxisAcousticActive2099CTPassive
High-speed camera Camera diode(Ly et al. 2017)(Berumen et al.2010; ClijstersIR camera (Krauss, et al. 2014;Furumoto et al.Eschey & Zaeh2013)2012)PyrometerHigh-speed( Camera) (Islam et Camera (Lott etal. 2013;al. 2011)Doubenskaia,Pavlov & Chivel2010)Camera (Pulverbett) OCT (Neef et al.(Zur Jacobsmühlen 2014; Kanko,et al. 2015)Sibley & Fraser2016)Laser line scanner(Haeckel 2017)(García-Martín,Gómez-Gil &VázquezSánchez 2011)Ultra soundemissions-reflexion(Rieder et al. 2016)Spatially resolvedacoustic emission(Hirsch et al. 2017;Smith et al. 2016)Air borne acousticemissions (Ye etal. 2018;Shevchik et al.2018)X-raybackscatter(Shedlock,Edwards &Toh 2011)Table 2: Literature overview on process monitoring systems for the SLM process3.3Data evaluation of process monitoringThe monitoring techniques described above are in the development phase and have different scopes ofapplication. Not all of them will be used in productive SLM systems in the future. As soon as a technology comesout of the development phase, during which process engineers operate the machine, it is necessary to get intuitiveand clear feedback about the process quality. For this purpose, visualization techniques are used to showdeviations in a 2D or 3D image like shown in ((Krauss 2016)). Figure 1 shows areas marked in red, in which highIR radiation from the melt pool is observed. This is an indicator for too high energy input and therefore likely tocause defects. (Krauss 2016) This kind of visualizations require interpretation by an expert and may be improvedby automated pattern recognition algorithms. (Zenzinger et al. 2014)Besides visualizing process deviations, a classification directly from raw signals is possible. Aclassification approach using machine learning algorithms for five classes was shown by (Ye et al. 2018), whowere able to distinguish balling (a), light balling (b), good process (c), light overheating (d) and overheating (e)like shown in figure 2 by using the air borne acoustic raw signal. This classification of defects in combinationwith giving an indicator of the severity makes it easier for machine operators or automatized control systems totake the right actions or even precautions to prevent further defects in the process.Figure 1: Data evaluation of a process monitoring technique (Krauss2016)3.4Figure 2: Distinguishing of classes: balling (a), light balling (b), goodprocess (c), light overheating (d) and overheating (e) (Ye et al. 2018)Reference bodiesThe systematic introduction of defects or process characteristics in reference bodies is a common approachto evaluate the performance of process monitoring techniques. The most simple way to do this, is the creation of2100
single welding tracks like (Ye et al. 2018). This is especially advantageous since no complex measurementtechnique is needed to evaluate the properties of the welding tracks.More complex three dimensional reference bodies are used by (Rieder et al. 2016) or (Toeppel et al. 2016).To systematically introduce defects different parameters are used. They range from parameters correlatingdirectly with the energy input (layer thickness, laser power, scan speed, hatching distance) to inert gas flow orpowder bed contamination. Table 3 gives an overview over considered defects and the used process parameters.Beside of these used process parameters there are much more process parameters which affect process qualityand are not yet used for evaluating process monitoring techniques since they are difficult to vary. (Krauss 2016;Spears & Gold 2016)Research approach(Rieder et al. 2016)(Toeppel et al. 2016)Considered parameterDensityPores/density(Ye et al. 2018)(Haeckel 2017)(Zenzinger et al. 2014)(Krauss, Eschey & Zaeh 2012)Balling/overheatingPoresPoresPoreChanged process parameterLaser powerLaserpower,hatchdistance,geometry, scanner time delayLaser powerPowder bed contaminationInert gas FlowLaser PowerTable 3: Overview of considered defects and varied process parameters3.5Reference measurement techniqueIf reference bodies are produced it is essential for qualifying the measurement technique to have areference to measure the introduced defects. To get information about the inner defects like pores differentmeasurement techniques are suitable, each having its own advantages. In total, three different types are worth tobe considered: Archimedes density measurement, micrographs and computer tomography (CT) (Spierings,Schneider & Eggenberger 2011)Density measurements according to Archimedes have the lowest degree of information since it only givesa number of the overall density but no information about the location or particular shape of pores. Beside of this,the reproducibility and standard deviation of Archimedes measurement is the best of the three mentionedmeasurement techniques. (Spierings, Schneider & Eggenberger 2011)Micrographs give the opportunity to evaluate the shape of pores and the location in the cross-section. Thisgives more information about pore properties than Archimedes measurement. By using microscopes, the usableresolution of this approach goes down to a few micrometres. Unfortunately the process of making micrographswith grinding, polishing and the parameters for taking pictures to evaluate the pores are hard to reproduce.(Spierings, Schneider & Eggenberger 2011)The highest amount of data about the reference body can be generated by using a CT. With CT it ispossible to evaluate size and shape of the pores according to BDG P202 (BDG 2010) over the whole volume ofthe test body. Major drawback of this technique is its measurement uncertainty and its undefined limit for smallpores. Depending on the used parameter for the image acquisition the resolution of the CT image changes. (Schildet al. 2018)2101
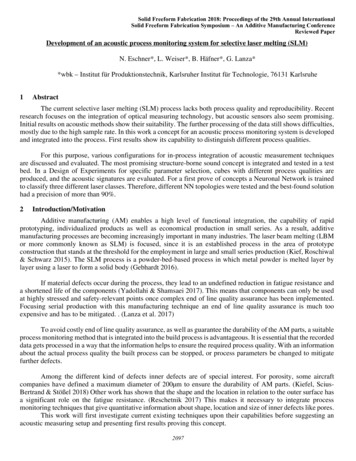
4Methodical approachIn this section the overall approach for developing an acoustic monitoring system will be explaind.Therefor first of all the reasons for investigating an acoustic measurement setup will be explained before itsintegration into a test bench will be shown. In section 4.2 de design of the chosen reference bodies and the chosendefect mechanisms are introduced. Section 4.3 focuses on the data processing of the acoustic signal and thecorrelation of the features generated from the reference measurement.4.14.1.1Sensor and test setupSelection of measurement techniqueFigure 3 summarizes the capabilities of the different non-destructive testing (NDT) methods in generaland compares their abilities in resolution and defect position (inside or surface) in a qualitative way. Since eddycurrent testing is only capable of detecting defects close to surface all techniques above the red line can detectdefect inside a volume. The ones below the red line can detect surface or close to surface defects.Figure 3: Comparison of NDT methods in resolution and defect positioning according to Gevatter & Grünhaupt 2006)Section 3.1 showed that the formation mechanism of SLM characteristic pores only partly understood andthere are works indicating the pore formation taking place without being visible at the surface (Calta et al. 2018).Nevertheless, pores are volume defects which makes it necessary to have a closer look on the testing methodswhich are in general capable of evaluating defects within the volume.X-ray backscatter tomography, which is a special method of the computed tomography (CT), is part offurther research and not yet integrated in the process. The process integration of CT was already shown for FDMand is also plausible for SLM. Regarding the high integration effort and investment cost, this is likely to be limitedfor research and special applications. Since the integration of acoustic sensors is much less complex (as shown in(Rieder et al. 2016; Ye et al. 2018)), it is promising to have a closer look on this kind of measuring principle.4.1.2Integration concepts of acoustic measurement systemsThe generation and detection of acoustic signals in general can be performed by three different kind ofactors/sensors: piezo, electromagnetic transducer (EMAT) or by the laser itself. Furthermore, acoustic waves canbe air borne or structure born. This work will focus on structure born noise due to its expected higher degree ofinformation.With regard to the integration of the actor and the sensors, there are two general placements, which areschematically sketched in figure 5 as variants A and B. In variant B, the probe is mounted in the available spacebetween the construction platform and the substrate plate. Such a construction has already been implemented andtested (Rieder et al. 2016). Variant A provides space for the sensor to be positioned above the workpiece or2102
integration into the beam. The installation space above the workpiece is limited by the fact that the beam path ofthe laser must not be disturbed. Nevertheless, this variant offers advantages in terms of component coverage.Figure 4: Integration and signal generation/detection options for SLM process monitoringWith th
monitoring, resulting in maps for each layer which help the operato r to identify process variation, but cannot give a quantitative feedback about occurred defects and part quality. (Grasso & Colosimo 2017) A more complex onaxial - measurement technique is the optical coherence tomography, where a second