Transcription
International Journal of Computer Information Systems and Industrial Management Applications.ISSN 2150-7988 Volume 13 (2021) pp. 222-232 MIR Labs, www.mirlabs.net/ijcisim/index.htmlReceived: 18 September, 2020; Accepted: 10 June, 2021; Published: 12 August, 2021Machine Learning Approach of Semantic Mappingin Polystore Health Information SystemsNidhi Gupta1 and Bharat Gupta212Department of Computer Science and Engineering, Jaypee Institute of Information Technology,A 10, Industrial Area, Sector 62, Noida, Uttar Pradesh 201309nidhi.gupta.it@ipec.org.inDepartment of Computer Science and Information Technology, Jaypee Institute of Information Technology,A 10, Industrial Area, Sector 62, Noida, Uttar Pradesh 201309bharat.gupta@jiit.ac.inAbstract: Health analysis and Information system use patientdata from ubiquitous data sources for decision making. Limitedadoption of health standards results in difficult data exchangeand its reuse. The data integration from Polystore databasesexperience schema level conflict, which limits its sharing andreuse among other health organizations. The research workproposed an approach called Semantic Mapping of ObservationData for interoperability of Polystore Electronic Health recorddata sources. The proposed approach resolves schema levelconflicts that occur while integrating patient EHR from multipleheterogenous data sources. The research work demonstratesSMOD on Blood Pressure data from standardized,non-standardized and streaming data sources. Its performance isaccessed on widely used multiclass algorithms such as SupportVector Machine, K-Nearest Neighbor, Naive Bayes, LogisticRegression and Neural network. Results shows highest accuracywith Linear SVM in comparison with other classificationalgorithms. However, K-Nearest Neighbor and Naive Bayesperformance is nearly close to SVM. The result is validated onBlood Pressure data taken from datasets of 3 different diseasessuch as Heart, Kidney and Diabetes. The validation resultsdemonstrate that Naïve Bayes algorithm is used as bestgeneralized algorithm in SMOD and is able to predict accuratemapping with other Blood Pressure datasets of different diseases.Keywords: Machine Learning, Polystore, Semantic Mapping,Integration, Blood Pressure.I. IntroductionIn the era of development of modern tools and advancedcommunication technology, high volume of patient health datais generated and stored in various data formats such as CSV,JSON, RDB etc. The variety of data stored at distributed datasources is referred to as ‘Polystore’ databases. Healthstandards are developed to ensure uniformity in storing,accessing, communicating the Electronic Health Record (EHR)such as HL7, OpenEHR, supporting standard vocabulary suchas SNOMED, LOINC, ICD, etc. [1]. Insufficient adoption ofstandardized methods of data storage and retrieval results inlimited sharing of EHR and prolong delay in patient monitoring.Health systems uses various methods and technologies formonitoring patient health and requires integration of static dataand dynamic data streams for efficient clinical diagnosis andhealth decision making[2]. Some companies such as Amazon,Google have also initiated to provide the models for predictingheath data by maintaining patient EHR. Thus, there is a need ofdata integration from autonomous data sources in distributedheterogeneous environment.In healthcare, many applications such as disease diagnosis,remote health monitoring, requires to integrate data frommultiple health providers. The patient Electronic HealthRecords (EHR) is distributed at multiple health providers.Each database stores the data with its own local attributenames. Thus, integration of such data from multiple databasesresults in naming conflicts. The research carried out proposed amachine learning model called Semantic Mapping ofObservation Data (SMOD) to resolve schema level namingconflicts occur during integration of EHR from Polystoredatabases. The research work carried out enables semanticintegration of Patient’s Blood Pressure (BP) records fromdifferent data sources.The work is organized into various sections. Section 2presents the background and motivating scenario of ourresearch problem. Section 3 reviews the related work onsemantic mapping for data integration. Section 4 discuss aboutwidely used multiclass classifiers. Section 5 describes theproposed approach used for semantic mapping. Section 6shows the experimental evaluation of proposed approach andvalidation of its results. Section 7 concludes the research work.II. Background and MotivationData mapping facilitates retrieval, integration andinteroperability. This section presents the significance of datamapping in data integration and also presents the motivationscenario behind the integration. Data integration is the processof combining the data from various data sources to provide asingle uniform data view. With the increase in volume andMIR Labs, USA
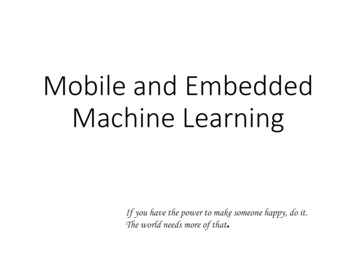
Machine Learning Approach of Semantic Mapping in Polystore Health Information Systemsvariety of data, manual data integration is not possible. Manydata integration and transformation tools are developed toautomate the process of data integration. It automates varioustasks for better understanding of semantics of data such asentity resolution, data fusion, data extraction. Entity resolutionrefers to the identification of all existence of an entity acrossmultiple data sources. Data fusion refers to merging of recordsby resolving data level conflicts from multiple sources to makethe data more useful, Data extraction refers to the mining ofstructured data from semi-structured data sources such as webpages, social media etc.Data mapping deals with matching of attributes belongs tothe same entity in multiple databases. It is required whenorganizations do not store the data in a standardized format.Data integration process has also utilized various supervisedand unsupervised machine learning algorithms such as neuralnetworks, logistic regression etc. for implementing dataintegration tasks. Machine learning algorithms automates theprocess of data mapping and gives precise results.The motivation behind our clinical data integration is toprovide usability and accessibility of patient’s clinical history ofBP measurements, from multiple health providers.Physiological health measures such as body temperature, heartrate, Blood Pressure (BP), etc. are the integral part of anydiagnosis. High blood pressure is one of the major causes ofHypertension and Cardiovascular problems among patients. Itis a root cause of many deadly diseases and may results in alife-threatening body state such as heart attack, stroke,disorders of pregnancy, cognitive decline, thyroid and chronickidney disease. Nearly, half of the adults in United States havehypertension, defined as systolic BP greater or equal to 130mm Hg or a diastolic BP greater than equal to 80 mm Hg[3]. InIndia, hypertension cases are increasing at alarming rate andevery 1 out of 3 people is suffering from it. The symptom ofHypertension is not explicitly visible and is considered as asilent killer. Ambulatory Blood Pressure Monitoring (ABPM)monitors the individual BP during routine work at regularintervals by wearable sensor device. ABPM measurements areanalyzed when patient feels anxiety and nervousness in clinicalsettings. Therefore, Blood Pressure needs to be properlymeasured and analyzed for taking any health decision and isconsidered as one of the prime physiological factors. BPanalysis of a patient requires integration of clinicalmeasurement stored with various health providers.The sequence of steps for query processing in Polystore dataenvironment is shown in figure 1. It has three layers i.e. UserInterface, Middleware and Data storage. The user query forretrieving and integrating the data from distributed dataformats use a common query interface. The middlewareconsists of query processing engine, which scans the query andsearch for the relevant data sources to execute the query. Thequery gets executed at respective data sources and resultsproduced gets merged in response to user query. Each clinicaldata source, stores the local view of its data. A unified dataview requires to map the local data view to its correspondingglobal view. In the research carried out, data view (local andglobal) refers to the attribute labels used to describe the data.The input query at user interface, use standardized global nameto refer each attribute of required data. To understand the223query attributes at each autonomous data source, it is essentialto map the global attributes to their corresponding localattribute.Query ResultsQueryUser InterfaceQuery Processing Engine(Query rewriting, splitting andSource selection)Global mappedattributesMiddlewarePolystore databasesDS-1DS-2-- -----------DS-nFigure 1. High level view of Query Processing inPolystore DatabasesIII. Related workSemantic mapping and integration are essential to aninteroperable system. Much of the work has been done on datamapping for enterprise database integration. E. Rahm et al. [4]and B. Gu et al. [5] worked on database matching levels suchas schema, record, element, instance and structure levels.M. Birgersson et al. [6] automates data mapping of differentXML documents by comparing xPath of different data source.It uses network data flow model to find different words withsame semantic meaning.W.S Li et al. [7] proposed a technique for semanticmatching of equivalent data elements. It uses the metadata andtrains a neural network for data integration.The existing literature also provides solutions for schemaand concept mapping in health data [8]. M. Krol et al. [9]studied the issues of integrating multi-platform medicalsystems and discuss its possible solutions.A. Roehrs et al. [10] introduced a methodology namedOmniPHR (Personal health record) for semanticinteroperability and integration of different health standardusing Natural Language Processing and Machine learning.Y. Yang et al. [11] presented a hybrid cloud calledMedshare for health professionals to access and share medicalinformation securely. X. Yang et al. [12] proposed acost-effective integration solution of healthcare system forinteroperability in distributed health systems.A. Brugues et al. [13] focused on achieving interoperabilitythrough HL7 CDA standard in health systems for managinggestational diabetes mellitus. N. Gupta et al. [14] discussedabout interoperability issues and surveyed about various healthstandard methods. Kumar et al. provides a framework forgeneric Information exchange using HL7 in heterogeneous,autonomous systems for data exchange and interoperability[15].The researchers also worked on mapping of data streams for
224Gupta and Guptaefficiently processing, analyzing, joining and queryingstreaming data. [16] studied the problem of similarity join ofdata streams. It proposed a model based on updating distancemetric of data stream sliding window. S. Benny et al. [17]worked on the problem of entity resolution in streaming data.The similarity score for entity mapping is generated usingHadoop MapReduce framework and is used for matching datastreams.Erhard Rahm et al. [18] compared various existingapproaches for semantic mapping. Table 1 shows thecharacteristics of proposed model SMOD with otherstate-of-the-art semantic mapping approaches such asSEMINT [19], SKAT [20], DIKE [21], Cupid [22] and Clio[23]. SEMINT is a tool used for semantic integration ofheterogenous database. It trains neural network for attributeidentification and matching. SKAT is an articulation tooldesigned for semantic integration of data sources. DIKE is thetool for integration of federated data sources. It proposed analgorithm to form a global dictionary for all possible synonymsfor a unified view of data sources. CUPID is analgorithm designed for schema mapping, independent ofparticular data model. It uses linguistic and structure mappingapproach for data integration. Clio also worked for finding therelationship between data in heterogenous data sources fordata integration and its exchange. It generates the queries forfinding the data mappings in schemas of two heterogenous datasources.The proposed research work, provides data mapping fordata interoperability and its integration with various HealthInformation System (HIS) stored at Polystore databases. Thework carried out comprises of semantic mapping of data fromthree different category of data sources i.e., data instandardized health data format such as HL7, non-standardizeddata sources (local databases) and streaming data. The dataattributes collected is according to the suggestions ofOpenEHR archetype [24].SEMINT[19]SKAT [20]DIKE [21]Cupid [22]Clio [23]SMOD (Proposed)Schema typesrelationalXML, CSV, JSON,Key-value pair sElement/Structure level:attributes/classElement/Structure level: nt/Structure level:attributes/classElement/Structurelevel: attributesMatchcardinality1:11:1, n:11:11:1, n:11:1, n:1, n:m1:1(Data in accordanceto YesYesUse semanticmappingClusteringRule basedLinguisticqueries forUse multiclassusingapproach inandTechniquefinding theclassifiers. Best resultNeuralfirst orderstructuralusedrelationshipwith Naïve BayesNetworklogicsimilaritybetween twoschemas.Table 1. Characteristics of proposed model- SMOD with state-of-the-art schema mapping approachesDeterminerelationshipbetween objectof differententity(is-a)The contribution of the paper is as follows:1. The research work proposed an automated machine learningapproach to resolve the semantic mapping problem. It focuseson resolution of attribute naming conflicts for integration ofdistinct databases.2. The pre-processing step of proposed approach generatestraining dataset with reduced noise. The proposed approachcomputes statistical measures for computing features oftraining data during pre-processing step. Therefore, thestatistical summarization reduces or eliminate the effect ofnoise in the data.3. The work done facilitates mapping on blood pressureattributes taken from static and data streams data sources.IV. Multiclass Classification AlgorithmsA. Support Vector MachineSVM is one of the widely used classification algorithm. Itworks by plotting the training data in n-dimensional space andseparates each class using a decision boundary calledhyperplane. In n-dimensional space, hyperplane is of n-1dimension i.e., in 2-D the hyperplane is a line, in 3-D it is aplane. Therefore, dimensions in hyperplane depends on thenumber of features in training data. Support vectors are the
225data points which are at minimum distance from hyperplane.There are many possible hyperplanes to separate the trainingdata. The algorithm strives to find the optimal hyperplane,where the distance between the support vectors andhyperplane should be maximum. SVM are well known forclassification of high dimensional data i.e., dataset with largenumber of features than its instances. The algorithm can beused to classify both linear and non-linear data with the help ofmathematical function called ‘Kernel’. A kernel tricktransforms the input data into high dimension space. It helps tofind an optimal hyperplane to separate data points of eachtarget classes. The research work carried out uses kernelfunction as ‘linear’ for the classification problem. Thegeneralized representation of kernel function is (1)the best value of K by comparing the accuracy achieved withdistinct k values.C. Naïve BayesNaïve Bayes classification is based on the Bayes theorem withthe assumption of independence of features. Each feature inthe dataset is considered as independent with one another, andhence is termed as ‘Naïve’. It uses the probability to makepredictions on input data instance to the target class. TheBayes theorem is stated as shown in (5)(5)where,where, x and y are input data s.t.is a mapping function for mapping input data to highdimension given inThe value of kernel functionreturns the similarityscore of input data points in n-dimension space.SVM is primarily used for classification on binary classes,but it is also used for multiclass classification using one vs. allapproach. Using this approach, if c is the number of targetclasses, then c binary SVM models are constructed, one foreach class. In general, the new sample xi belongs to those classCj, with largest decision function(y ) value given as in equation(3)IfFor a non linear SVM, the decision function f(x) is given as inequation (4)where,w coefficient vectorsN number of training points coefficient of Lagrange multipliersB. K-Nearest NeighborIn KNN, the class prediction is highly influenced by the mostcommon class of k-nearest training data points. The algorithmgives best results with low dimensional data i.e., dataset with asmaller number of features than instances. For optimalexecution of KNN classification, the research work done foundP(Y) Probability of a classP(X) Probability of a dataP(X/Y) Probability of data, given the class is trueP(Y/X) probability of a class, given the dataThe research work carried out uses Gaussian Naïve Bayesfunction. It is used when xi is a real value and P(xi/yj) exhibit anormal distribution of data as shown in (6)where,xi is the input data and yj is its specified class.andare the mean and variance of each specified class.D. Logistic RegressionLogistic Regression is used for predicting the data withdiscrete target classes. It generally gives best results withbinary classification problems i.e with two classes. However, itcan be used for multiclass classification problems by using ‘onevs. all’ approach. With this approach, the classifier solves amulticlass problem by reducing it to binary classificationproblem. The classifier is trained for ‘one’ class and treat restclasses as ‘other’. Then the same it does the same thing withother classes. For a given input, all the trained classifier getsexecuted and the most confident classifier would be selected astarget class. Logistic regression uses the sigmoid functionwhich ranges between 0 and 1. The sigmoid function map thepredicted value to the probabilities in range of 0 and 1 only.The (7) shows the sigmoid function and the predicted output iscalculated as shown in (8)wherebo, b1 input coefficientsP Predicted outputE.Neural Networks
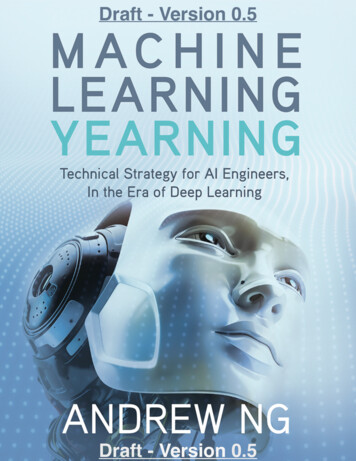
226Gupta and GuptaThe basic element of neural networks is called neurons. It hasone input layer, one output layer and multiple hidden layers.The layers are composed of predefined number of neurons andconnected with neurons of other layers. Each layer receives aninput, performs summation of weights and input data, and by.The networks trained iteratively and with each iteration,weights assigned to each neuron are adjusted to reduce squareerror. Neural network is best used in applications whichrequire learn the complex functions. It is one of the bestclassifiers for high dimensional problems, but requires a largetraining data samples to build the classifier. The proposedwork uses Multi-layer Perceptron Algorithm (MLP) forconstruction of classifier. It trains dataset to learns a function,g() given in (5)where,m number of input dimensionsn number of output dimensionsV. Proposed Approach: Semantic Mapping ofObservation DataThis section presents a supervised machine learning approachused for data mapping of observation data from numerous datasources. The proposed approach first computes the trainingdata. Thereafter, it implements the data mapping usingclassification algorithms.A.Training Data Generation TechniqueA machine learning classification algorithm requires trainingdata to classify each local labelled attribute to itscorresponding global attribute. The training data is generatedbefore the execution of the proposed approach-SMOD.Training data is formed by the collection of observationaldatasets from various data sources. Statistical properties (St)like mean, min, max, quartiles for each attribute (Ai) datavalues, is computed separately, and the attribute labels aremanually mapped to global attributes. The computedproperties and its corresponding attribute name(global) aremaintained in a separate dataset. The dataset formed is used fortraining data with computed statistical properties as featuresand its corresponding attribute label as target class.The Algorithm 1 demonstrate the generation of training data(TA) from various data sources (DS) such that, DS {S1,S2 Sm}and A {A1,A2, Ak} is the set of all attributes in a DS.The steps 3 to 9 in the algorithm generates training data andfinally the model is trained in step 10. ComputeStatistics()function in step 5 is used to compute the statistical propertiesof each attribute as training feature. These properties areminimum value, maximum value, mean value and quartiles ofattribute data values. In step 6, AddTargetLabel() assigns theglobal attribute label of corresponding attribute as target class.The steps 4 to 6 constitute a row in training dataset and in step7, AppendRow() adds the row in training dataset (TA). Aftercomputation of training data, the machine learning lgorithm(Classifier) in step 10. The trained model predicts theattribute labels of new unseen statistical features.B.Data MappingThe main goal of the approach is to perform semantic mappingof input dataset. The architecture of SMOD model is shown inFigure 2.
227Figure 2. Architecture of SMOD System.applying the model does not cause any additional overheadexcept complexity of classifier.It comprises of three phases:VI. Experimental Evaluation and Results1) Data extraction: It collects the dataset from data sources.The data set used in the approach are from both static andstreaming data. Various wrappers are implemented to extractthe multi-format data.2) Preprocessing: Preprocessing is an integral step toprepare the data to perform mapping. This step performs twotasks i.e. data cleaning and computation. Data cleaningimproves the quality of data. It is required as real data oftencontains missing and incorrect values. Subsequently, statisticalmeasures such as mean, max, min, quartiles are calculated forall attributes in the dataset of in the dataset.3) Machine learning for semantic mapping: A supervisedmachine learning algorithm is implemented for mapping localattribute label to its global attribute label. The proposedapproach, use a multi-class classification algorithm oncomputed statistical measures, as computed in previous phase.The local and global mapped attributes are stored in a database.It is used in various applications that requires data retrieval andintegration from Polystore databases, as discussed in section 2.The Algorithm 2 shows the steps performed for attributemapping. A[] is the input test dataset values of attribute, A.The algorithm first computes statistical measures on attributevalues using ComputeStatistics(), thereafter, the trainingmodel (TrainedModel()) accepts the statistical values as inputfeatures and returns the global attribute mapping(MapA).C.SMOD ComplexityThe complexity of the proposed approach SMOD, lies in thegeneration of training datasets as shown in Algorithm 1. Togenerate n number of training data, n number of distinctdatasets are required. The statistical attributes are computedfor each attribute of distinct data sources. In generation ofclass balance training dataset, if k is the number of attributes ineach dataset, then statistical attributes are computed for all(n*k) attributes.Calculation of statistics for an attribute is a constant timeoperation. Therefore, the worst-case complexity for trainingset generation is O(n*k).To apply the proposed approach for mapping of attribute A(Algorithm 2), the statistical properties are computed andtrained model is applied on it to produce the mapped globaloutput. Thus, complexity of applying proposed approach isproportional to the time taken by chosen classifier. Therefore,This section describes the experimental setup and discuss thevaluation results, on applying multiclass classificationalgorithms in the proposed approach. The validation of resultsis also performed on different datasets to find the best suitablealgorithm.A.DatasetsThe patient health is monitored during each visit at hospitalsas well as with the use of health monitoring wearable devices.The limited use of health standards results in data storage instandardized and non-standardized data formats. In view of it,the non-invasive blood pressure readings are taken from threecategories of data sources. The first dataset is syntheticallycreated BP observations in standardized HL7 FHIR in JSONformat [25]. The second category is non-standardized datasettaken from online repositories. The third data source isstreaming BP data created synthetically. There are variousfactors affecting BP of an individual such as age, height, sex. Inaddition to this, people suffering from disease shows differencein their BP observations Therefore, non-standardized categoryof BP observations is selected from two datasets; oneassociated with predicting relation between BP and Body MassIndex [26] and other from cardiovascular disease dataset inCSV file format [27]. The dataset contains 70,400 instances ofdifferent patients. Since, there is no datasets available whichonly contains BP attributes, so the desired attributes areselected from different data sources using various softwarewrappers. The experiments are carried out on localhostnetwork. The research work makes the assumption that theattribute used for BP data are in accordance with one assuggested by OpenEHR standard.B.Data PreprocessingPreprocessing is performed on the relevant BP features suchas Systolic BP(SYS), Diastolic BP(DYS), Pulse Pressure (PP),Mean Arterial Pressure (MAP). Data cleaning transforms andfilters the raw data into useful format. Datasets taken fromvarious data sources contain negative BP values, incorrect BPreadings (in thousands). Such anomalies are removed usingimputation technique by replacing impurities from theirattribute mean value.In case of streaming data, the artificial data streams aregenerated on Kafka producer in Key-value pair format. Thestatistical measures are computed on Key-value data stream.The resulted computations are stored in CSV data file format.The computed datastore is then trained just like other staticdata sources for predicting the attribute global class labels fornew datasets. However, all the clinical datasets do not recordall the BP attributes readings as suggested by OpenEHRarchetype. Therefore, the remaining features values iscomputed from the given systolic (SYS) and Diastolic (DYS)data, such as Pulse Pressure (PP) and Mean Arterial Pressure
228Gupta and Gupta(MAP) using the standard formula as:Statistical measures such as mean, min and max are computedfor each attribute of datasets. The result of statisticalcomputations of each attribute are stored in a separate file asfeatures with its known target class as SYS, DYS, PP or MAP.In the proposed approach, the statistical properties of oneattribute from a data source contributes for building oneinstance of training data. Collecting data from such largenumber of data sources in not possible, so we divide the datasetcollected in group of 50 instances and computed the statisticalproperties of each group. This technique results in 1408instances of training data.C.Training and Testing SMOD modelThe training dataset has 4 target classes SYS, DYS, PP andMAP. The following points are considered in selection ofmulti-class algorithms. These are:a) Since, the boundaries of normal BP attributes are clearlydefined [28], it is less than 120 for systolic, less than 80 fordiastolic, between 40 and 60 for pulse pressure, and between70 and 100 for mean arterial pressure. It indicates highpotential for linear separable decision boundaries [29].b) Some raised Blood Pressure data values i.e., systolicblood pressure is greater or equal to 120 or diastolic value isgreater or equal to 80, shows class overlapping with normalrange of BP values. However, computation of statisticalmeasures of such datasets normalizes the data values and thusreduces the overlapping problem.c) SVM, KNN, Naive Bayes and Neural network are themulti-class classification algorithms which are used forstatistical inference and machine learning[30]. They alsoworked well to capture meanings and semantic relationships intextual data[31], for instance, Naïve bayes and KNN are usedin [32] for schema mapping while Neural networkclassification performed well in [7] for mapping various datasources.The proposed approach is compared on 5 different multiclassclassifiers i.e., Support Vector Machine (SVM), K-NearestNeighbor (KNN), Naive Bayes, Logistic Regression andNeural network algorithms. In general, Naïve bayes, andlogistic regression algorithms are used for linear separabledatasets, while SVM and KNN both works for linear andnon-linear classification problems[33]. Neural network abilityto train non-linear and complex relationship in data.The classification algorithms are evaluated using twotechniques:1) k-fold Cross Validation (CV)In cross validation technique the given data sample is dividedinto k subsets, out of which one subset act as a test data andrest all is training data. The classifier is trained with trainingdata and evaluate with test data. The process repeats k timeswith different subset of test data. The most common value ofparameter k is 5 and 10. The Tables 2 to 6 depicts the averageaccuracy achieved in each fold, corresponding to each cvvalues. The results demonstrate that the classificationalgorithms show higher accuracy when evaluating it using10-fold cross ------------------------------CVAvg. --------------------------
metric of data stream sliding window. S. Benny et al. [17] worked on the problem of entity resolution in streaming data. The similarity score for entity mapping is generated using Hadoop MapReduce framework and is used for matching data streams. Erhard Rahm et al. [18] compared various e